Asymco

Asymmetric Intelligence

net income

  1. Apple has moved on

    Research · 36 comments

    When Apple changed its name from Apple Computer to Apple Inc. they signaled that their business has moved on. We can say it's to devices or to mobile computing or to the Post-PC era. To understand that this is not a shift driven only by wishful thinking we can plot the change in volumes for the platform-based devices Apple sells.
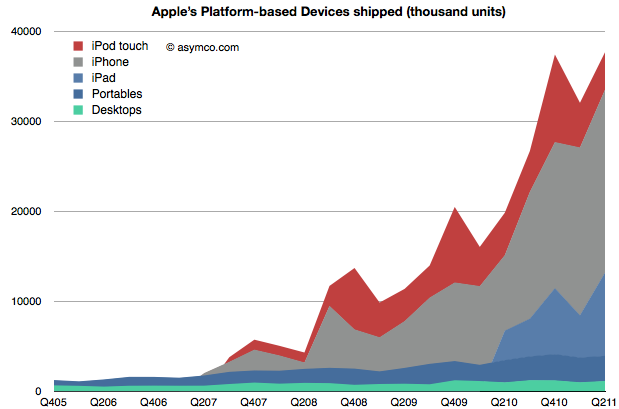
    The stack of products is shown in an increasing level of mobility. At the bottom is the non-portable desktop Mac, above are Mac portables (laptops) followed by the iPad, iPhone and iPod touch. The mobile computers Apple sells are explosively more popular (and important).

    To gauge importance consider the following chart which shows the unit values above multiplied by the average price they are able to obtain for a picture of the sales mix.
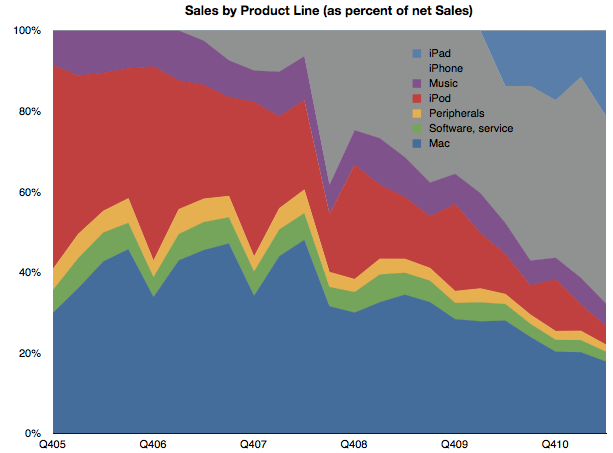
    (I also added Peripherals, Music and Software sales as well as iPod (non-touch) for a complete split of revenues).

    Mobile computers are now well above half the revenue base for Apple. Finally, if we consider the contribution to profitability of each product line, we can see how iOS-enabled products (as a proxy for mobile computing) have become the vast bulk of profit creation for Apple.
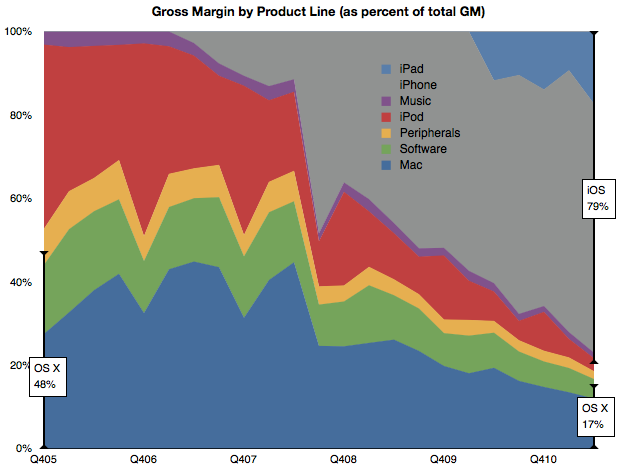
    By this metric, we can see that mobile computing (as opposed to portable or immobile computing) is driving 80% of Apple's profitability. This 80/20 mix of mobile/non-mobile should put aside any doubts that Apple has moved on to be a business oriented around mobility rather than traditional computing.

    This cannot be said for many of Apple's contemporaries. Microsoft derives negligible revenues from mobility. Neither does Intel, nor Dell or HP and even Google's revenue lines don't make mention of mobile income.

    In fact, the only companies which do have mobile revenues as 80% of their income are those dedicated to telecom markets. Namely, Nokia, Motorola, Sony Ericsson, RIM et. al. But, as we shall see in the quarterly mobile market overview, few of Apple's mobile-focused competitors are doing well.

    So Apple is a unique company that has made the transition from one industry to another and, in so doing, captured the bulk of the profits. In passing, I should also mention that the traditional Mac business is still doing well and, by some measures, is capturing the bulk of the PC hardware profits.

    So the key to much of assessing Apple's value and opportunity should be based on this new market (mobile computing) rather than the traditional competitive landscape of PCs and operating systems. The company has moved on, now we wait to see how long before analysis of the company follows.
  2. A new way to value Apple

    Research · 38 comments

    Almost all valuation models for Apple assume it's a hardware company. The modeling algorithm for hardware is simple:

    • For each year in near future
    • For each product line
    • Compute contribution
    • Determine company value by summing contributions and multiplying by a P/E ratio

    The major difficulty is in predicting the growth of each product line. This is difficult because buyers can be fickle. Companies employs all sorts of tools in order to secure repeat customers but if switching costs are low, the company can crash in value. For this reason, analysts pick various ways to predict device  sales. Some choose to index each product on production (channel checks), demand (customer surveys,)  or even on a top-down share of total (market research on growth of whole market and assumptions of share).

    Although simple and convenient, this model does not probably match the way Apple is managed. The company does not build hardware products to sell and forget. It builds platforms which are best seen as sources of recurring revenues. Users are incentivized to continue buying devices. iCloud, iTunes and other Apple properties are expressly designed to that goal--and they are not cheap to run. So, the company must see the world through a different set of lenses than the default model shown above.

    To think about the business like they do, we need to put the data through a similar set of lenses. I began with a modest proposal last month to value each user as a source of recurring revenue. Now it's time to expand on this method.

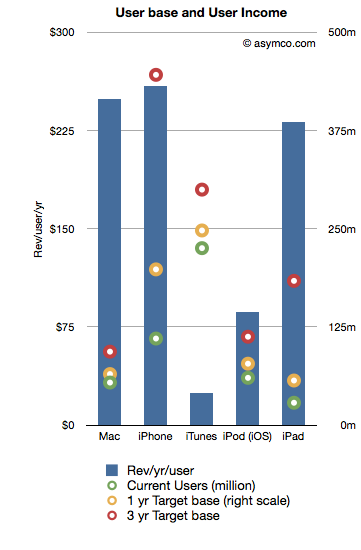
    The following chart shows the recurring revenues per user by product and the current and possible future size of user bases.[2]

    Revenues/yr/user are bars with the left axis and the User bases are various colored circles indexed with the right axis.

    The assumptions that went into the data are as follows:

    1. Device life span is as per previous article linked above
    2. User base growth for 1 year is: Mac 20%, iPhone 80%, iTunes 10%, iPod 30%, iPad 100%
    3. User base growth for 2nd and 3rd years (recurring): Mac 20%, iPhone 50%, iTunes 10%, iPod 20%, iPad 80%.
    4. The Revenue per user is assumed constant

    Note that the user base growth figures are lower than the product growth levels seen historically. Obviously, the model is highly sensitive to these growth assumptions so they need to be scrutinized and tested rigorously.

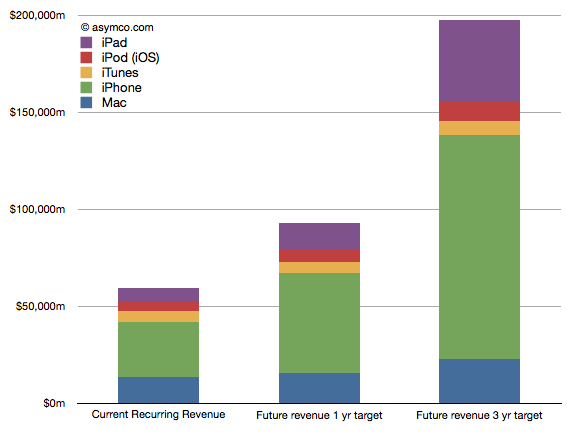
    Nevertheless, as a straw-man proposal,  the recurring revenues for all these products[1] is shown in the following chart:

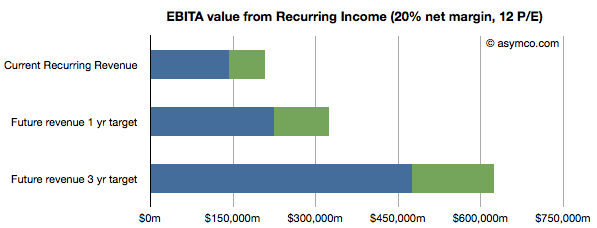
    Once the income is estimated, we can take that value and assume a profit margin (net) and then multiply the earnings by a multiple. Using a 20% net margin and 12x P/E yields the following chart.

    (I added an assumed level of cash in green.)

    This model would imply that the company today could be valued at $208 billion on the basis of its installed base alone. That value would be about $323 billion in one year and $620 billion in three years. Dividing by the number of shares outstanding (935m this year increasing at 2% a year) yields a share price of $222, $339 and $629 by mid 2014.

    These values can be considered "lower bounds" on valuation since they assume income from previously secured customers. The speculative part of investment would be based on what the future bases will look like (so, for example, if one believes these assumptions, the $629 figure could be considered a target to be discounted to today).

    ---

    Notes:

    1. Excludes Software, Peripherals, non-iOS devices, and any other service revenue.
    2. Compare this char to social media companies (MIT Technology Review)
  3. The app industry vs. the music industry

    Research · 25 comments

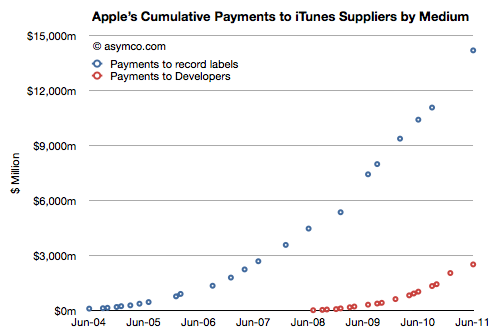
    By my estimate, Apple has paid out $16.6 billion to content owners. $2.5 billion to app developers and about $14 billion to music companies. The developer payments are published by Apple, the music payments are estimated based on total downloads and guesses about the split and pricing of that content (90% for the content and $1 to $1.2 average pricing over time.) There might be reason to move the music figure up or down but the difference will still be nearly a factor of 5.

    The cumulative payments are shown in the following chart:

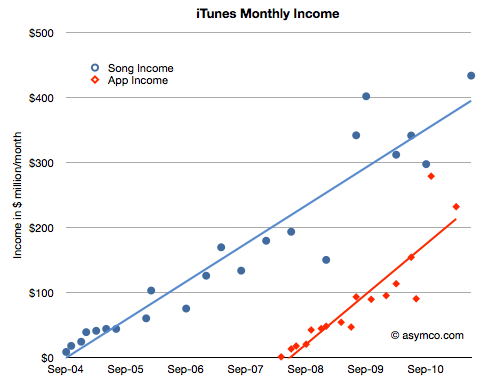
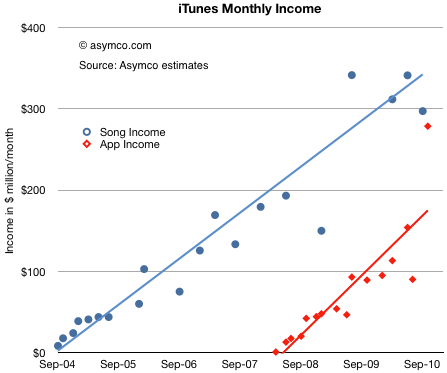
    From this perspective, the music business is still a far bigger ecosystem than apps. However that's cumulative data and digital music has been around far longer. The story can be told a different way: What's the rate of sale in the present period? From what we know about the business, we can see what Apple takes in for apps and music (I've already estimated what Apple "keeps" after paying content owners)

    The combined "sales rate" is a remarkable $665 million per month, but the split now is that music generates only twice the income of apps (i.e. cumulative is a factor of 5 but on a monthly basis the factor is 2). But what should be more impressive is how quickly the app business is ramping. By the slope of the trend lines, it would appear that app income will exceed music income within three years. Therefore, it's only a matter of time before apps generate as much income (exclusive of advertising) as music.

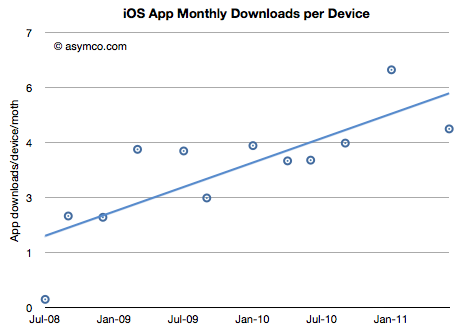
    Another perspective is the number of downloads per device per month. This shows that the rate of consumption of apps is increasing and is now about 6 apps per device per month.

    (You have to think of apps not as traditional computer applications or console games where each device has a certain number of expected apps attached, but rather that apps are more like a subscription where there is recurring monthly income).

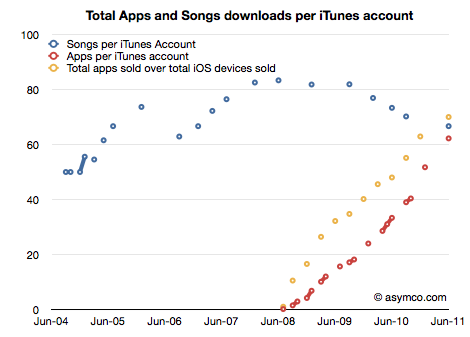
    I don't have a comparable figure for music because the number of iPods and Macs as target devices is hard to estimate, but I doubt consumption for music on a per device basis is increasing. As a consolation, I can estimate the number of apps or songs per iTunes account. Here the story is consistent.

    Each iTunes account has "consumed" about 67 songs but also 62 apps. Remarkable parity in such a short time. And the trend speaks for itself.

    All this data points again to the ascendancy of apps as a new medium. In a mere three years these digital objects have redefined themselves. They went from being tools to enhance the use of your phone to a new medium of expression and art. They have the ability to create a powerful economy of their own and will likely lead a profound shift in where value resides in mobile computing.

  4. Microsoft has received five times more income from Android than from Windows Phone

    Research · 197 comments

    Microsoft gets $5 for every HTC phone running Android, according to Citi analyst Walter Pritchard, who released a big report on Microsoft this morning.

    Microsoft is getting that money thanks to a patent settlement with HTC over intellectual property infringement.

    Microsoft is suing other Android phone makers, and it's looking for $7.50 to $12.50 per device, says Pritchard.

    HTC Pays Microsoft $5 Per Android Phone, Says Citi.

    A rough estimate of the number of HTC Android devices shipped is 30 million. If HTC paid $5 per unit to Microsoft, that adds up to $150 million Android revenues for Microsoft.

    Microsoft has admitted selling 2 million Windows Phone licenses (though not devices.) Estimating that the license fee is $15/WP phone, that makes Windows Phone revenues to date $30 million.

    So Microsoft has received five times more income from Android than from Windows Phone.

    Looking forward and assuming that Microsoft can receive this type of settlement from about half of the Android license takers, then the prospects of a windfall from Android dwarf the expected income from Windows Phone.

    Google's Android seems the best thing that could have happened to Microsoft's mobile efforts, ever.

    I could also calculate how the Android license income could be further funneled to Nokia (via their current agreement with Microsoft) for promotion of its phones. Thus, an Android licensee could reduce his margins in order to promote a competitor's products.

  5. How long before apps overtake physical video game content sales?

    Research · 28 comments

    After reviewing the payments to suppliers, we can look at the store's revenue generation rate. With the same assumptions, we have the following chart:

    We will have to wait for another report to see whether the recent burst of volume from apps is sustained[1], but the trend shows income from apps narrowing the gap to music. In the last few months apps may have been generating $300 million/month[2].

    The blue line above can be interpreted as an arrow aimed at the music industry. We know how that turned out. The red line above can also be interpreted as an arrow aimed at the gaming industry. What are the chances it will play out the same way?

    According to NPD, U.S. retail sales of new physical video game content, which includes portable, console and PC game software, generated revenues of $10.1 billion in 2010. That's $840 million per month. A big number compared to the app business. The trouble is that the figure is going down (-5% from the year before).

    If you look at the red line above and its slope, it would indicate that, given time, the App store will overtake the entire physical media gaming industry. The time when that happens will depend a lot on the growth or decline of the physical game media business, but another four years seems a safe bet.

    Would this cause the same effect to the industry as digital music had when it replaced physical media? I would say yes. The main reason is that physical media has associated with it a different sales cycle and margin. These factors determine the processes and cost structures of incumbents. Such changes are very difficult to absorb and adapt to.

    ----

    Notes:

    1. App sales are highly seasonal as there is a burst of downloads post-holidays.
    2. Apple reports iTunes income in financial reports. In the third quarter it reported $1.2 billion in revenues. This is roughly consistent with the data above given that the analysis excludes iBooks, Movie and TV Show sales and rentals.
  6. Wall Street's Infinite Loop: How AAPL is valued

    Research · 30 comments

    In the previous article discussing the growth scorecard, I left open the question of how Apple's growth is reflected in its share price.

    The approach to answering this question is to show how the share price correlates to that growth. The challenge for analysts has been that the company switched from subscription to current accounting for the iPhone (the largest component in its income statement). As they re-stated income and thus earnings, any historic review of P/E or other multiples of Earnings have to also be re-computed.

    So this is what I've done:

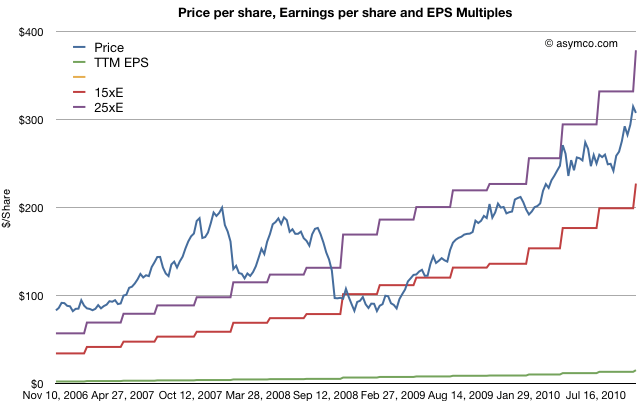
    The first chart shows Apple's price per share (blue) vs. its trailing twelve months earnings (green) and multiples of those earnings (15x and 25x).

    The chart shows how Apple was priced well above 25 P/E before October 2008 and has remained within the 15 to 25 multiple bands since the winter of 2008/2009. This seems fairly reasonable and the stock's rise is a cause of celebration for many, but a cause for concern for some. Is this rise in price matching a rise in value?

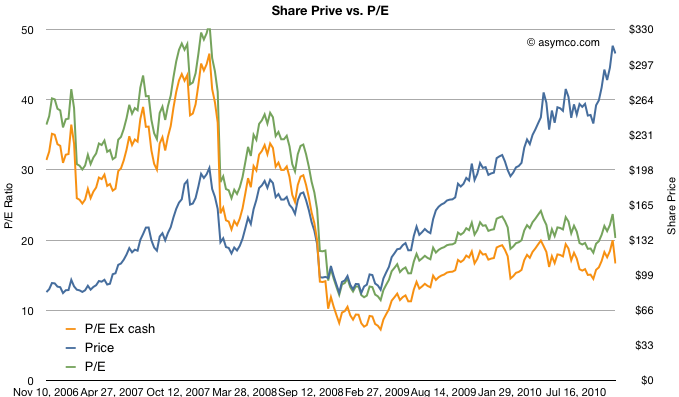
    To answer, we need a way to look at the valuation of Apple. One way is to plot the P/E ratio over time. That would show how the market perceives the value of the company (i.e. how many years' worth of earnings is built into the price) The chart below does that.

    I took the additional steps of plotting the P/E excluding cash from the price to show "P/E Ex cash" in the orange colored line and I also copied the Share price line from the first chart on this one for contrast.

    What the P/E analysis shows is that as the stock rose, it's P/E ratio fell. This means that the "valuation" of the company is quite a bit lower now than it was in 2006 and 2007. In fact, as a multiple of profitability, Apple's stock is nearly half as valuable now as before the recession.

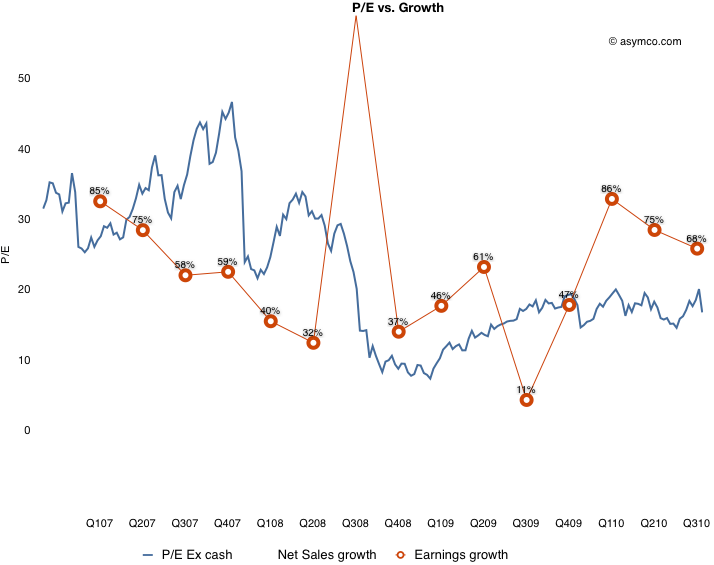
    Since valuation is usually correlated with growth, (P/E is often compared in a ratio with Growth) we need to see whether the P/E in the chart above matches the actual growth of earnings. Fortunately we have just measured growth with the scorecard.  Here are the two charts together:

    What this shows is that while earnings growth did slow down in the lead-up to recession (with the hugely anomalous 3G launch spiking growth to 155% in Q308 causing the year-later plunge to 11%), growth picked up again in the depths of recession and has moved back to pre-recession levels. The only difference is that the multiple assigned to the stock has remained near recession lows. This is visualized by the blue line being mostly above the red line pre-crash and usually under it post-crash.

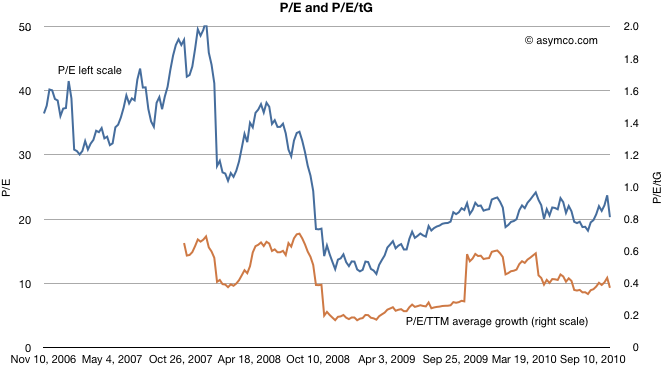
    To put a finer point on this, I plot the ratio of P/E and trailing growth (P/E/tG) in the brown line below:

    It shows that as a measure of valuation with respect to growth, Apple is trending down. A P/E/tG ratio of 0.4 and closer to 0.2 if we exclude cash shows very weak confidence.

    The only conclusion I can draw is that the market does not believe that Apple has significant growth opportunities. A P/E of 20 with consistent 70% growth is, to be blunt, damnation. For comparison, Amazon just reported 16% growth in earnings and was rewarded with a P/E of 68.

    Amazon notwithstanding, is Apple an anomaly? Is the disconnect between earnings growth and the stock price unique to Apple or does it apply to most other equities? Is pessimism about Apple a symptom of pessimism in general? I will suggest a way to answer this in a future article.

  7. It takes nearly $1 billion/yr to run iTunes

    Research · 44 comments

    In recent articles I highlighted the acceleration in iTunes App downloads where the rate is approaching 18 million apps per day and the cumulative total apps which is about to overtake the cumulative songs downloaded.

    We now turn our attention now to constructing the iTunes income statement: namely total sales, gross margins and deduce its operating budget.

    Gross Sales

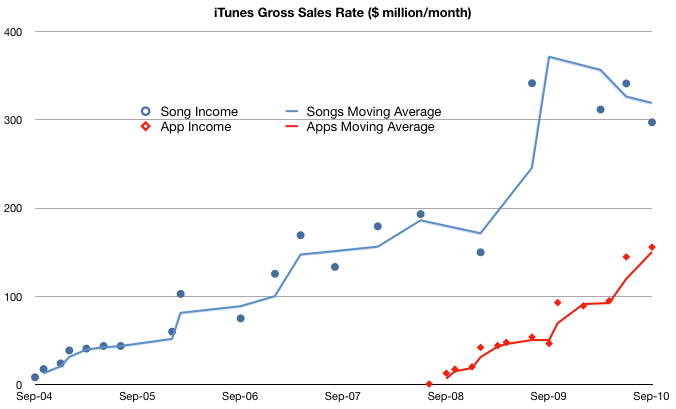
    To obtain the top line (income) for iTunes we need to know the average selling price (ASP) for songs and for apps. Apps are easy, we received that info in June: $0.29 per app. For songs, it was easy before early last year: $0.99/song. After the selective price increase, the blended price needs to be estimated. I chose $1.10 for 2009 and $1.2 for 2010. These are just assumptions and can be adjusted but should give us a rough estimate:

    I followed the convention of using income rate or $/month to show the history of sales. It shows that even with a price less than a third of the music product, apps are generating over half of the sales of music. In other words, apps are adding 50% to iTunes sales today. If the decline in music units continues and the app sales increase with the current trajectory then app sales value will overtake music sales next year, consistent with the cross-over of cumulative units sold.

    Gross Margin

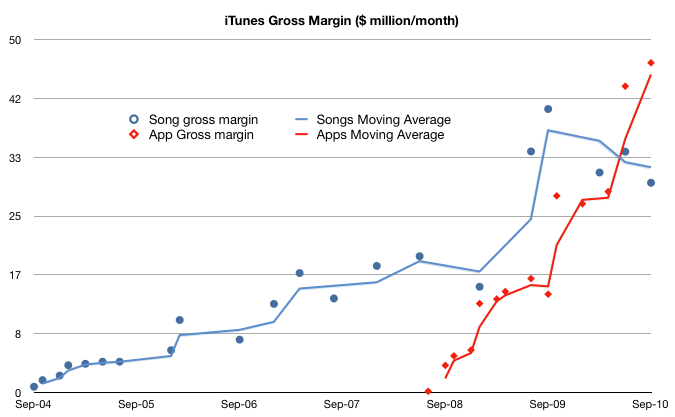
    If we know how much Apple pays music licensors and developers (i.e. cost of goods sold) we can calculate how much it keeps for operations (gross margin). Apple's app margin is 30 percent. The music margin was never official but the consensus has been 10 percent for a while.

    Using these figures, we get the following chart:

    This shows that what is left after paying the content license, Apple "keeps" about $50 million every month to run the App store (iTAS) and another $30 million to run the Music store (iTMS).

    The Operating Budget

    Apple has made a point of saying that both iTAS and iTMS are run at "break even" implying that the gross margin is used up in operating costs (CAPEX, R&D, SG&A). To be sure, the cost of bandwidth and the data center(s) needed must be considerable.

    But the operating budget for the store is beginning to reach a level that may be beyond what can be spent reasonably. The amount left over for operations has increased from ~$30 million a month in 2009 to $75 million/month today.

    In fact, if this burn rate is maintained (even though it's increasing) the operating budget for iTunes is nearing $1 billion/yr.

    I'm not an expert on the cost of operating data centers but $ 1billion a year seems like a lot. I would love to see an analysis of how this could be allocated.

    Implications

    I would also add that because of the increasing mix of apps, the overall gross margin percent is increasing. I estimate that to be a blended 17%--a healthy margin for a content store--and an increase from 10% before the app store came online.

    Finally, one implication of the economics involved is that a budget like this may provide a significant barrier to entry for any competitors looking to take on the iTunes juggernaut. iTunes has reached content critical mass (12 million songs), user base (160 million users) and wide distribution (23 countries for songs and 80+ countries for apps).

    These are non-trivial operational issues that even the best in the "cloud" business models will find challenging.

    Footnote:

    This discussion excludes video sales, rentals, book sales as we don't have solid histories for these product lines. However, we can do a spot check on the cumulative totals:

    • 450 million TV episodes downloaded implies $1 billion in sales.
    • 100 million movies downloaded probably adds at least another $1 billion
    • 35 million books adds another 500 million.
    • Compare with 11.7 billion songs at ASP of $1 for about $12 billion in song sales and 6.5 billion apps at ASP of $0.29 or about $1.9 billion.

    iTMS content downloads have generated $16.4 billion in sales to date.

  8. Double dip, with sprinkles on top

    Research · 5 comments

    Apple just had its best quarter ever with net income rising 78 percent to $3.51 per share. Revenue rose 61 percent, to $15.7 billion.

    On average, Wall Street analysts had expected Apple to report net income of $3.12 a share on revenue of $14.75 billion.

    If this is a double dip recession, then I'll take triple dip with sprinkles on top.

  9. Nexus One: 80k units in first month -Flurry

    Research

    Google sold about 80,000 Nexus One smart phones in their first month on the market, according research firm Flurry,Dow Jones Newswires reports.

    By contrast, Apple sold about 600,000 iPhones when it launched the device in 2007, the story notes; the Motorola Droid sold 525,000 in the first month, according to Flurry.

    Flurry estimates sales by measuring mobile applications usage and then extrapolating overall ownership.

    Andy Rubin, head of Android said they hoped to sell 150k units, so this would be a very good start for the brand.

    I would also like to estimate the revenue that Google probably earned from this phone so far. Assuming HTC receives a gross margin of 35% and the bill of materials is $174, then Google would have a gross income from the device of about $270/unit (based on $529 price).

    Google could still have to pay for shipping, returns, warranties, etc. so their income might be closer to $220.

    The income before operating expenses would therefore be $17.5 million in the first month.

    I should point out that this would be the first income Android has ever received as the software is available free of charge.