Today Apple announced both a dividend and a share re-purchase plan which, when combined, will consume 45% of Apple's current US cash reserves.
The dividend will be $2.65/share/quarter and the buyback will cost $10 billion over three years. The dividend will therefore cost about $2.5 billion per quarter (starting next quarter) and the re-purchase will cost about $833 million per quarter (starting next fiscal year).
However, note that Apple's cash has been growing far more quickly. It increased by $16 billion last quarter or $37 billion over the last year. This rate of increase is itself increasing.
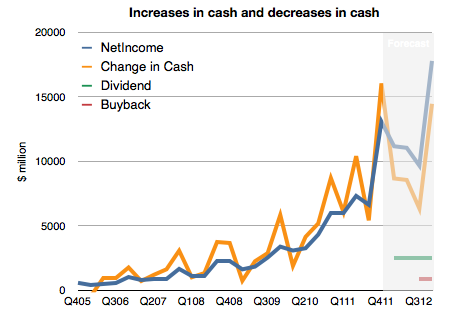
To illustrate, I prepared the following chart. It shows historic net income, change in cash and a forecast of the costs of the new uses of cash and future net income (based on my estimates).
I made an assumption that future cash growth will equal net earnings minus costs for the new dividend and share re-purchase. What we should see is that the previously tight coupling between increase in cash and earnings will remain but that there will be a negative offset by $3.333 billion each quarter. In other words, cash will increase but at a slower rate.
This means Apple's total cash should still grow by more than $35 billion this year.
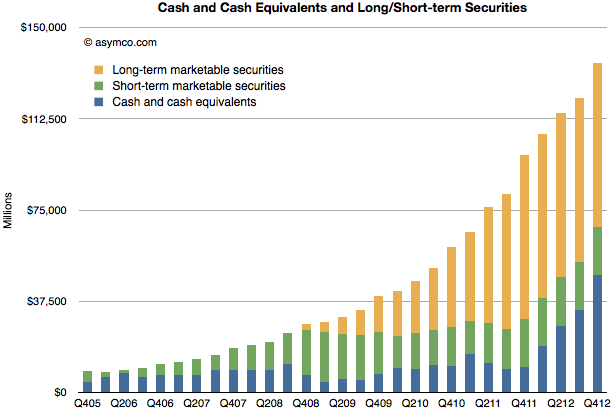
That would result in the following, more subdued, total cash trajectory (for simplicity, I assumed all added cash would be in cash and cash equivalent accounts)
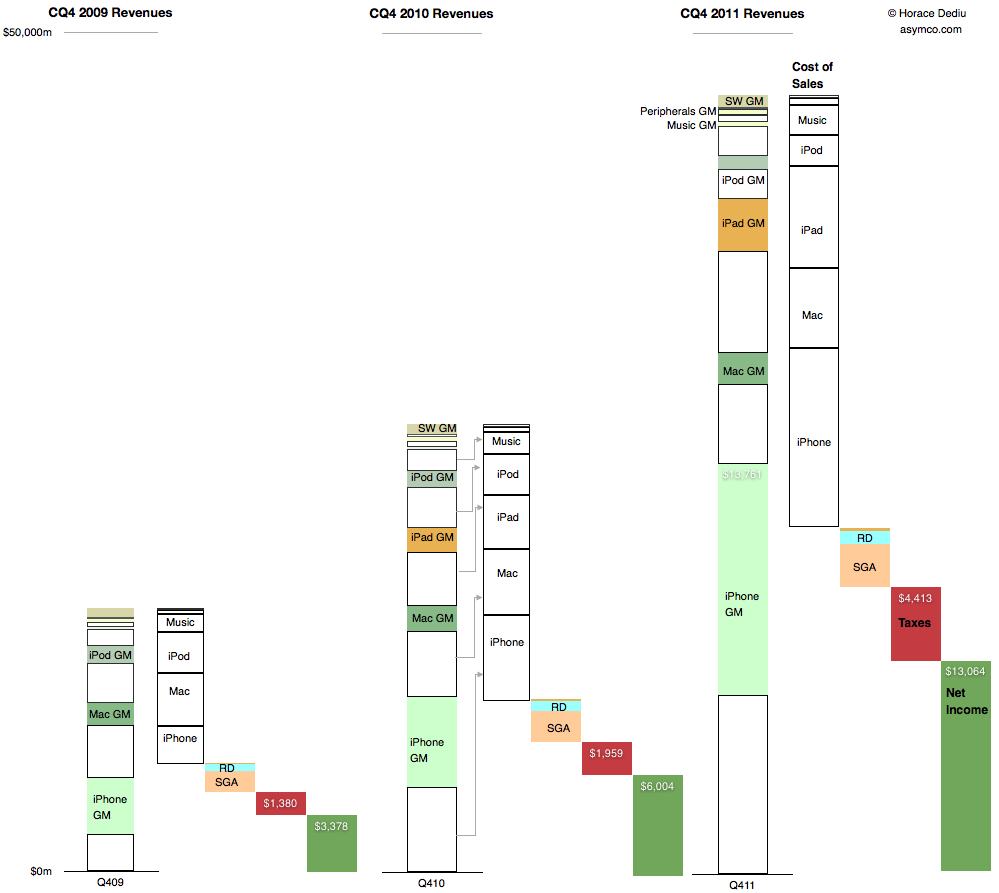
This is a summary view of Apple's income statement for the fourth quarter of 2009, 2010 and 2011. The full size is 999x893 pixels. Click on image below for full size bitmap.
The convention used is to show revenues in the first column, cost of sales in the second followed by operating expenses, taxes and net income in the last (dark green) column.
For the revenue column, individual products are shown stacked from highest to lowest revenues and further divided into variable costs and gross margin.
The costs are then drawn separately leaving net income (or profit). Ratios between various quantities can be visualized:
Gross Margin percentages are ratios between the empty boxes and their colored counterparts
Operating expenses as a percent of sales are the third column in relation to the first.
Tax rates are the fourth column as a percent of the fourth plus the fifth, etc.
Finally, the rate of year-on-year growth in all these quantities can be seen by looking through column sets left to right.
Given this perspective it's perhaps more obvious how much and from which business Apple has grown.
One of the more interesting numbers reported by Tim Cook during the last earnings conference call was the total payment to developers during the fourth quarter. This is the first time that Apple reported a quarterly payout to developers.
The figure was $700 million and it was mentioned in reference to the total payments to date of $4 billion. The $700 million is interesting at least because it gives an idea of what Apple obtained in total sales of Apps. As it retains 30% and pays 70% to developers then it follows that it retained $300 million and the total "gross" sales was $1 billion in Q4.[1]
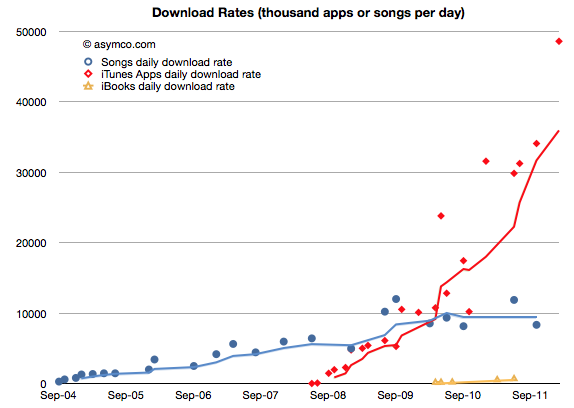
The $700 million is interesting for another reason. The $1 billion in gross income can be tested against another set of data. As the countdown has already started, sometime in February Apple will report 25 billion total apps downloaded. The last such milestone was October 4th when it reported 18 billion downloads. Assuming that they will cross 25 billion by February 25th, then we can obtain an estimate for the download rate per day: about 48.6 million apps/day.
That is a figure we can plot historically:
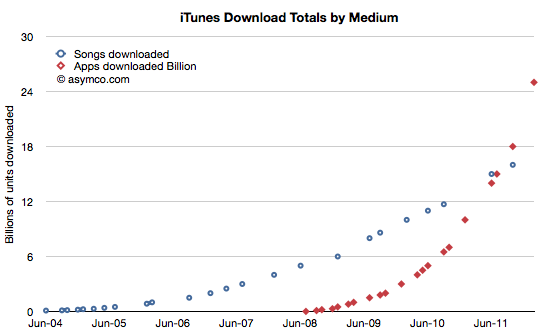
I plotted it in relation to the songs download rates obtained through a similar method. Although we don't have an update on total songs downloaded, the rate is unlikely to have accelerated as much as apps did. The following charts also shows the reported total downloads by media:
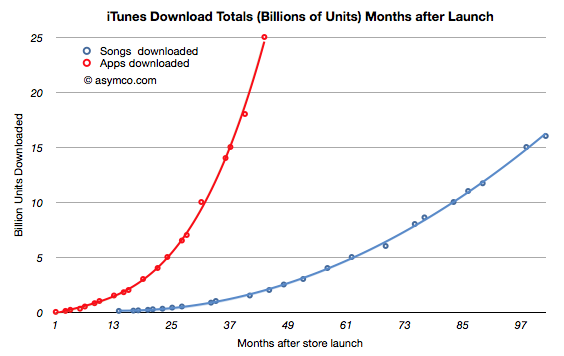
Normalizing to the same starting date, the two media ramps are shown below:
But back to the figure of $700 million paid to developers and the implied $1 billion in gross revenues. Taking that figure and dividing it by duration of the quarter yields a figure of $310 million per month gross app revenues. The 25 billion downloads to date paired with the $4 billion in payments to developers gives us an approximate revenue per download of 23c. Computing the monthly revenue from the 48.6 million/month rate we get about $316 million per month. Pretty close to the $301/mo that the quarterly payout implies. This therefore also confirms the 23c per download (it looks a bit high but not by much.)
So the $700 million payout and the $4 billion payout to date and the 25 billion downloads all fit together as consistent pieces of a puzzle that give insight into the iTunes economy.
Apple reported nearly $7 billion in iTunes stores revenue (though the apps were only counted for the 30% agency fee.) during 2011.
If gross revenues were measured, the iTunes economy was about $10 billion in 2011.
Payments to content publishers were in the vicinity of $7 billion of which $2.1bn was paid to developers.
Operating costs for iTunes were therefore approximately $3 billion/yr.
One other interesting result: Since iOS devices started shipping, there have been over 335 million units sold. As 25 billion apps have been downloaded into them then about 75 apps were downloaded for each unit sold. Since we know the average price (23c) and the payout ratio (70%) then all this boils down to the fact that each iOS device generates $17 of iTunes income from Apps alone. That also means that each iOS device sold results in a minimum payment of $12 to iOS developers.
I've noted that Apple should be valued as a recurring payment from a satisfied customer base. A contributor made a comment that summarized it well: the payment schedule is approximately $1/day per computing unit (device or computer or tablet).
Now it becomes clear that Apple should also be seen as a recurring ecosystem payment system. Given a 24 month lifecycle, the amount is approximately $0.5 per device per month.
In other words, if you are an iOS developer you should note iOS device sales and use the rule of thumb that each one sold creates fifty cents of monthly income for you and your peers to share.
----
Note:
Apple reported its iTunes income (as the anachronistic "Music" line item in its Income Statement) as $2.027 billion in Q4.It would be tempting then to think that Apple got $1 billion from apps and $1 billion from songs and videos and iBooks. This is not the case however. Apple does not report all its app income (what I call gross income). Under the "agency" model of retail sales it reports only the part it retains, keeping the 70% paid to developers off its books. Therefore, of the $2 billion in iTunes income, only $300 million were actually booked from apps. That therefore implies that Apple's "everything-but-apps" iTunes revenue was $1.7 billion. Note however that the non-app income is mostly gross income and the payouts on that income will be significant (as much as 90% depending on many factors).
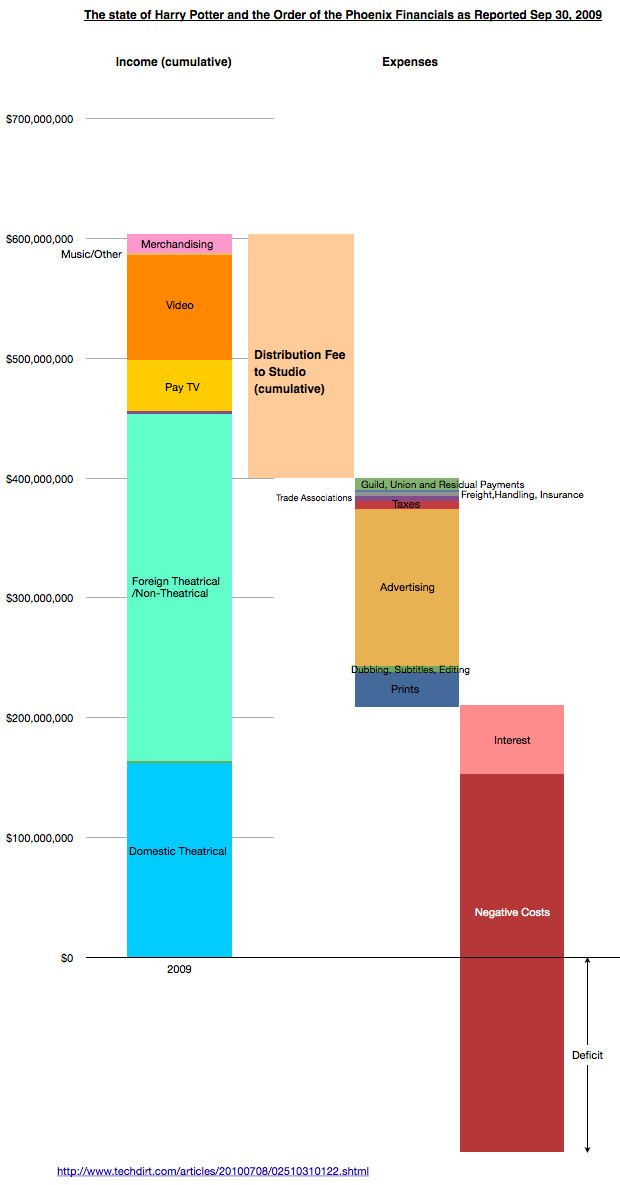
Continuing their discussion of the creative side of Hollywood accounting, Dan and Horace take a look at the way income from movies is distributed and why no movies ever make money. The observations sharpen focus on the over-arching influence distribution has on the creative process.
The following chart is a visualization designed to accompany the podcast:
Compensation based on "Net income" depends on there being a surplus rather than deficit. The problem is that the Fees and claims on income increase as they are defined as a percent of total income so the goal of break-even is a moving target.
The Negative Costs are approximated by the production costs as discussed and visualized in the previous podcast here.
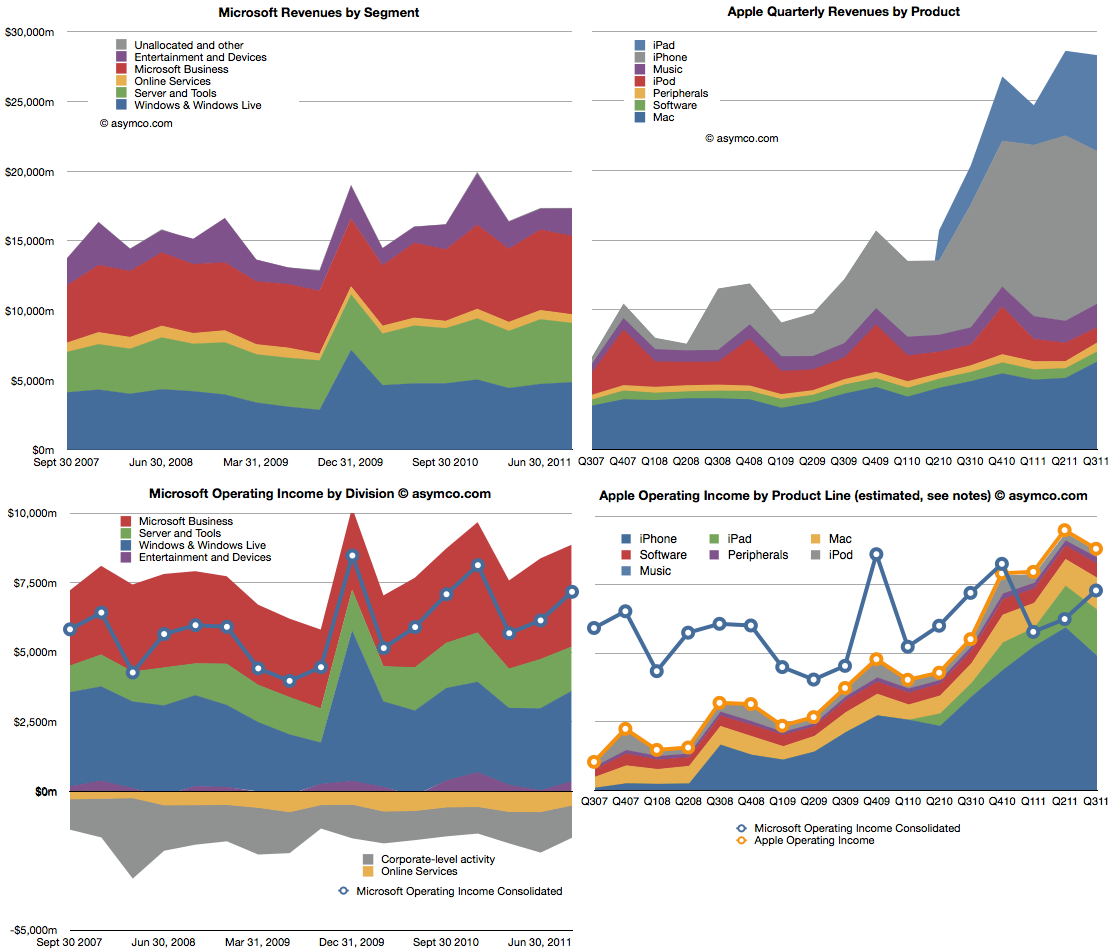
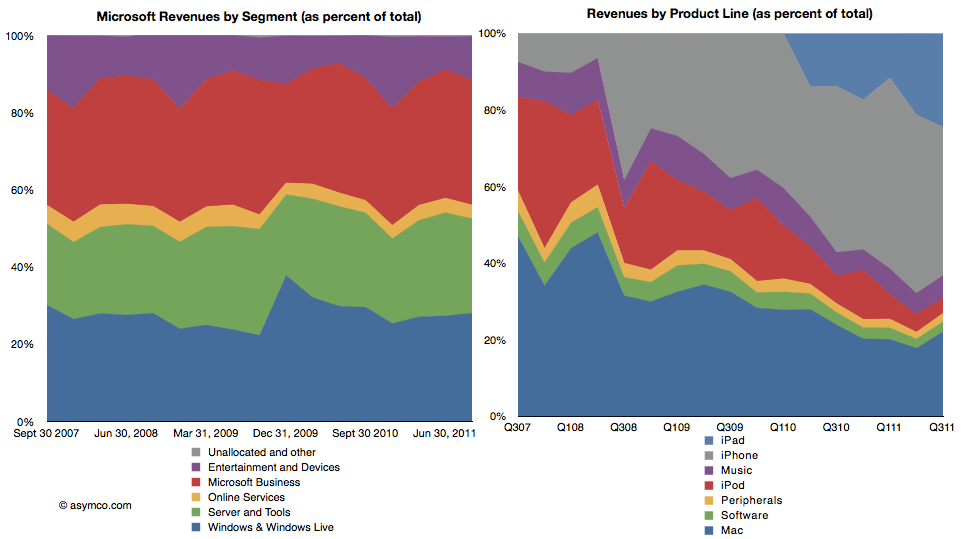
Microsoft is a stable business. Apple isn't. The following charts compare the two. The two charts on top show revenues, subdivided into product lines. Microsoft is on the left and Apple on the right. Note that the vertical scales are the same (zero to $30 billion/quarter).
The lower two charts show operating income by division/product line. The left is again Microsoft with the line showing the consolidated income (net of losses). The right chart shows the stacked areas of profit from Apple's product lines with the yellow line shooing consolidated income. I copied the blue line from the Microsoft chart for a more direct comparison.
Apple continues for the third quarter to have higher operating income and for the fifth quarter maintaining higher revenues.
The following two charts are also another way to view the two companies. As percent of total, how do the product/divisions stack up? The first is Microsoft revenues as percent of total and the second shows the equivalent for Apple.
This comparison I think is most evocative. The stability of Microsoft is contrasted with the dramatic change that Apple is experiencing in the same time frame.
There is a dramatic shift of focus from traditional computers (Mac) to devices. If profit is an indicator of where resources are being allocated, then there is no clearer visualization of the difference between the two companies' strategies.
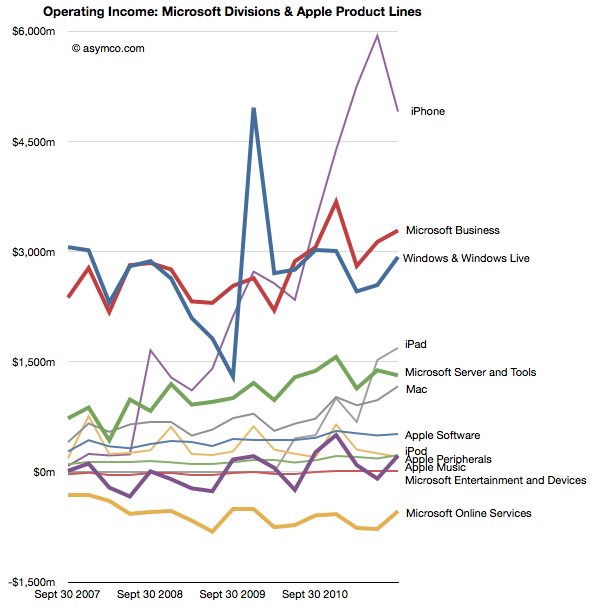
The following is a mix of all products/divisions operating income in one dense line chart (thicker lines are Microsoft divisions, thin lines are Apple products).
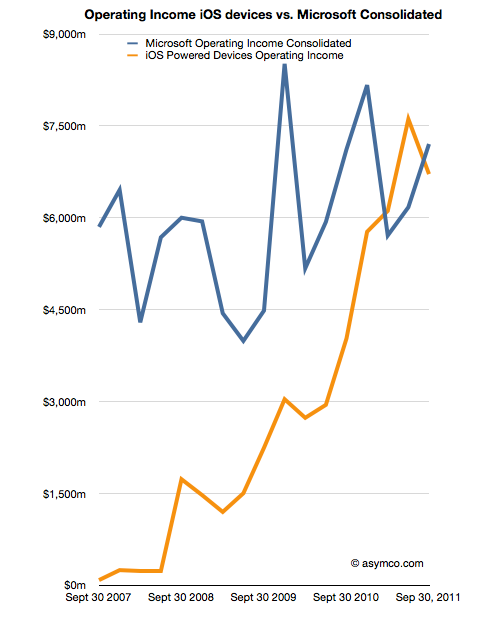
Finally, the comparison of operating income of iOS devices vs. consolidated operating income from all of Microsoft's businesses.
As iOS shifts into its fifth iteration my guess is that Apple will continue its growth trajectory. As Microsoft continues to adapt or protect its businesses from tablets and mobiles, will they grow? If so, how? Microsoft has shown consistency, but that is becoming less and less desirable.
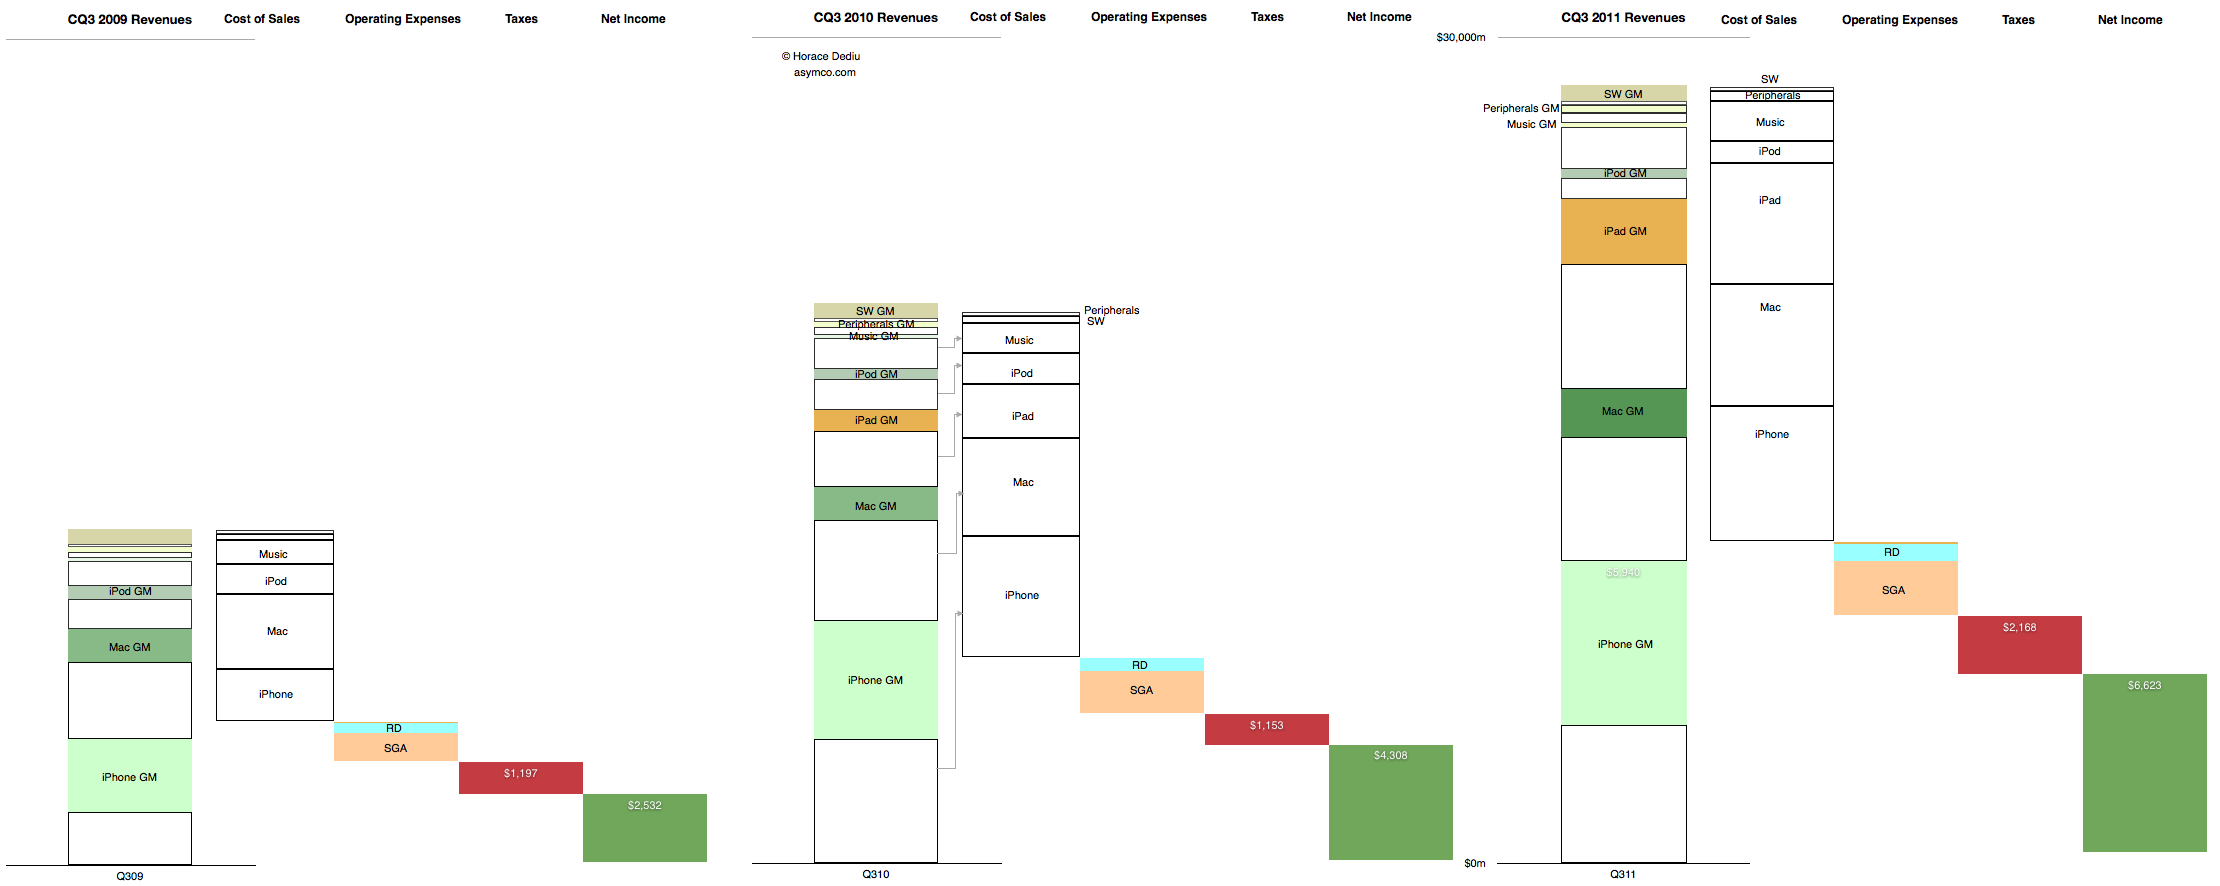
This is the cascading view of Apple's financial performance in the third calendar quarter. It only includes information that is already in the income statement but shows the relative growth of the individual product lines, their cost structures and the relationship between fixed (Operating) expenses and their variable (cost of sales) expenses at a glance.
In the past I would publish current and year-ago data, but in this quarter's summary I present three years' history of quarterly data. Note that the full view is quite large (2,220 x 886 pixels).
Here are some handy tips on how to read the chart:
The "top line" is the size of the first column in each quarter's chart.
The "bottom line" is the size of the last column.
The blank areas are what Apple pays suppliers.
The red area is what Apple pays to the government.
The Pink and pale blue area is what Apple pays its "exempt" employees. (Other Income and Expense is also included but is nearly invisible).
The Green area is what is declared as earned and becomes the "E" as part of the P/E ratio. (Note that not all of this goes to the Cash account as the cash flow statement will reveal).
The colored areas in the first column labeled with product name and "GM" (for gross margin) represent what Apple keeps from the sale of each product after paying expenses tied to producing that product.
The ratio of sold areas to the corresponding white areas below in the first column represent the margin (as a percent) per product line
You can observe the trend over three years by tracking each of these quantities from left to right.
The scale of the chart is shown by the line near the top representing $30 billion.
I began comparing Microsoft and Apple's financial performance with a review of "top line" or revenues by product lines over a four year period.
This post is about the "bottom line" for the same companies and products.
Before I jump in I would like to make sure there is no confusion about the terms. I will be comparing "operating income"[1] as a measure of "bottom line". This is a common way to compare the profitability of companies because it excludes taxes and interest income. These non-operating expenses/income can distort a comparison of performance because they can be the result of investment activity or changes in tax law or where the company is domiciled. One should not make judgements of comparative performance on those non-operational bases.[2]
Another challenge is that some companies report operating income by division while others don't. We can usually compare overall operating income but usually not on a division or product-level. This is the challenge I will try to overcome in this analysis between two very different operating models.
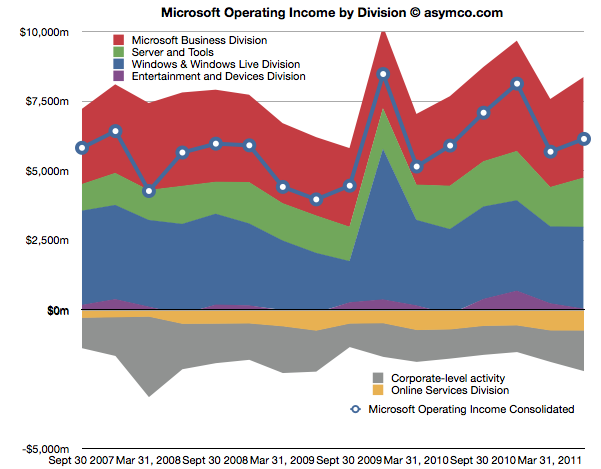
The first chart shows Microsoft's Operating Income by Division as reported by the company.
Each area represents a business division. Note some are showing negative income (losses).I've added a line representing consolidated operating income which is the sum of all areas (including the negatives).
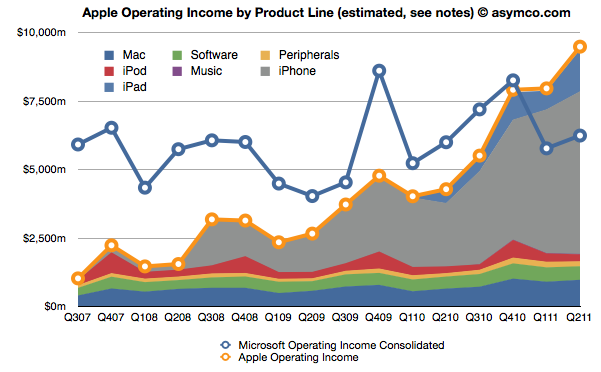
The same line from the chart above is super-imposed on the chart below and is comparable to the orange line that represents the operating income that Apple was able to obtain over the same time frame. Note that both axes are using the same scale.
The Blue and Orange lines are indisputable but the allocation of the areas under the orange line may be open to debate.
As Apple does not report a break-down of each product line or division, getting the areas in the Apple chart is a matter of analysis and estimation. The method I used was to estimate gross margins per product (the overall gross margin is known) and assigning a portion of OPEX (also known) in a ratio equal to the sales level of that product. [3][4]
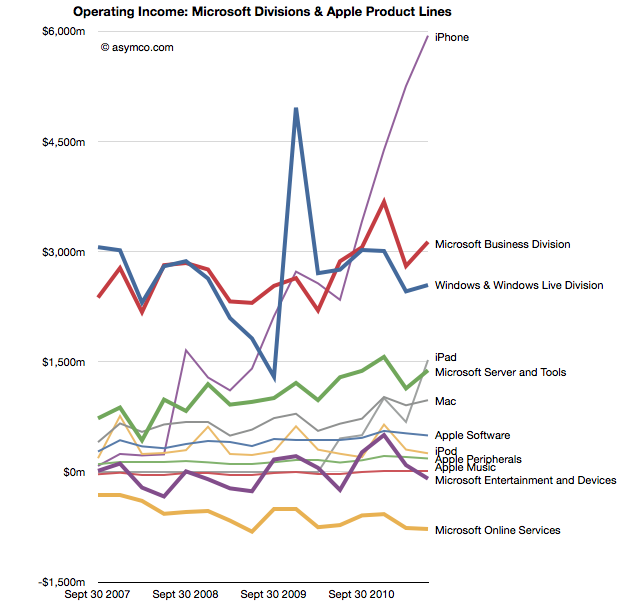
To make the contrast sharper (though more cluttered), I took all operating incomes from all product lines and divisions of both companies and laid them out as time series line charts in the following chart. I allocated Corporate Level Activity as an expense proportionate to each business unit in a ratio proportional to its sales. This allows comparison of product lines individually.
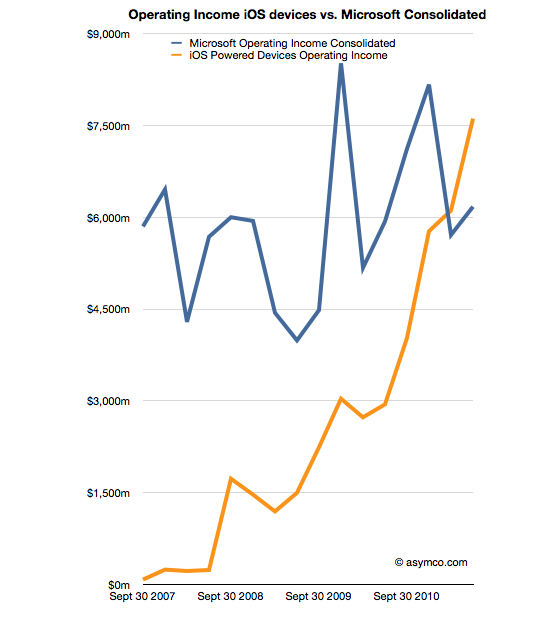
Finally, I combined all the iOS product lines (iPhone, iPad and iPod touch est.) as one line and laid it alongside overall Microsoft Operating Income (consolidated).
The second chart in this post showed that Apple has reached higher operational profitability than Microsoft by the end of last year. This fourth chart shows that iOS products combined are more profitable than Microsoft as a whole.
Microsoft invented the software business and built it to become the world's most valuable business by the year 2000. It's still been growing since and after 35 years it is reaching a profit of $27 billion per year. It did this while maintaining enormous margins and a highly disruptive monopoly business model the likes of which the world had never seen before.
It is scarcely believable then that a device business has been created to overtake it in four years.
On the other hand, one should not use Gross Margins alone. The crucial difference between Gross Margin (Sales Revenue - Cost of Goods Sold or COGS) and Operating Income is that fixed costs are also accounted for. These fixed costs are typically Selling, General and Administrative Expenses and Research and Development Expenses (commonly summarized as Operational Expenses or OPEX) which can be allocated to a particular business or division. For different business models, gross margins can be widely different. In the case of Microsoft for example, software has negligible direct variable costs. A CD or download is of tiny cost compared to the price of the license to use it. As a result software often has 80% gross margins. Hardware on the other hand can have very thin margins in single digits (e.g. PCs). Conversely, Microsoft will have very high fixed costs to pay for developers, product management and sales forces. A hardware vendor may have few engineers and sales could be handled through resellers. Thus Microsoft will have very high OPEX and a PC company will have very low OPEX.
So, for example, In Q2 '11 the iPad had an estimated gross margin of $2.06 billion (which assumed 34% margin on published revenues of $6.06bn). As it also was 21% of total revenues that quarter, I assigned 21% of OPEX to the iPad. That means 21% of $2.54bn or $540 million was the operational expense allocated to the iPad. This results in operational income estimate of $1.52bn for the iPad in Q2.
To summarize, the assumptions this estimate depends on are gross margin estimates and the allocation of OPEX in proportion to sales. Gross margin analysis has been a matter of iteration and peer review for some time and I'm fairly confident in my estimates. The allocation of OPEX is more arbitrary. Chances are that these expenses vary greatly with each quarter where more work is done nearer to launch of a new product and less in late season. If there are better methods available to allocate expenses by product, I'm open to suggestion.
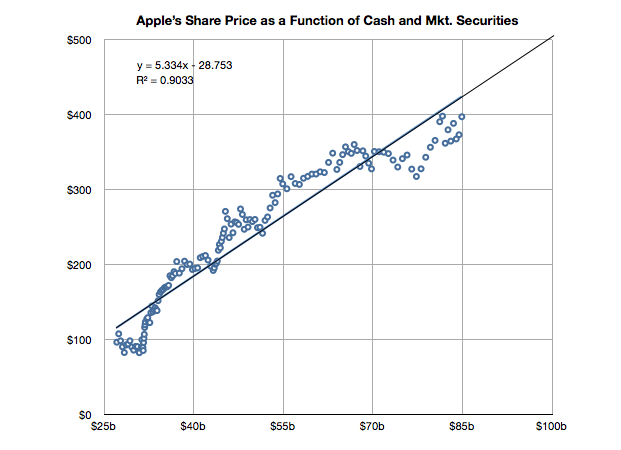
Apple's share price has recently hit a new all-time high, over $400 per share. As often happens there was no specific new information from the company to justify this increase. On the other hand there is usually no news to justify share price drops in Apple. In fact, the stock is up on what would be considered counter-indicative news: the resignation of a very important CEO.
But readers may recall that there is a measure of performance for Apple we can turn to that seems to show strong correlation to its stock price. It's not income and it's not growth in income but it's the strength of the balance sheet.
It's time to look at the data again to see if the relationship still holds. I added the data for Q2 and made some estimate about the cash position since July 25th (we will know this data with more accuracy when Q3 data is reported in a few weeks).
The slope of the line above has decreased slightly but a strong correlation can still be observed. The old r-squared was 0.94 and it is now 0.90. I included the formula for the y variable (share price) as a function of x (cash).
If you plug in $100 for x you get about $500 for y. So if this relationship continues[1], the answer to the question in the title would be "When the cash and cash equivalents reach $100 billion."
----
Note:
Note that whether the relationship holds (which it very well may not) depends on a strong correlation and "strong" is not well defined. The correlation has weakened slightly in the last six months.
The previous article showing the profile of Apple's growth vs. its P/E prompted a similar review of a set of comparable companies. The cohort is composed of:
Apple HP Dell Lenovo Acer Sony Samsung LG Nokia RIM HTC Microsoft Google
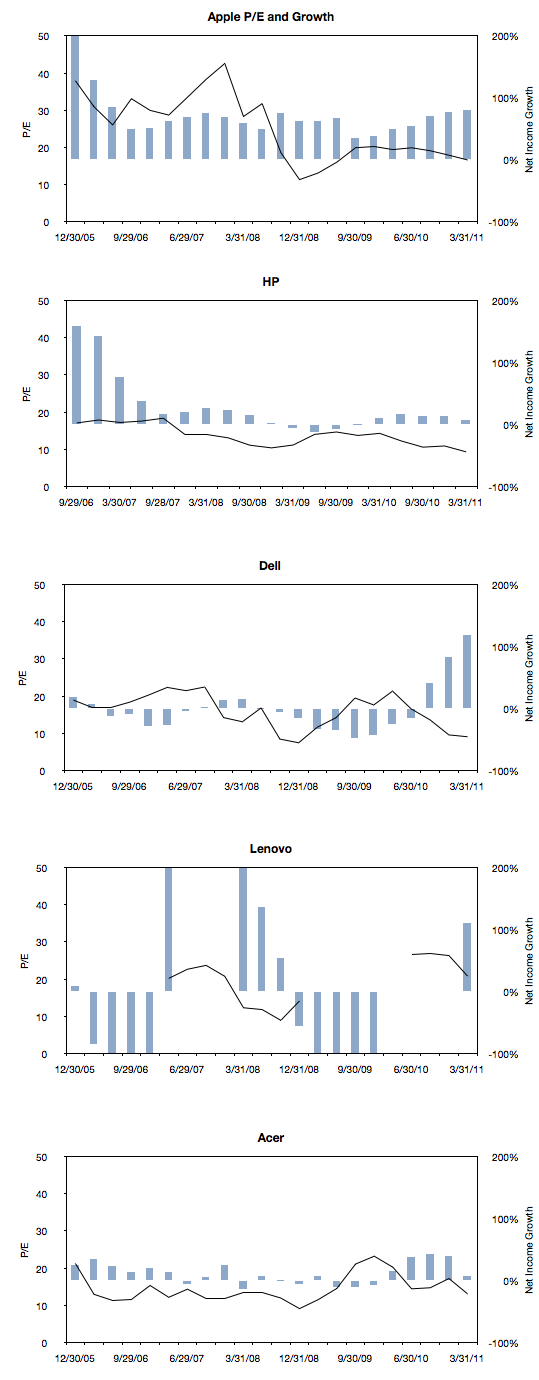
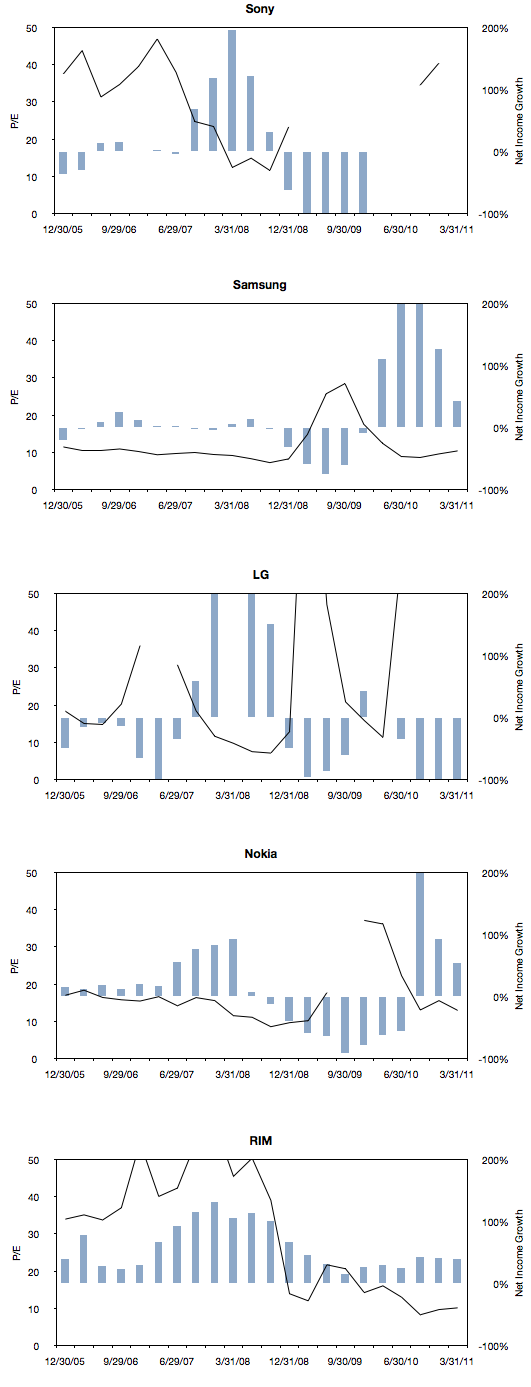
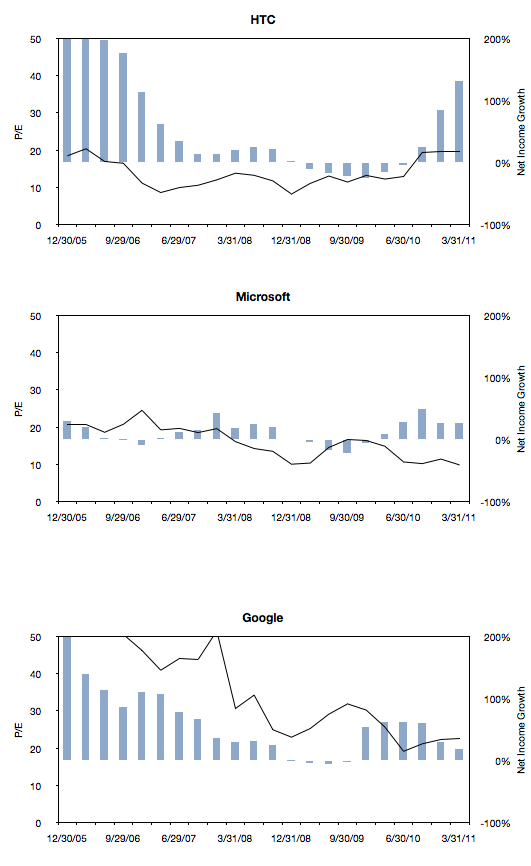
The following charts are a simple representation of P/E (line chart with left scale) with Net Income growth super-imposed (bar chart with right scale.) The time period is 22 quarters; 11 quarters after the crisis (i.e. quarters after the one ending in Sept. 2008) and 11 quarters before the crisis (quarter ending 12/20/05 through the one ending 6/30/08).
We made one change to the growth data from the previous post where the Net Income growth is not quarterly year-on-year but average of four quarters year-on-year. This reflects the fact that P/E is also a trailing twelve months' earnings. It also has the benefit of smoothing the growth data making it easier to discern.
Here are the charts:
Note that all charts are to the same scale (P/E from zero to 50 and Net Income growth from -100% to 200%). Some clipping of the values is possible. Growth from unprofitable periods are undefined (i.e. when measuring growth from a to b, if a is negative, the data is omitted.) Growth from a positive period to a negative period is defined as -100% (i.e. when measuring growth from a to b, if b is negative, the value is defined as -1).
There are some anomalies, for example growth due to an acquisition or loss of profitability due to re-organizations, however the patterns are probably what matter most.
Next post will discuss the relationship between P/E and growth in the pre- and post-crisis time windows for all these companies.
The reason we look at valuation is that it offers insight into how innovation is perceived. If a company is a successful innovator it usually creates vast wealth for its owners. However, the timing of that wealth creation depends greatly on its recognition by others. In other words, valuation lets you determine how recognizable innovation is. If your analysis tells you that a company is supremely innovative but nobody else recognizes this then you have an investable opportunity.
So with that in mind we like to compare industry and innovation analysis with what "the market" thinks about Apple.
The latest method we had in mind was to compare P/E (a measure of valuation) and Growth. We've shown before that they seem to be moving in different directions. That's not been news for over a year. What we will try to do now is to see if there is discernible change in the relationship before and after the financial crisis.
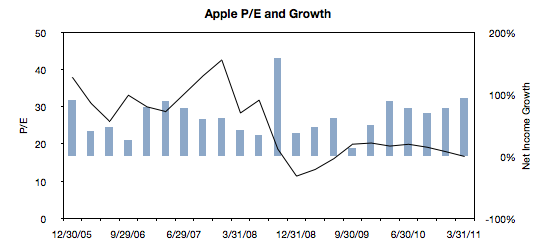
The following chart is a simple representation of P/E (line chart with left scale) with Net Income growth super-imposed (bar chart with right scale.) We chose a time period of 22 quarters. 11 quarters after the crisis (i.e. quarters after the one ending in Sept. 2008) and 11 quarters before the crisis (quarter ending 12/20/05 through the one ending 6/30/08).
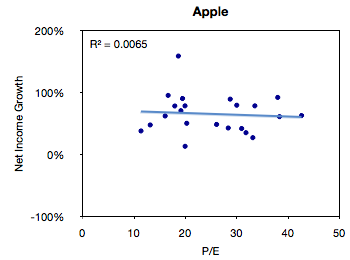
We then plotted a scatter of all these pairs (P/E vs. Net Income Growth).
The R-squared value simply shows that there is no correlation between these two variables, but this is not a surprise.
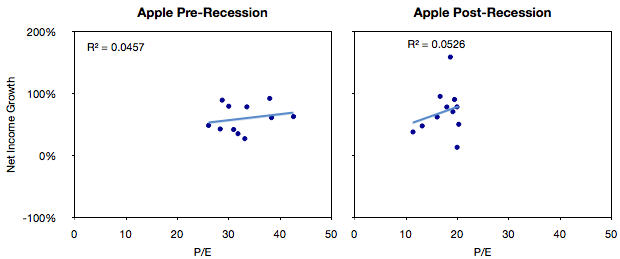
The next step would be to compare the pre-and post-crisis data sets. The idea being to see if, and to what degree, there was influence from conditions beyond the control of the company.
What seems to be happening is that the cluster of values did indeed move from the right (high P/E) to the left (low P/E) without much change in the growth.
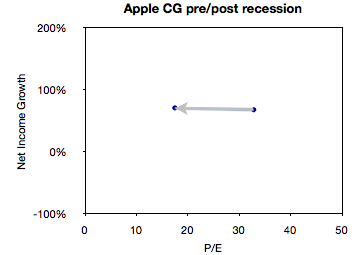
We can get an even better feel for this by measuring the "center of gravity" of the clusters and plotting how they shifted.
This chart illustrates succinctly the phenomenon of "P/E compression" where P/E drops while growth continues.
In the case of Apple, average growth actually increased slightly between the two sampling periods (from 68% to 71%) while the average P/E dropped from 32.8 to 17.5.
What will follow over the next few weeks will be pair-wise comparisons of Apple and comparable companies along these metrics of P/E and Growth.
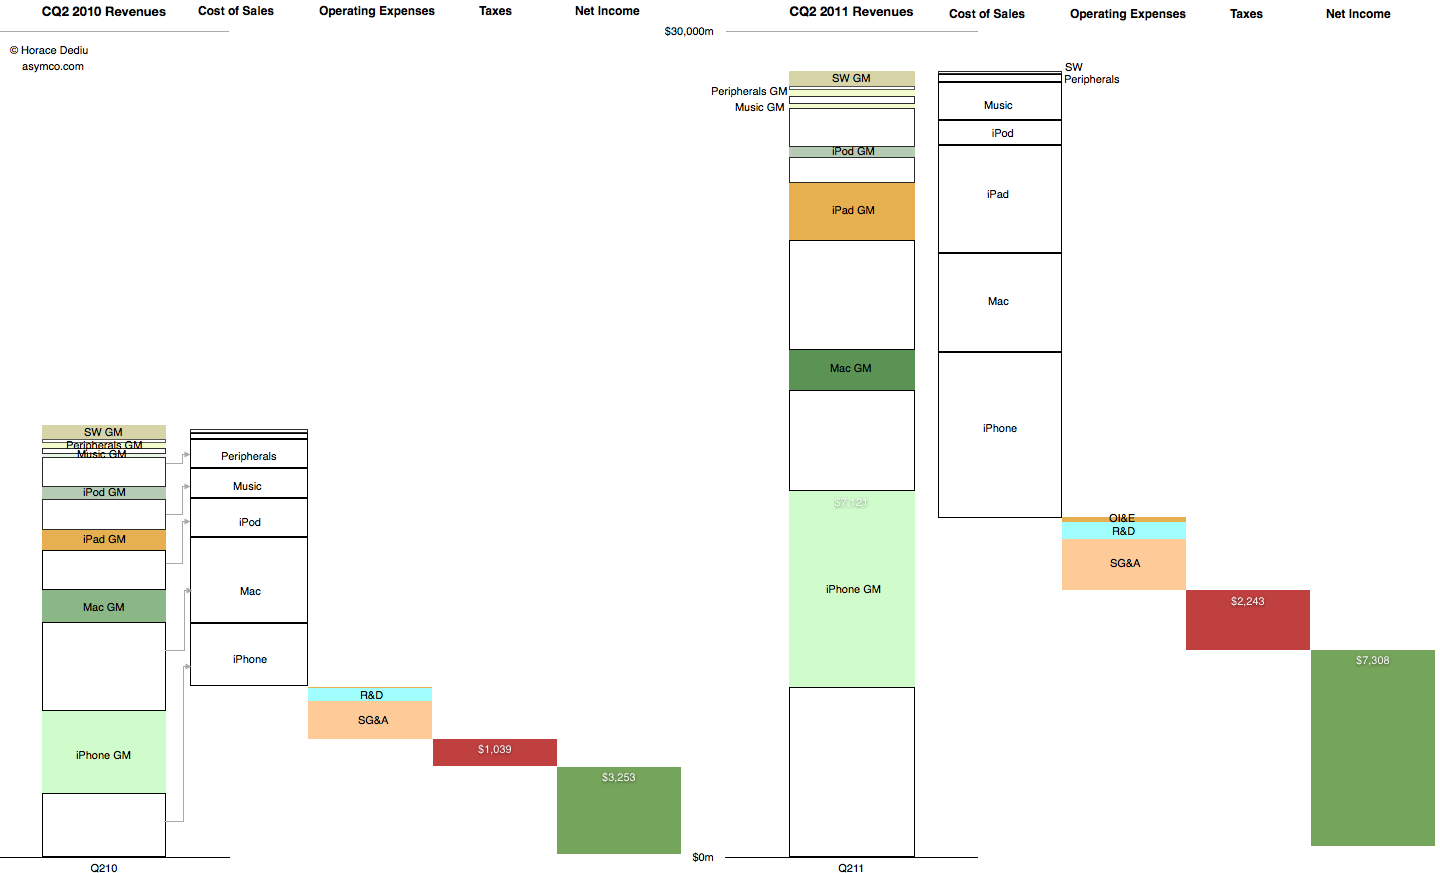
This graphic representation of the current and year-ago sources of income and sources of expense for the company shows how the business evolved in the last year.
The colored segments in the first column are Gross Margin contributions per product for Calendar Quarter 2, 2010. The white segments are cost of sales for those products. These costs are combined in the second column and the operating expenses are shown in the third column, taxes in the fourth and Net Income is shown in the fifth.
The same information is shown for Calendar Quarter 2, 2011. Click for larger view (1440 x 873 pixels)
The increase in the first columns is the "top line" growth and the increase in the last (fifth) columns is the "bottom line" growth
Similar charts for the last few quarters are shown here: