Asymco

Asymmetric Intelligence

Nokia

  1. What's the opposite of price erosion?

    Research · 44 comments

    In the mobile phone industry, and indeed, in most technology sectors, price decline is a fact of life. Component prices tend to drop while their performance increases. This rapid obsolescence drives prices down constantly. Competition also plays a part as undifferentiated products are rapidly imitated.

    This phenomenon has its own term: price erosion. It's built into most business plans and forecasts.

    But how real is it? What are the implications in terms of market share if one accelerates price erosion or reverses it?

    This chart shows the average selling price for all the vendors whose data I maintain over a period of time.
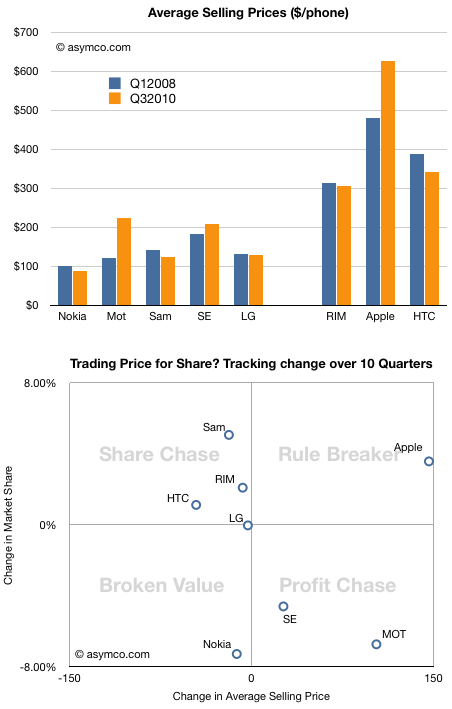
    Normally, a drop in price is followed by an increase in share, and an increase in price by a drop in share. To test this hypothesis, I tacked on another chart that shows how share and price have been traded off in the market over the last ten quarters.

    Note how prices have dropped for all but three vendors. Two of those vendors (Motorola and Sony Ericsson) have lost share. One, Apple, has gained share. The rest, whose prices did drop, had increases in share, very roughly in proportion to the price drops. Again, we have one exception, Nokia, which suffered both price and share loss.

    Except for these two anomalies, the vendors are placed on the -45 degree diagonal that would show expected price elasticity in the market.

    I took the liberty of breaking the chart into four quadrants, and gave them names suggesting the strategies of the companies.

    Lying along the traditional trade-off axis are either Profit chasing or Share chasing strategies. Anomalies off the axis are either Rule Breakers or Broken Value propositions.

    This view of the companies allows us to abstract and think about market evolution.

    It would be interesting to think how these players will evolve over time.

    It's quite possible that LG will move into the profit chasing model (as they already indicated they would by building more smartphones). These strategies are typical of companies squeezed from the bottom and the top. I once called this group "the biggest losers" and suggested that they are the best target for Android.

    It's also possible that Nokia will move into the same quadrant, though their profit algorithm favors share above all else.

    The biggest question is whether Apple's rule breaking is sustainable. It's not clear whether they are interested in share as that does not have all that much to do with their definition of "greatness". But a platform strategy begs for volumes.

    This remains the biggest puzzle facing observers of this market.
  2. Nokia's moderate-intelligence-phone performance

    Research · 60 comments

    A complete market overview will follow when all the top tier vendors report the last quarter, but in the mean-time here are some data that are available:

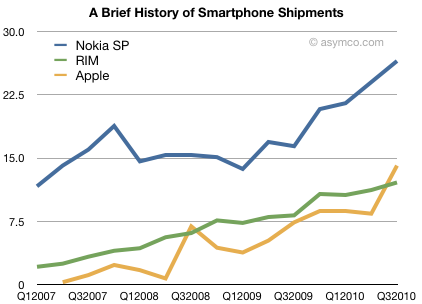
    Smartphone volumes for Nokia, Apple and RIM:

    Whereas Nokia is often criticized for being weak in smartphones, the fact is that they have grown at a decent rate over the last two years. In fact, they've opened a gap with RIM. Apple has increased share but it will take quite a while to overtake Nokia.

    So why is Nokia's smartphone performance so under-valued? Partly it's because ASPs have been dropping. A lower price and lower margin is sometimes seen as a sign of weakness. But Nokia has had a strategy of expanding into more price brackets in their core markets (i.e. outside the US). Half of Nokia's smarpthones are sold through distributors not operators and probably end up being sold unlocked and unsubsidized. Price matters in those markets.

    The other problem that Nokia takes a beating over is that their products don't get used as smartphones. Many are sold without data plans at all which makes one wonder what exactly makes their phones "smart". So many of these 100+ million/yr.  smartphones are really hired to do a feature phone job. They're "overqualified" and thus underutilized. The statistics in terms of app downloads, browser and ad impressions all lag as a result. The ecosystem suffers.

    Lastly, they are all but absent from the US. Due to accidents of history (CDMA) and various mistakes, Nokia never got a foothold in what turned out to be the most important mindshare market. A decade ago the US was a mobile data backwater, with lower data ARPU than Nigeria. It was not a market Nokia felt particularly deserving of investment. In hindsight, this was a big mistake.

    But these knocks against Nokia still should not detract from the fact that they do sell a lot of Symbian phones. Distribution still matters as does having 600 operator customers. And in many parts of the world, Nokia is synonymous with mobile phone. Many of those buyers will migrate to future Symbian devices.

    My mobile platform thesis has been that as long as penetration is not 80% and as long as operators are still in the value chain, mobile platforms will remain fragmented and split shares. The graph above shows exactly how that has evolved among the top three smartphone vendors.

  3. Which size really matters? Market Share vs Profit Share

    Research · 27 comments

    One of the most hotly debated subjects in the mobile phone business is the importance of market share. It's also a topic of lore in the PC industry. Briefly the two arguments are:

    • Market share matters more because it drives network effects which ultimately drive competition out of the market, creating the opportunity for monopoly rents.
    • Profit share matters more because profit is the only fuel that can drive innovation. Any macro downturn or shift in strategy can cause a company to cease investing in unprofitable projects.

    The old disruptor's adage: "Be hungry for profits and patient for growth" is challenged by the equally disruptive: "Grow share with lower prices in exchange for new revenue sources."

    There are many rich anecdotes to support each strategy, but how about some data? Fortunately we have some: the market and profit shares for vendors covering 80% of the world's largest technology market over a three year period. The vendors are a good proxy for the market, the time frame is long enough to cover seasonality and anomalies and the market is very big (over 1.2 billion devices) and very broad (world-wide).

    The only question is how to measure success. One measure is how various strategies benefit the asset owners, i.e. the share holders. Benefit to society, employees and consumers are very difficult to measure. But share holder benefit is easily obtained by measuring change in share prices.

    So, here are two charts:

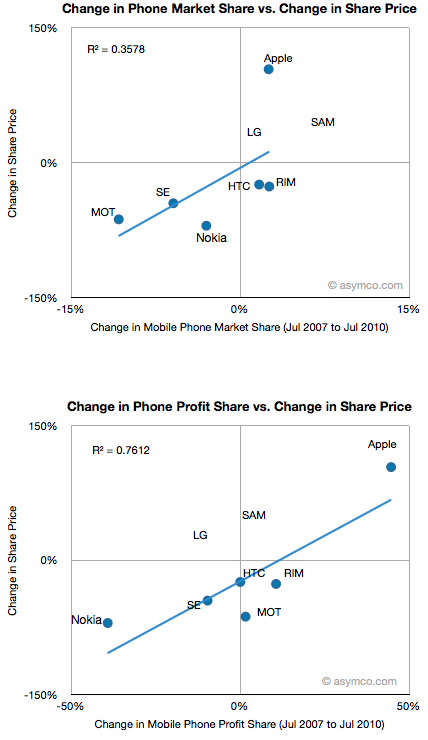
    1. The percent change in market share vs. percent change in share price for the top mobile phone vendors.
    2. The percent change in profit share vs. percent change in share price for the same vendors. (see note 1 for time frame discussion).

    I showed the R-squared value of the correlations. (See note 2 regarding LG and Samsung). At r-squared of 0.36 share price is not well correlated to market share while at 0.76 it is rather well correlated to profit share. To a financial analyst this would seem obvious. After all, share price reflects the present value of future cash flows which are clearly coupled to profit and hence to profit share growth. However, as many technology observers would point out, market share determined the success of Microsoft and Google, and to some degree Nokia.

    High market share can cause competitors to be starved of components or ecosystem developers. At the same time, high profit share can cause competitors to be starved of capital.

    What does this analysis add to the argument? Note that this data covers a hardware business. Is hardware relevant? It does not scale as rapidly and has a short shelf life. It's also notoriously difficult to distribute. However, outside of the service revenues for cellular voice and data, device hardware is the only pool of money that has any material dimension in the industry. It's also the pool of money with the highest margin in the industry. For the time being and the foreseeable future, hardware is the only business model worth anything in mobile computing.

    The data shows that in this particular but substantial market profit share is closely correlated to shareholder value creation. It also shows that profit loss is closely correlated with shareholder destruction. The dominant data comes from Apple and Nokia, which appear to be polar opposites in performance on both measures.

    In other articles I've shown how profits have shifted from incumbents to entrants in the smartphone disruption. This shift has resulted in direct benefit and loss to the owners of the two asset classes. To suggest that market share alone is a determinant of "success" in the device market must exclude the effect on shareholders and, ultimately, the management and employees of the companies concerned. The virtuous/vicious cycles will be fed by the profit variable more than any other.

    I don't think the market share argument holds water in this market and this data supports my belief. It may be that as value shifts over time away from hardware the benefit will shift as well, but business models alternatives to hardware have not emerged after ten years of experimentation. If anything, the idea of selling hardware as a way of capturing service revenue was pioneered by RIM and perfected by Apple. Nothing I've seen so far is challenging this model. Whoever attempts to siphon the device pool of money (which has remained fairly constant over the smartphone disruption) needs to solve system-wide problems like the dependence on the network and the life-cycle of portable electronics.

    ----

    Notes:

    1. The dates when performance was sampled are are July 1 2007 to July 1 2010. The latest quarter (3Q10) has not been included in this data as it has not been fully reported. The data will be updated with the latest quarter as soon as it's possible.
    2. For many competitors the share price is dependent on more than performance in the mobile phone market. In particular, LG, Samsung, Motorola and Apple have diversified product lines which affect their share prices. Two of those companies (LG and Samsung) are conglomerates and their share performance is dominated by businesses other than mobile so I did not include their data in the correlation measure (though their place on the chart is shown). Motorola and Apple's stock prices were, to a very large extent, driven by their mobile phone performance over the same period so their data is included in the correlation analysis. The other vendors have been primarily focused on mobile phones.
  4. The symmetry of share shifts in mobile phones

    Research · 49 comments

    Thanks to a reader's suggestion, I took another look at the profit and market share data from the mobile phone market overview posted last quarter. This time to compare the vendors on two dimensions at the same time.

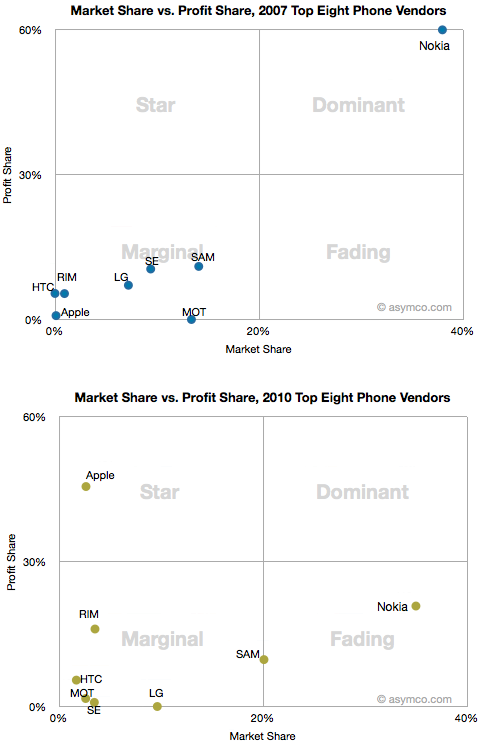
    I plotted the vendors on share of market and share of profit axes in two different points in time: Q2 2007 and Q2 2010. I further broke the chart into four quadrants as shown:

    I chose to label the quadrants to indicate the possible categorization of the companies.

    • Dominant: large market share and large profit share
    • Star: low market share with large profit share
    • Fading: high market share with low profit
    • Marginal: low market share and low profit

    It's interesting to note the shift over the time period of the eight vendors. Whereas Nokia moved from Dominant to Fading, only Apple rose from Marginal to Star. The Marginal players dispersed their placement with Samsung moving laterally toward Nokia while RIM followed in the Apple trajectory and increased profit share while maintaining relatively low share.

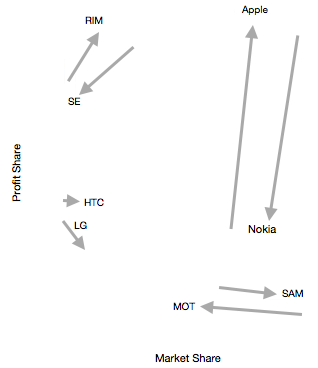
    Thinking about motion around these two dimensions could be reduced to a vector model. If each vendor is represented by an arrow showing direction and distance moved, we can compare each vendor vs. a symmetric competitor which might account for the loss or gain of share.

    The vectors can be paired as follows:

    Although the data does not contain all market participants, the shifts in share are quite closely conserved with the vector magnitude (arrow length) and angle (direction) paired. Note how Nokia and Apple swapped Profit without too much impact in Units volume. Similarly, RIM and Sony Ericsson traded profits and volumes quite symmetrically. Samsung also took volume while Motorola lost it. HTC and LG did not change positions dramatically.

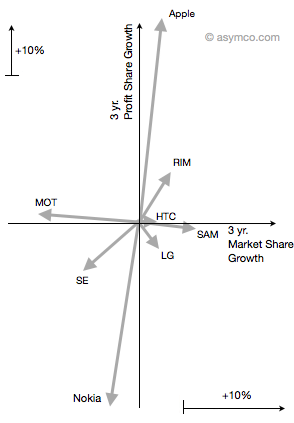
    Finally, moving all vectors to the same origin leads to this view of share gain/loss over three years in two dimensions:

    It becomes quite easy to see who the winners and losers are and by how much.

    This model is only an observation of the shifts in market power and is not conclusive about where share was gained or lost, however there is compelling symmetry which also matches the intuition of  observers.

  5. iOS users are ten times more likely to download apps than Symbian users

    Research · 13 comments

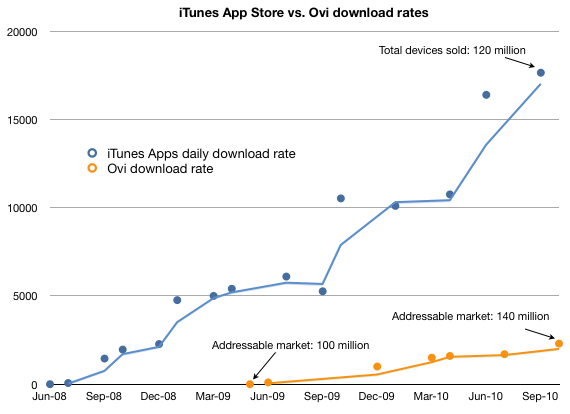
    With the number of active Nokia service users now reaching 140 million worldwide, the company today announced that more than 200,000 people are currently signing up daily to Ovi, and that Ovi Store has reached the milestone of 2.3 million downloads per day. Available in more than 190 countries,

    via Nokia Ovi Services Continue to Grow.

    Nokia updated its tally of download rates so we can put the numbers side-by-side with Apple's iTunes.

    The slope of the Ovi curve does not yet compel one to get excited over the platform's prospects in the near term. However to get a true picture, one needs to not only look at absolute download numbers but also the probability of any one user or device being used to download an app.

    For this we need to note how the number of devices relates to the download rate. Apple announced recently that they sold 120 million devices running iOS. Not all those devices are still in use.  If we remove 20 million from that total we get approximately 100 million iOS devices. Nokia, on the other hand, specified exactly how many devices can access the Ovi store: 140 million.

    Therefore 100 million iOS devices download at a rate of 17.7 million per day while 140 million Symbian devices download at the rate of 2.3 million per day.

    That puts the weekly download rate per device at 1.24 for iOS users vs. 0.12 apps (or whatever is the appropriate content item for Ovi) every week for Symbian users.

    As the table below details, the rate of downloads per device for iOS is more than 10x higher. This is the more interesting number if you are a developer.

    If someone can point me to Android Market download rate (historic and/or current) I can add it to the mix.

  6. NYT blames yet another culprit: Nokia’s Culture of Complacency

    Research · 11 comments

    “I am sure there are things we could have done better and innovations we missed,” Ms. Suominen added. “But that happens to all companies. We have been very successful with some other innovations.”

    She cited Nokia’s large patent portfolio and its 770 Internet Tablet, a compact, flat-screen device without a phone, released in 2005. It worked with a pen stylus and was made for Internet browsing but is no longer sold.

    via Nokia’s New Chief Faces a Culture of Complacency - NYTimes.com.

    If I may suggest a better list of innovations for Nokia to stand behind:

    1. The first GSM call in 1991 was made on a Nokia phone and a Nokia network
    2. The first mass-market smartphone, the Communicator in 1998
    3. First compact smartphone, the 7650 in 2002.

    While these innovations and "firsts" happened many years ago, Nokia's ability to innovate is just as important at the low end. Nokia was the first company to address the lowest tiers of the market with over a billion customers served. This was no small feat and many observers faulted the strategy when it began in the middle of the decade.

    I would not discount the difficulty and determination required in reaching those customers. Engineering a profitable low end product is as hard if not harder than engineering a high end superphone. More importantly, you have to find a way to distribute to these hard-to-reach customers and find ways to make the product useful, usable and affordable. Were it not for these efforts, the company would be facing collapse today, similar to the fate of Motorola or Ericsson: squeezed in the mid-range.

    Blaming "culture" is nothing more than suggesting bad management. The culture of Nokia did not change between the few years when it was successful and the years when it was not.

    The challenge Nokia faces is not complacency. It's that the business model for selling voice-oriented phones is diametrically opposed to the business model for selling data-oriented phones. In one case you cooperate with and sustain operators, in the other you compete with and disrupt them.  It looks damn near impossible to do both with the same organization. Everything must be done differently. The real problem is that Nokia has not realized this and therefore can't build its own replacement.

  7. Will Nokia build Windows phones?

    Research · 11 comments

    Will Nokia build Windows phones? | VentureBeat.

    The chances are extremely small. There are three scenarios where this would make sense:

    1. If there was a specific market that required it. It would also need to be a large opportunity since developing a new platform and diluting existing platforms need significant upside. The only such market is the US, but there are better options available, namely Android that have better potential and Android is treated as a toxin by Nokia (see metaphor).
    2. Specific users. Windows Mobile used to be justified for business users, but Windows Phone is not targeting business users.
    3. The last option would be "strategic" i.e. Microsoft paying Nokia for using the OS (directly or indirectly through marketing co-spend or other symbolisms). I don't think Nokia is desperate enough yet.

    Although it's never prudent to say never, I just don't see any logic for Nokia to add to its bill of materials for phones while facing price pressure.

  8. Nokia's UK managing director resigns

    Research · 14 comments

    Nokia's Uk managing director Mark Loughran reckons that the Nokia N97 will prove superior to the iPhone due to its significantly better camera sensor, lower tariffs and its radical change in styling and especially form factor from the company's ex-flagship the Nokia N96.

    Loughran said: "The new iPhone is an evolution rather than a revolution and for people trying to decide whether to get a Nokia N97 or an iPhone, it comes down to a decision on performance and value for money."

    Loughran added: "the new iPhone seems to have the same design and colour, upgrading froma sub-standard two-megapixel camera to a still low 3.2 megapixel camera, and is probably a disappointment."

    Nokia General Manager Believes N97 Will Beat The iPhone

    Good times...

  9. Can Android change the distribution of profit among phone vendors?

    Research · 99 comments

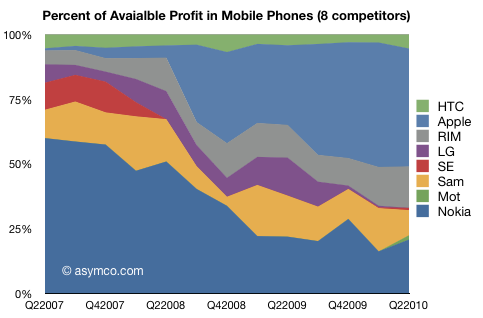
    A quick update on the analysis of mobile phone profits. If the available profit[1] (i.e. excluding losses) were summed and each vendor's profit were measured as a percent of this total, this chart would tell the story of the last three years:

    Note that profit share has mostly shifted from Nokia to Apple, though Sony Ericsson and LG were also casualties and Motorola has not had anything to lose.

    Some assume that the future belongs to the Koreans but we see that the relatively small amount of profit that Samsung has (less than RIM actually) has not changed much. HTC is also shown to be a steady performer but not having displaced much from competitors.

    Will Android change this picture? As I've argued before, Android is most attractive to the unprofitable and the strategically constrained. Can having undifferentiated new products change this? As Nokia is unlikely to license Android, and RIM seems very unlikely and Apple is out of the picture, the only possible contenders are Samsung, LG, HTC, Motorola and Sony Ericsson.

    Motorola and Sony Ericsson have both returned to profitability but with a very small volume Android strategy. However the incumbents fielding Android are really facing a far more sinister threat: the smaller local brands in China (e.g. ZTE) and emerging markets.

    On profitability, the smaller challengers are unlikely to make a large impact, but they will constrain the profits of other licensees. The distribution of phones on a global scale is challenging without a brand, and brands are very expensive to build. It's still possible over a longer timer frame that a small brand like HTC can emerge on a global stage. But in terms of profit capture, challengers will mostly "steal" from the already constrained big brands running with Android.

    --

    [1] Profit is not the only measure of success and can sometimes be a deceptive indicator. For this reason I look at a longer time frame so that anomalies, seasonality and business cycles are smoothed over. As flawed as it is as a measure, the most important reason to pay attention to profit is that it's the only fuel for growth in the long term. Companies that are consistently unprofitable (e.g. Motorola) face diminishing degrees of strategic freedom further lubricating a downward slope toward financial distress.

  10. BusinessWeek: Nokia failed because it's in Finland

    Research · 12 comments

    How Nokia Fell from Grace - BusinessWeek.

    The author asserts that company success and failure are determined by the location of its headquarters. He also adds a bit of stupid manager theory to flesh out his thesis for Nokia's failure.

    I've already debunked the stupid manager theory here. So let's look at what's left.

    The bad geography thesis is a far less common theory than the stupid manager theory but maybe it's worth analyzing.

    Here are the basic questions anyone can ask:

    1. When did Finland become a bad location, exactly? It was clearly a good location for Nokia when it was winning and growing. It seems to have become a bad location for Nokia around the same time its business began to slow down. That puts Finland at a geographic disadvantage around 2005 or so. As far as anyone can tell nothing changed with the population or intellectual capital of the country around then (if anything all the surveys seem to show it's gotten better). So whereas Nokia was successful in Finland and unsuccessful in Finland and Finland did not change, Finland cannot be causal to the failure.
    2. If Finland had something to do with it, did companies in Finland succeed at the same time as Nokia and fail at the same time? I don't have any evidence to confirm or deny this but I will say that the iPhone's most popular application is written in Finland (Angry Birds by Rovio). So there are still creative and clever people around.
    3. If location in "hub" locations like Detroit for automobiles or New York for finance, ensures success... oh, never mind.
    4. Since Sony was successful in Japan in the 70's and 80's then should they also have moved in the last decade when their business turned? Is Japan also an isolated place for innovation?
    5. What about Microsoft? Seattle was the technology boonies when Microsoft moved there.
    6. Finally, when Hewlett and Packard started in the agricultural plains south of San Francisco, I'm sure the residents of electronics hubs of New Jersey and upstate New York pointed and laughed.

    The hypothesis that location matters in success or failure of business models is so easy to disprove that it's hardly sporting.

  11. What Apple and Android owe to Symbian and RIM

    Research · 6 comments

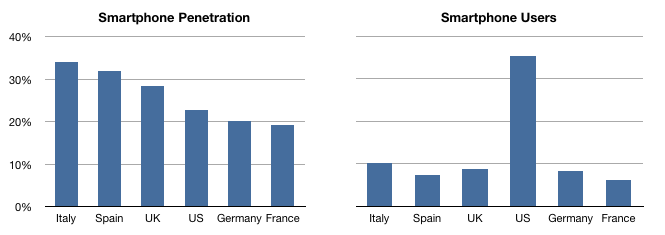
    Following up on survey data showing that up to 25 percent of Americans have moved to smartphones, here is another survey (Comscore) which shows that US smartphone users are at about 23 percent.

    Comscore also surveyed European countries, and we can compare the popularity of smartphones vs. the US.

    I also indexed the share to population to show the relative populations of smartphone users across these countries.

    It may come as a surprise to some that smartphones are more popular in the UK, Spain and Italy than in the US. Considering that these are countries with lower levels of disposable income, and that in Italy and Spain pre-paid plans are overwhelmingly more popular. Buyers in those countries are much more likely to pay full, unsubsidized prices plus 20% or more VAT. Overall the price differential for an Italian buying a smartphone vs. an American is likely to be a factor of 5. It gets even more peculiar when you consider that many Italians have more than one phone, with overall phone line penetration above 100%.

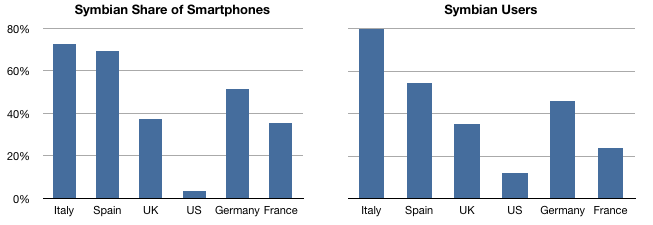
    The explanation for this remarkable appetite for smartphone goodness is the early lead that Symbian had in Europe. Buyers who entered the phone market ten years ago became accustomed to upgrading their Nokia phones. Symbian phones were aspirationally positioned as feature-rich camera and messaging devices. Many were also purchased without data plans and were thus used as high-end feature phones. In other words, consumers in those countries were comfortable paying full price for unlocked Nokia devices and using them with multiple SIM cards.

    This can be seen in the share of Symbian in these charts:

    The data points to how normative behavior evolved and how different that can be even among culturally aligned Western nations. When looking at Asia and South America, it gets even more interesting.

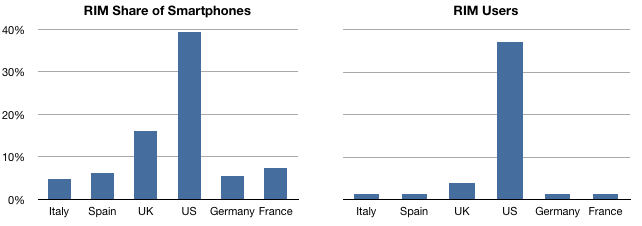
    Whereas in Europe it was Symbian, in the US RIM got the ball rolling.

    The contribution of these platforms in shaping expectations, not to mention pricing, for the iPhone and Android should be noted.