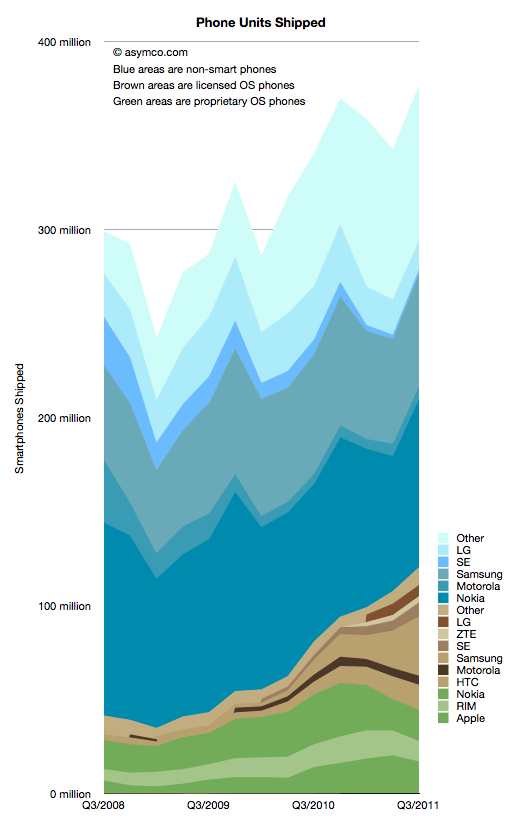
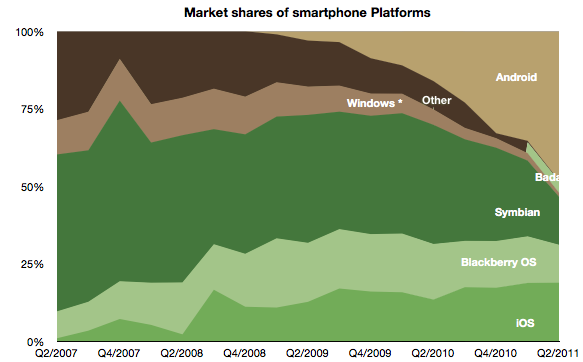
I collected all the data available so far and created a new graph that illustrates the complete market evolution over a three year period.
I chose a particular color scheme where shades of blue represent non-smart devices (think blue ocean), shades of brown are smartphones with licensed operating systems (Android for the time frame above) and shades of green as proprietary operating system smartphones. Multiple vendors are shown and those which sell both smart- and non-smart phones are shown twice. Note that the legend shows the vendors in the same order as the stacked areas.
There are several observations that are easy to make from this type of view:
The smartphone market is growing rapidly, not surprisingly. However, the overall market is also growing. Smartphones as a percent of total units sold is at around 31%, up from 14% in Q3 2008. Smartphone units however have tripled in the same time frame (from 40 million to about 120 million). This means that almost all of the market's growth has been smartphones with non-smart units barely increasing from 258 million to 272 million over a three year span.
Non-smart phones are far more seasonal than smartphones. As smartphones increase in share, seasonality should match that of the other phone types.
The number of branded smartphone vendors has increased significantly with "others" becoming a small part of the total. In contrast, the opposite effect is taking place in the non-smart market. Non-smart phone shipments have concentrated in two main brands and a large set of "others". This bi-polar industry structure points to where the value is migrating and hence where rivalry is increasing. We can use these shifts as indicators of industry maturity.
The opportunity for smartphone growth remains in the 70% un-penetrated blue area. However there is evidence that smartphone "switchers" are increasing with a noticeable decline in Nokia/Symbian and RIM. Apple's decline in Q3 is likely to be reversed in Q4 but Apple's share of all phones remains under 5%-- a five-fold increase in share from 2008 but a sign of how much is left to be done.
As Nokia shifts its Symbian portfolio to a licensed Windows Phone model the licensed cohort will tip over into an "all but two are licensees" line-up. This should be particularly worrisome as value is shifting to software and services and "super-platforms". But before the disruption is complete, there are still some cards to play. Samsung and Nokia have vast non-smart volumes to convert and it's unclear if they will do it with Android and Windows vs. layering their own proprietary Bada and future Nokia Linux platforms.
In the next few weeks I'll publish details of all the measures of the market but this first "landscape" view gives a good initial perspective. In the mean-time the data is accessible from the Asymco "cloud" here.
In his recent posts Horace took a look at Apple’s fixed assets and their development over the recent years. He also tested the hypotheses that Apple is making investments into machinery & equipment on which iOS devices are produced by overlaying iOS volumes with preceding changes in property, plant and equipment (PP&E).
The question that has arisen is: Are Apple’s investments in PP&E extraordinary?
To answer, I have compiled the capital expenditures (CapEx) for our previously established peer group [1].
But first we need to clarify what CapEx include and not include. CapEx includes investment into property, plants, equipment, office furniture, larger IT hardware and in some cases patents; CapEx do not include investment into long-term marketable securities or other long-term financial instruments, acquisitions or capitalized R&D. Furthermore, CapEx are gross values and are not net of any sold equipment [2]. CapEx are largely depending on a company’s business model and strategy. For example if you are a manufacturer you need equipment to operate, if you are a software company or a retailer, your business will not be capital intensive.
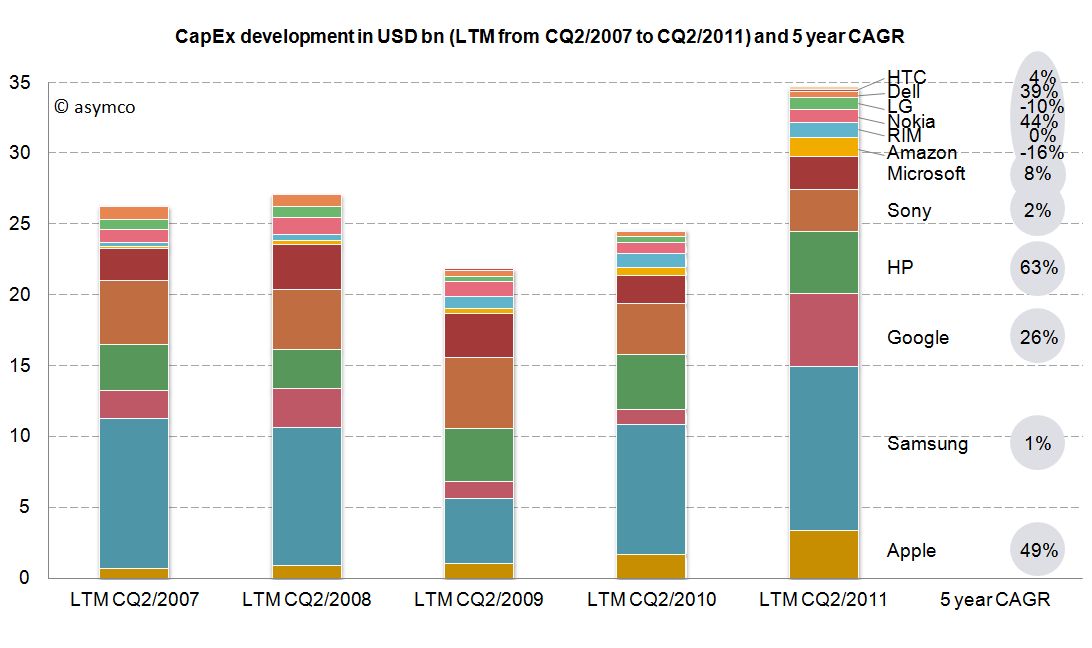
As the second calendar quarter of 2011 is the latest quarter for which all companies have reported figures, we will take a look at last twelve months’ (LTM) figures from Q2/2011 backwards. The following stacked bar chart shows the combined CapEx of our peer group:
The combined capital expenditures of our peer group for the LTM CQ2/2011 have outpaced even pre-crisis levels of investments and, combined, account for $34.7 billion. Samsung, a diversified manufacturer of IT hardware and other equipment, has invested more than $11.6bn with Google ($5.1bn), HP ($4.4bn) and Apple with $3.4bn following in line. While Google’s CapEx mostly account for its infrastructure of server farms and other IT hardware, HP’s CapEx mostly account for IT hardware it leases to its customers [3]. In absolute terms, Apple takes fourth place in CapEx spending for the last twelve months ending in CQ2.
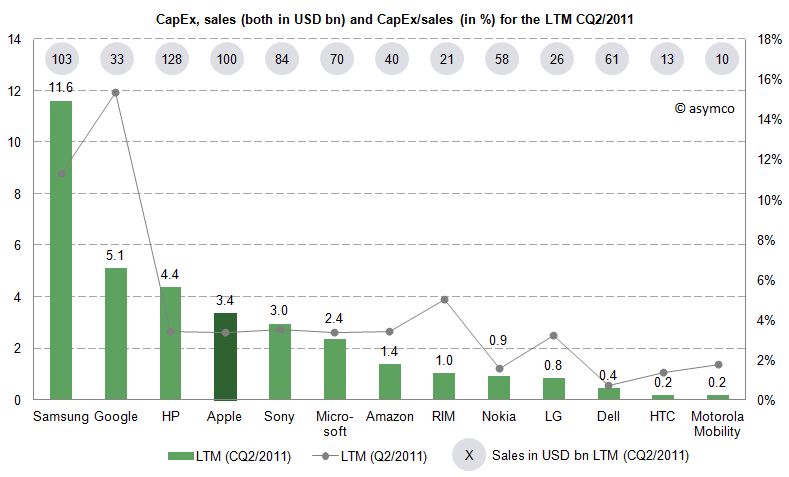
Since the business model and sales magnitude varies largely in our peer group, we can also take a look at a common measure to compare CapEx intensity by dividing CapEx by sales achieved in the same period. For the last twelve months we can depict the following chart:
The average of the peer group accounts for 4.4% of CapEx over sales. Samsung’s and Google’s business model are clearly more capital intensive, while Apple’s CapEx ratio of 3.4% is below the peer group average but above some of its peers like Nokia, Dell, LG, HTC or Motorola Mobility. Interestingly, capital intensity of HP, Apple, Sony, Microsoft and Amazon is at a comparable level of around 3.4%.
As noted before, business models and strategies are significantly different among companies in our peer group. However, while Apple’s CapEx intensity is not extraordinary, Apple’s CapEx in absolute terms are among the largest in it this peer group and have grown constantly throughout a five year period.
Is this a good thing and why does it matter?
CapEx by itself does not tell us much. We still do not know in what companies specifically invest as financial regulations do not require detailed CapEx accounts. We know that even if a company is not growing assets they need to be maintained, upgraded and replaced – this spending is also called "Maintenance CapEx". Everything else can be called "Expansion CapEx" associated with new product launches, entry to new business area or geographies or expansion of (manufacturing) capacity.
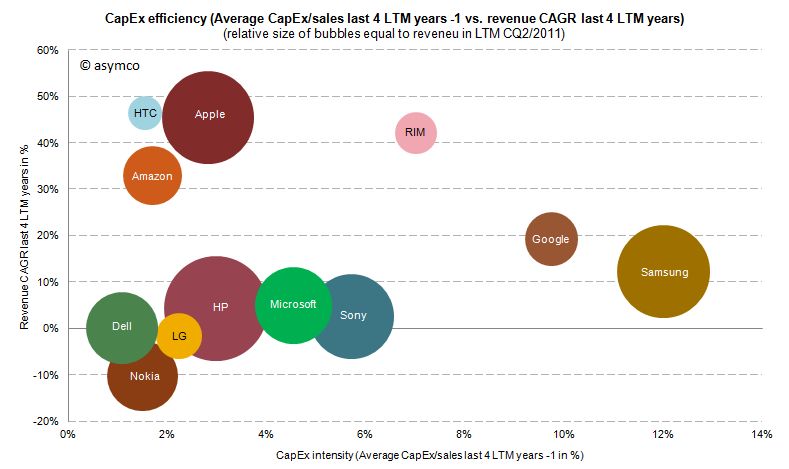
Therefore, Expansion CapEx is closely linked to expected organic sales growth in the future. So let’s go ahead and link CapEx ratio of the previous years with the sales growth of the following year. The following chart shows the cumulative average growth rate (CAGR) over the last four years versus the average of CapEx/sales ratio of the four last preceding years:
We can see that high CapEx efficiency has been achieved by Amazon, Apple and HTC with sales growth rates of 33-47%. RIM reached similar revenue growth but with higher CapEx intensity. Google and Samsung with high CapEx intensity have only reached modest growth rates. Dell, HP, Microsoft and Sony have not grown significantly but have close to average CapEx intensity.
We cannot state that CapEx in absolute terms have been extraordinary for Apple, but we can witness that with below average CapEx/sales ratio Apple outgrew in absolute terms Dell, LG, Microsoft, Nokia and Sony and has grown close to the revenue size of Samsung and HP in the last four years.
---
Notes:
Excluding Lenovo (not reported) and Acer (extra-ordinary low numbers reported, to be investigated), Motorola Mobility figures only available for the last six quarters
Minor differences may occur due to local Generally Accepted Accounting Principles (GAAP)
HP assumes ownership of these assets and rents them to the customers who in turn have a smaller balance sheet and can run IT hardware CapEx through the income statement as lease expenses
In the last two posts (How much does an Apple store cost?, The down payment on iCloud) I discussed two line items in the PP&E asset class on Apple's Balance Sheet. In isolation, the data is interesting as it gives us an idea of the cost structure of stores and facilities being developed to sustain its current business model. In aggregate, it provides insight into Apple's strategic intent.
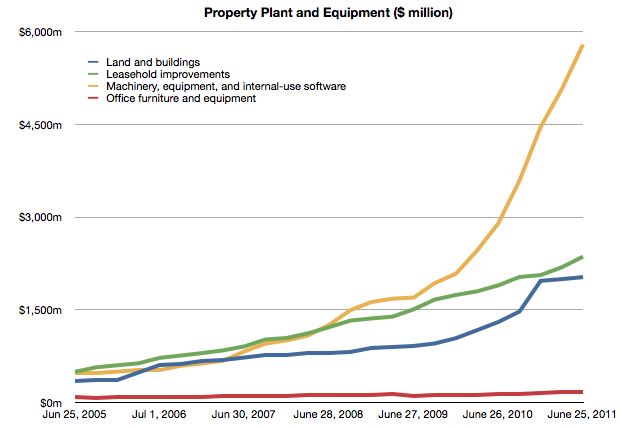
To complete the picture, I will look at the third asset: "Machinery, equipment and internal use software." It's the yellow line in the chart below:
It's plain to see at first glance that it's the most significant asset. What does it represent and what conclusions can we draw about Apple's strategy?
Before I begin, I should make clear what this asset represents and what it does not represent. These expenditures cover equipment used in production. They do not include components used in the production nor loans to suppliers for purchasing equipment. These are fixed assets that can be depreciated on a schedule and have specific tax treatment as a result. These are, in plain language, instruments used for producing things to be sold. They are things Apple owns.[1]
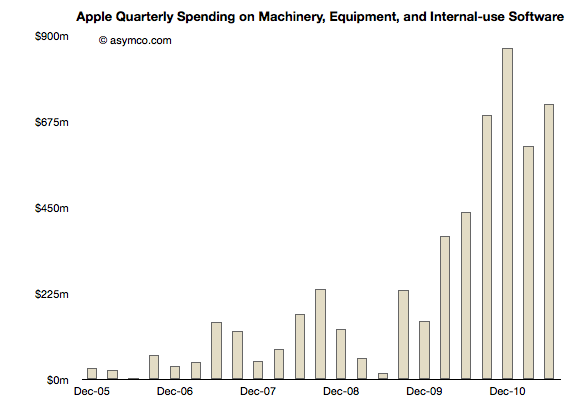
Using the same method as in the other asset analyses I took a measure of the sequential change in that asset over the time period and tried to see if there is a correlation between that spending and some other measure of output from the company.
Here is the sequential change chart since the end of 2005:
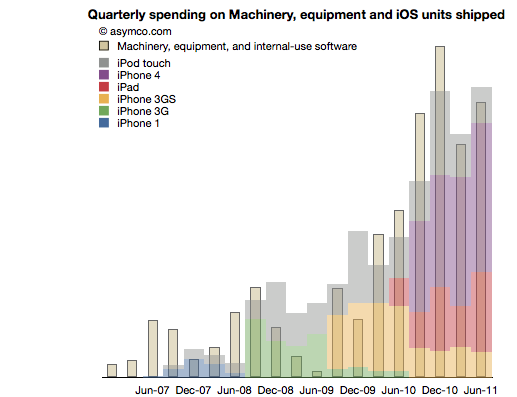
I noted that the pattern seems to relate closely with the increase in shipments of iPhones. More specifically, iOS devices. To test this I overlaid the overall volumes (with estimates of product types) of iOS shipments. This is a modified version of the chart published here.
There is a broad similarity. But again, as in the other analyses, the spending on assets typically predates the "output" from that asset. As we saw in land and buildings, the operational start of a facility may happen many quarters after the purchase is made. Similarly, stores open some time after the spending on fitting them out.
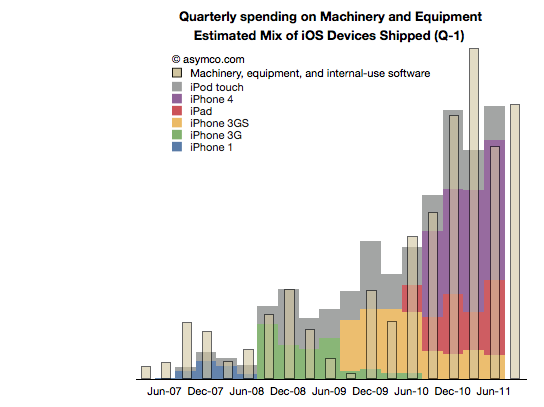
So it is with Machinery and Equipment. If we time-shift the output one quarter to account for spending before production we have a better fit (note the change in the title with "Q-1" indicating that the dates for the iOS shipments are offset by 1 quarter to the left).
We can even take the analysis further by breaking the spending and output into Phases corresponding to specific product cycles and introductions.
Phase 1: The original iPhone
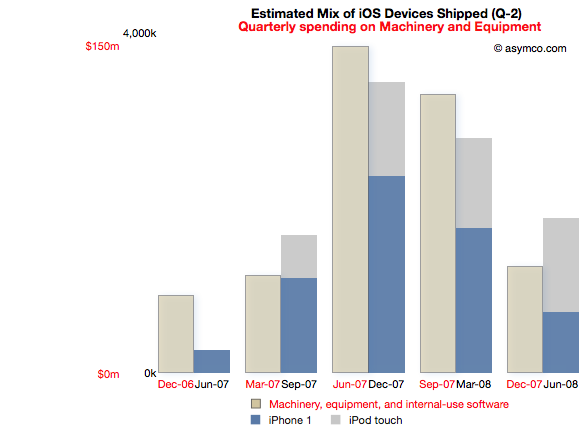
Spending on M&E prior to the iPhone launch began two quarters in advance of sales. The following chart reflects this delay. Note that the M&E payments are marked with quarters ending six months earlier than the shipment schedule. Note also the scale (red denoting the M&E spending and black the units shipped). I also separated the two product types (iPod touch are my estimates, iPhone numbers are published by Apple).
This Phase corresponds to the first "bump" in the expenditure chart but offers more detail. There is an evident relationship between the "input" expense and the "output" of units shipped.
The cost of Phase I was $408 million.
Phase II: The iPhone 3G series
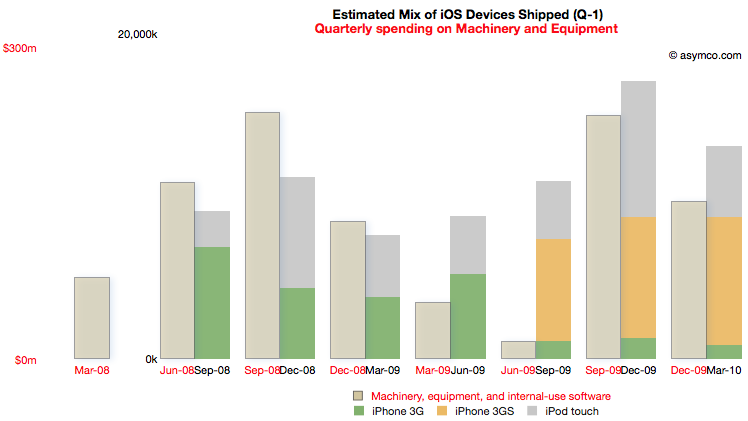
Phase II covers spending from the quarter ending March '08 to December '09 and production from September '08 to March '10.
For this Phase the time shift is only one quarter but there is a quarter's worth of spending that is initiated prior to any shipments. I chose to demarcate this Phase to cover production for both the 3G and 3GS as they probably shared a lot of common equipment. Some spending on new production lines however still had to happen as volumes increased during 3GS production.
Note the scale change from the first Phase. Whereas the maximum in Phase I spending was around $150 million per quarter, the peak is nearly twice as much in the second Phase. The peak output is 5x higher.
The cost of Phase II was $1 billion.
[I had to guess whether the Sep 09 and Dec 09 M&E spending was for 3GS or whether it was to prepare for the ramps in the new products about to be launched in the third Phase.]
Phase III: The iPhone 4 and the iPad
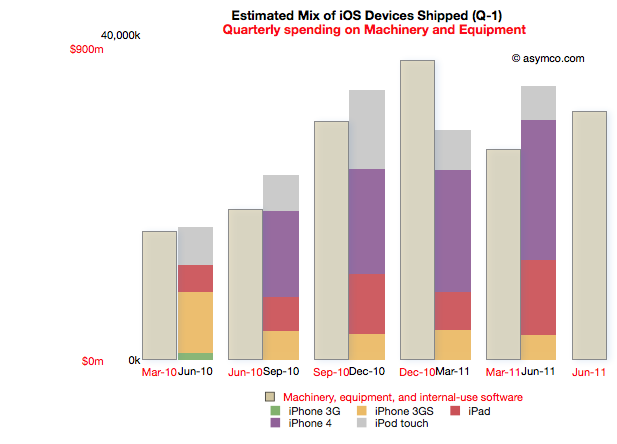
Phase III begins with spending prior to the launch of the iPad 1 (March '10) to the last quarter (ending June 2011). Coupled to this is production starting in quarter ending June '10 and ending in the last quarter.
Note that due to the time offsetting on production, the output from the spending on the quarter just ended will not be known until Apple publishes their shipments for the June quarter (scheduled for October 18th).
The relationship between pre-dated spending and production one quarter later holds quite well. There is a "surplus" of spending in December 2010 but that could be seen as the ramp being prepared for the second iPad.
Phase III cost is $3.7 billion so far.
Note again the change in scale from the previous two Phases. Peak M&E expenditures are around $900 million per quarter while production peaks at around 35 million units. This is a tripling of spending coupled to about a doubling of output.
Observations
The data suggests spending on equipment is correlated with the volume of production of its iOS devices. However, Apple is understood to be a company that outsources its production and does not "own" its own factories. Claiming that it keeps equipment used in the production of iOS devices on its books is an extraordinary claim.
I make a further claim that the scope of spending itself is extraordinary.
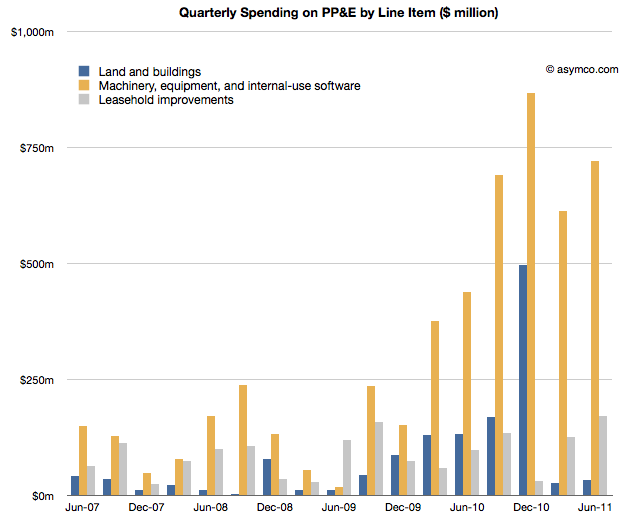
The following chart shows the three asset classes discussed in the three latest posts relative to each other (quarterly change in asset value).
In How much does an Apple store cost? I noted that the spending on leasehold improvements of $2 billion over a few years is significant and sustaining and largely asymmetric to competitors. You can see that spending in the grey bars above.
In The down payment on iCloud I noted that spending on Land and Buildings is significant and sustaining to iOS but not on a scale many can match. Those costs are shown in the blue bars above.
If, as I claim here, the yellow bars show the spending on Machinery and Equipment used in the production of iOS devices, then the commitment Apple has made to controlling production is even higher. In December 2010, M&E expenses were 50% higher than the spending on the data center and the new Cupertino campus put together.
The M&E assets have cost a total of $6 billion. The Apple stores have cost $2.3 billion and land and buildings $2 billion. In other words, Apple's machinery and equipment is worth much more than all its buildings and stores put together.
Compared with what Apple spends on other fixed assets, M&E is spectacularly significant.
In the twelve months ended June, Apple will have spent $2.9 billion in M&E to manufacture 118 million iOS devices. To put that in perspective, Nokia, which manufacturers a large (if not majority) of the 340 million phones it sells, expects full year 2011 capital expenditures of $1.1 billion.
Correcting for amortization and depreciation and deducting some spending on Mac M&E, it's very likely that Apple spent twice as much as Nokia on the instruments of production for one third the number of devices.
Conclusions
It may be too early to draw conclusions from this analysis. The claims should be debated and the claims should be tested, but I can suggest some tentative strategic implications.
Last December I wrote that I thought Apple should use its capital to own the means of production for iOS. I reasoned that device supply was its biggest deficiency and that perhaps ownership would allow them to become better at it.
Indeed, Apple has used capital to ensure it has better control over the supply of components and to also perhaps ensure capacity of production of those components.
But this analysis shows that Apple has gone much further toward integrating its value chain. It suggests that a large part of the tooling in its supply chain is owned by Apple. It suggests that those tools are put out of reach of its competitors.
The implications could be profound but given the length of this post, I'll leave that discussion for another day.
---
Notes:
Some of the capital expenditures were also allocated to servers or "information systems hardware, software and enhancements." From the Annual Report 2010: Capital Assets. The Company anticipates utilizing approximately $4.0 billion for capital expenditures during 2011, including approximately $600 million for retail store facilities and approximately $3.4 billion for product tooling and manufacturing process equipment, and corporate facilities and infrastructure, including information systems hardware, software and enhancements.
Windows Phone is in limbo. The company acknowledged that it has performed below expectations. During the last quarter for which we have data (ending June) I have an estimate that Windows Phone sold only 1.4 million units (Gartner's sell-through analysis suggests 1.7 million). That gives Microsoft a 1.3% share of units sold (Gartner 1.6%), a new low.
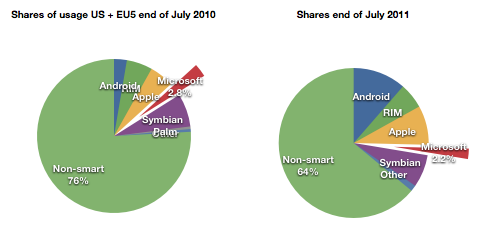
At the same time, comScore data shows that user erosion in the US and EU5 has slowed and is holding at about 2.2% of all users.
For its part Microsoft has lain low during the last few months. It released version 7.5 (Mango) last month to manufacturers. It has a number of Windows Phone SKUs in the market or recently announced (27 with version 7 and eleven with version 7.5)
It also sued Android vendors successfully and obtained royalties from the largest Android licensees Samsung and HTC. Patent royalties from Android are probably going to be higher than license revenues from Windows Phone for quite some time.
Something is missing from this analysis. Clearly Microsoft has a plan. It's always had a plan. The plan is not easily perceived because the market Microsoft addresses itself to is not directly to the consumer--we cannot read the message. Microsoft needs to work through partners. Device vendors and operators mainly. In order to persuade them Microsoft deploys its check book.
Put another way, the plan is that Microsoft intends to buy market share. Before we get into exactly how, we need to understand the most important but least discussed contributor to device sales: channel incentives.
Before a phone is sold it needs to get through a mine field of obstacles: it needs to appeal to operator or distributor priorities; it needs to fill a slot in a portfolio of products for the manufacturer and the channel; it needs to acquire shelf space; it needs to appeal to some end users and, unless it has a blindingly strong brand, it needs to offer incentives to the retailer.
This last piece of the puzzle is something of a mystery. Although not a universal practice, in many cases retail staff are paid commissions directly or indirectly by the device vendor. This relationship between the retailer and the vendor is not transparent. A buyer typically does not know what incentives are attached to a given device. Stories of salespeople steering people to and away from certain devices abound.
Microsoft acknowledges this:
Both Samsung and HTC Corp. have committed to increasing marketing budgets for the phones, said Andy Lees, president of Microsoft’s mobile unit, in an interview. While manufacturers will determine how the money is spent, some of it will probably go toward spurring retail staff to tout Windows Phone models, he said.
Q: It seems like one of the challenges is getting the salesperson in the store to push the phone.
A: Absolutely. I think that's a number of things:
One — they get influenced by how good the product is. The reviewers have influence with that and also their own experience.
The second thing is the alignment with the operator. I think we're already pretty aligned and over the life of this release, we'll get even more aligned.
Even prior to the launch of the Nokia relationship, with the original Windows Phone launch exactly a year ago, Microsoft made clear that it had a budget for promoting Windows Phones ($400 million in fact). In the event, the money seems to not have been spent, or spent sparingly because LG made public its disappointment. The coded language can be interpreted as a snub to Microsoft for withholding promised funds.
Perhaps the funding was withdrawn because by the time the launch was scheduled, the Nokia deal was being negotiated. Perhaps Microsoft felt it better to put more effort behind the re-launch of the platform with Nokia on board. A re-launch which has yet to happen but seems to have already had $127 million allocated to it by Nokia alone.
Microsoft is proud of what it has accomplished with Windows Phone because they were able to update the OS in 11 months and took only about two years to completely rebuild Windows Mobile into Windows Phone.
But the dependence on a complex value network means that products do not reach users quickly enough and when they do the marketing message is weak, even when backed by large budgets. The real problem with Microsoft's approach is that it's neither viral like Android (because it has a price and a contract associated with it) nor is it focused and agile like Apple's. It seems to suffer from the worst aspects of modularity (market lag) without benefiting from the control over the ecosystem and end user experience that differentiates it.
Microsoft will muddle through but the 20% share that it says is "conservative" seems anything but.
I'm glad Windows 8 is named the way it is. With Windows 7 Microsoft went to a numbering system which is much more rational than the mixed naming of the past. The number 8 actually corresponds to the actual sequential number of major versions of Windows released to date.
Windows proper actually did not start with what was called "Windows 1.0". Windows actually started in April 1992 when Windows 3.1 was released. It was the first Windows which was an operating environment onto itself, apart from DOS. It was followed by Windows 95 (which we can call "2"), Windows 98 ("3"), Windows 2000 ("4"), Windows XP ("5"), Windows Vista ("6"), Windows 7 and now Windows 8.
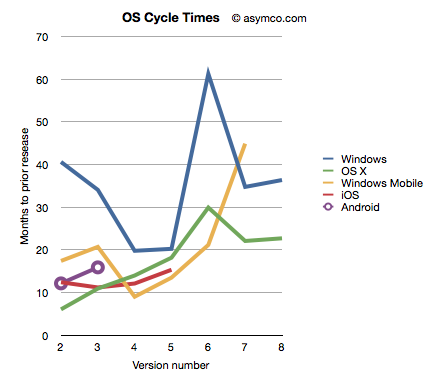
Given this nomenclature and the dates of general availability of said versions, we can derive a measure of the frequency of upgrades. For example Windows "2" followed about 41 months after "1" and "3" took 34 months after "2". If we continue this for all the versions, and assume "8" will launch by October next year, we can plot the cycle times of new Windows versions.
To make the story more interesting I added the same data for other OS platforms. OS X, iOS and Android have version numbers which correspond to the sequential order in which they were released. I am assuming that the numbering system (1.0, 2.0, 3.0 etc.) are meaningful and that major releases are given a new integer value.[1]
I also added Windows Mobile which suffered from the same confused numbering that Windows suffered until the current Windows Phone 7. To create a map to integer values I used the following: Pocket PC 2000 is "1", Pocket PC 2002 is "2", WinMo 2003 is "3", WinMo 2003 SE is "4", WinMo 5 is "5", WinMo 6 is "6" and Windows Phone 7 is "7". There is no clarity when and what Windows Phone 8 will be so that is left off the chart.
The chart above does give a clue that Windows is a bit slower (more months between releases) than alternatives. However, the point I want to convey is that this cycle time can be a strategic advantage. A faster upgrade cycle means more rapid adoption of improvements, not to mention more revenues. Rather than a line chart, the better way to visualize it is as a turning circle.
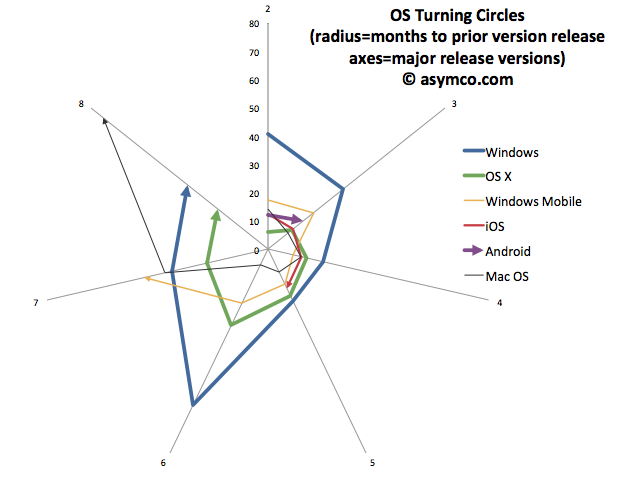
The analogy is from aerial combat where a plane that can "turn inside" an opponent can get into a firing position. The tightness of turning circles also means that a competitor can iterate more quickly and thus move up the trajectory of improvements necessary to remain competitive more rapidly. To that end, I re-plotted the data above with radial axes.
The chart clearly shows how among desktops, OS X has been tighter than Windows[3]. Furthermore, mobile OS's have been, typically, more agile than desktop OS's. The exception being Windows Mobile which had significant architectural and business model challenges. It will be interesting to watch the radius of Android. So far it seems to be tight, but as tablet functionality has been added, the speed of change has slowed slightly.
However, the big contrast is between mobile and desktop. Microsoft tries with Windows 8 to merge the two. But these are different ecosystems. Buyers, OEMs, users, all have different behavioral patterns (jobs-to-be-done) for mobile OS vs. desktop/portables. Will the cycle time for Windows 9 and Windows 10 tighten up? Can Microsoft operate its OS division at this new cycle time?
What is even more bad news is that the most important customers for Microsoft, enterprises, actually upgrade every other version. The Windows "radius" is nominally averaging about 35 months but large account adoption is closer to 60 months.
The contrast is then striking: Consumerized devices with over-the-air updates on a 12 month cycle are five times more agile than a traditional corporate Windows desktop. Another way to look at this is that for every change in a corporate desktop environment, the average user will change their device experience five times. Although Microsoft might find comfort in Enterprises' leisurely pace of change[2], those are the wrong customers to keep happy going forward.
The implications are left as an exercise to the reader, but I would argue that along with the asymmetry in business model around pricing that I highlighted in the last Critical Path podcast, Microsoft has a significant operational asymmetry with devices as a new class of computers.
---
Notes:
The dates of general availability of various versions of operating systems.
Version Windows OS X Windows Mobile iOS Android 1 4/6/92 3/24/01 4/19/00 6/29/07 10/21/08 2 8/24/95 9/25/01 10/1/01 7/11/08 10/26/09 3 6/25/98 8/24/02 6/23/03 6/17/09 2/22/11 4 2/17/00 10/24/03 3/24/04 6/21/10 5 10/25/01 4/29/05 5/9/05 10/1/11 6 11/30/06 10/26/07 2/12/07 7 10/22/09 8/28/09 11/8/10 8 11/1/12 7/20/11
While at Nokia's Enterprise Solutions I was witness to this difference between the cycle time of devices and the pace of adoption of Enterprises. The fundamental disconnect was that the sales cycle for a "solution" was longer than the shelf life of a device upon which that solution was predicated. Needless to say, Nokia Enterprise Solutions did not last long. Nor do we see today any significant Enterprise-focused mobile device businesses (RIM itself moved to consumerize its products years ago.)
I added Mac OS data to the second chart to also illustrate that no company is immune from spinning out of control. Mac OS clearly went spun out after version 6 with increasing delays leading to its demise and replacement. You can also note that its replacement (OS X) was able to straighten-up and fly right. The lesson may be perhaps that ditching and starting over is a viable option.
RIM shipped 10.6 million Blackberries and 200,000 PlayBooks in the last quarter. Management noted that their sell-through was significantly higher for Blackberry (13.7 million) but seems to be very weak for PlayBook as the prior quarter saw 500k units shipped. Additional PlayBook units this quarter probably mostly went into new channels in Asia and there were no additional sales into North America or Europe.
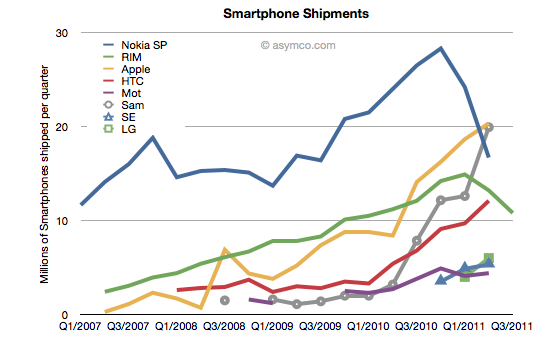
The figures for units are very poor. How poor depends on the frame of reference. Consider the shipment chart below:
In terms of the competition, 10.6 million units is less than half what Apple or Samsung sold in its prior quarter. It's also less than what HTC sold. RIM's volume rank will likely go to fifth place as a smartphone vendor.
In terms of its performance relative to its own history, the Blackberry volume dropped by 11% year-on-year and 18% sequentially. This is the second quarter that shipments shrank.
In terms of market share, we'll have to wait for the competitor data over the next six weeks but the market has been growing at an average of 77% for four quarters so any continuation of this trend would imply RIM's share dropping to single digits.
Finally, the biggest shock has been the decline in profitability. It seems that operating margin dropped from 21% to 13%. The company did incur some one-time charges for recent layoffs, but even without that charge, the margins would be around 16%. This is most alarming. The reason for such drops is that as volumes decrease fixed costs don't decrease as rapidly or at all. The company still needs to keep sales, administration and engineering staff around and they become a larger part of the operating expenses (vs. the component costs which vary with volume of goods sold).
This effect is well understood by financial analysts and the stock price shows it with a huge drop.
But stepping back to look at the picture above, there is a clear turning point in the company. You can see the elbow in the curve for volumes whose effect is felt so deeply. What's curious is why the pivot occurred when it did. We can point the finger to competition as the cause. But why was there no effect in the company's fortunes when the competition actually emerged. It's been years since the iPhone and even Android entered the market. Yet we see an impact on Nokia and RIM individually at apparently arbitrary points of time.
This is the lament of the analyst: you can clearly and accurately state what will happen but when remains a mystery. It's the elasticity between obvious causes and their effects that makes this an inexact science or not a science at all. In retrospect, you can say that Nokia's pivot was triggered by its public execution of Symbian, but that assumes that it was preventable--which we know is not the case. But what caused RIM's change of growth, exactly? Why did it happen this past spring? Why didn't the company volumes begin to decline as iPhone and Android boomed in 2009 or 2010? For quite some time RIM seemed immune to competitive pressure. We all were made fools as we called its imminent demise. Then, as Steve Jobs would say, boom!
---
Footnote:
Piecing together RIM's performance is becoming more difficult each quarter. The data being presented is increasingly obfuscated by irrelevant detail while major information is omitted. This last management presentation was full of holes, namely:
We have no idea of device pricing. Valiant efforts have to be made to piece together that aspect of the business. Matt Richman does a good job but it still requires some guesswork regarding PlayBook pricing to back out Blackberry pricing.
Management detailed where Blackberries were selling-out but only detailed sell-in for the PlayBook. Obvious spin.
They are cherry picking the data they present and each quarter it's a different story making pattern recognition impossible.
This leads to an erosion of trust. Observers are faced with the problem of increasingly guessing what is happening each quarter. For instance, regarding pricing I prefer to include service revenues in the analysis of device sales because device+service is what is being bought by the user and vendors which can offer services as part of the device get a justifiably higher value for the product--value that I think needs to be considered as advantageous. Nokia and Apple also account for services (though not apps) as part of device sales and it makes it more convenient to compare these businesses.
Given RIM's smokescreen, this quarter I decided to stop trying to guess Blackberry pricing and used Operating Income/Units sold as the average selling price.
In yesterday's post about the "biggest mobile loser" I covered the exodus of users from non-smart devices in the US and EU5. I also said that what happens in those regions tends to happen in other regions with a time shift. In some regions it happens quicker but in most it happens more slowly.
But can we be sure that there isn't vast non-smartphone growth in other regions? Well, no, we can't be sure. At least not without access to reliable data.
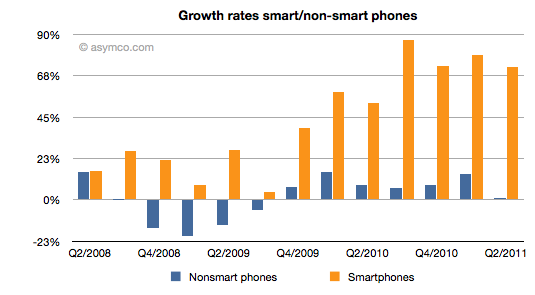
But what we can track is the overall non-smart phone market and compare it to the smartphone market. Here are the growth rates of the two sub-markets:
The difference is plain to see. We can also note that the non-smart market may be heading into a contraction--something noted by some analysts close to the market--but no real sign of that happening in smartphones.
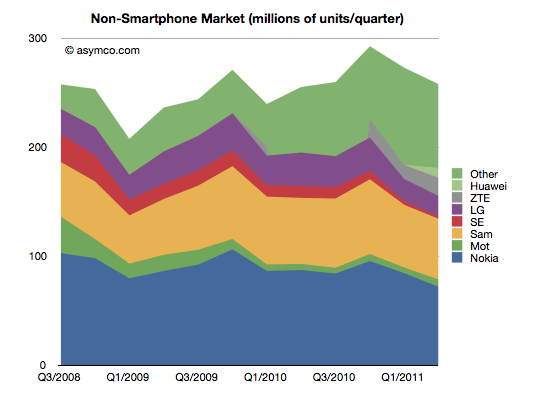
Beside growth, we can also see actuals and the split of various vendors' volumes in the market.
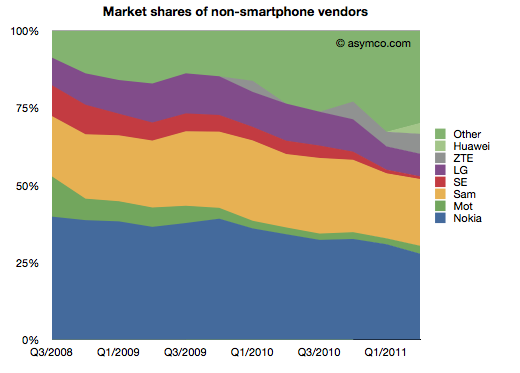
It's also clear that the top line has not moved much in the last few years. Next, the shares of the vendors.
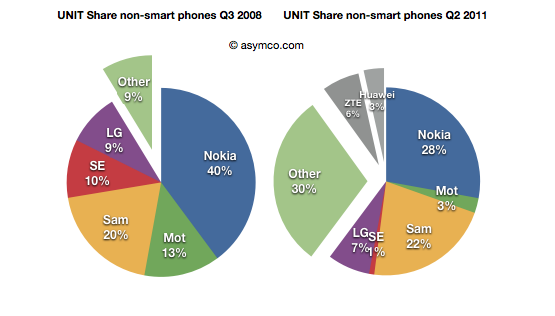
Finally, the before-and-after share pies.
We can see that the growth story, if there is one, is coming from low-end entrants. In late 2008 the main brands had 90% share. They now have about 60% (in a flat market.) The growth is all from "Other".
What seems to be happening is that buyers in mature markets are swapping (or upgrading) from non-smart to smart and adopting new smartphone brands. At the same time, new users in emerging markets are increasingly adopting new non-smartphone brands.
So the question for the incumbent vendors is extremely important: Facing them are low-end and smartphone entrants engaged in a pincer movement, with obvious success; can the old brands survive?
The answer, as always, depends on whether the competition is symmetric or not. Low end competitors are usually structured around low cost structures. High-end competitors are exploiting new markets and new business models. For an incumbent to survive and fight on both fronts they'd have to adopt both of these models for themselves, simultaneously and quickly.
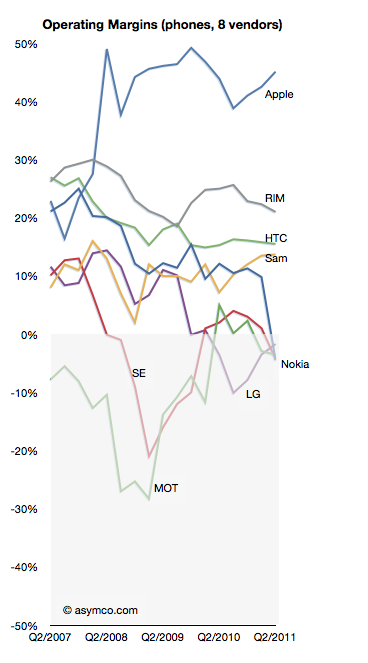
We can see that Sony-Ericsson and Motorola (Google) have thrown in the towel on the low end. The question of dual-front strategy is mainly relevant only for Nokia, Samsung and LG. LG is on the ropes and may actually be ready to exit the market so that really means Nokia and Samsung. Nokia has signaled continuing interest in the non-smart market (citing "the next billion users"). Samsung also seems to be hanging in there. Can they do it?
I cannot stress how difficult this is or how rarely it has been achieved. The two approaches are if not opposites then at least orthogonal. It's like Mission Impossible. You can't be a low cost global vendor while investing in R&D for differentiated platform-based devices. These are shaping up to be businesses requiring completely different skill sets. Few have the ability to host these skills inside one company. I can think only of one example.
LG lost profitability in Q3 2009 and has not recovered it yet nor can it say when it might.
In a recent article on analyst reactions the prospect of LG's exit from handset sales is raised:
LG's handset division is the company's biggest capital sinkhole and the shares have more than halved this year, making it the worst performer even when compared to HTC and Nokia.
"Selling the loss-making business is probably what investors want," said Harrison Cho, an analyst at KB Investment & Securities. "But even with that option, LG wouldn't get much from the sale. They should have sold it long ago before the overall landscape got tougher."
"They simply missed the boat," said Cho.
The dire business outlook had already pushed LG shares below their book value to a record-low multiple of 0.9 times its book value, much cheaper than Research In Motion's 1.6 times, Nokia's 1.1 and HTC's 8.2.
That's a huge discount for a company that is also a global brand in television and home appliances.
As I like to point out it's unlikely that management failure is the sole cause for this problem LG finds itself in. If it were, then why did Nokia, Sony Ericsson and Motorola find themselves in trouble at the same time?
But putting aside the causes, the prospect of another tier one vendor becoming a victim in a booming market speaks volumes. Only Samsung remains largely unscathed, though I believe they are not immune. The shift in profit capture that I have been documenting is plain proof that the industry is undergoing permanent structural changes.
As the chart to the left illustrates, the plunge into negative margins is difficult to reverse. The only advice for LG today (besides breaking itself up) is:
"What LG can do at this point is keep doing what it can do best; keep upgrading its hardware offering, differentiate them and then diversify away from Android to Microsoft's Windows phones," said Jung Kyun-sik, a fund manager at Eugene Asset Management in Seoul.
I suspect however that diversifying into multiple platforms will not be particularly differentiating as every other vendor will do the same.
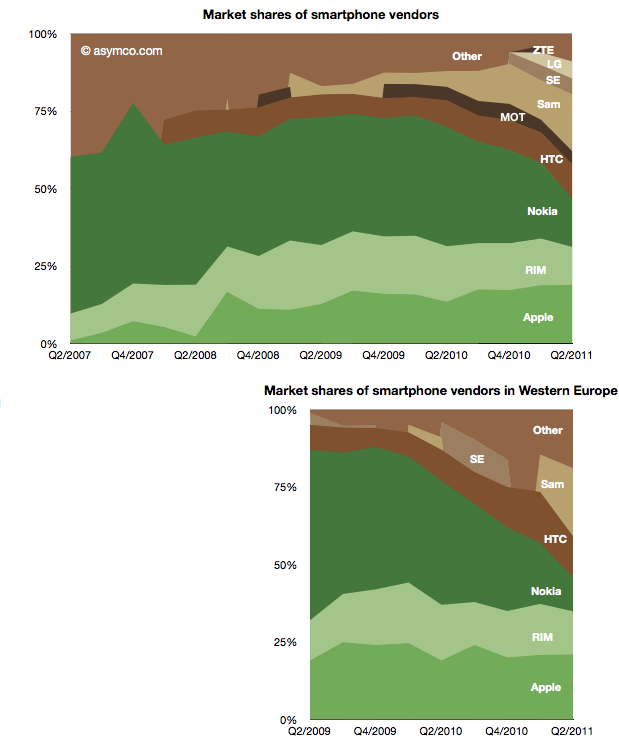
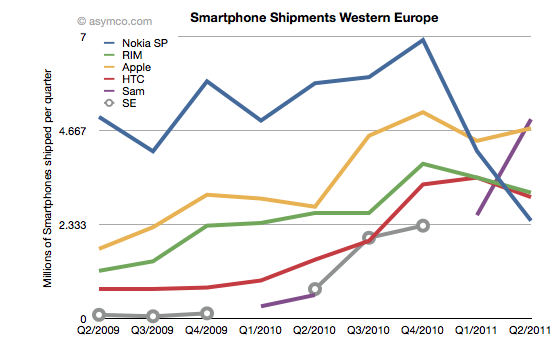
Two years ago Nokia sold 30% of its smartphones in Western Europe. Today it sells 15% in that market. Its unit shipments went from 5 million to about half that and its market share went from 55% to 11%. Its rank in the market went from first to fifth.
The fall is exceptional and dramatic. The two charts below show smartphone market shares. The top chart shows global share and the second shows Western European smartphone shares (European share data sourced from IDC).
The other perspective is shown the the following chart which shows actual units shipped.
One striking thing is how volumes collapsed into Q1 and Q2 this year, coinciding with the public decision in February to deprecate Symbian. The other interpretation I would make is that within the two year time frame Nokia's share has been completely absorbed by Android, not Apple. Whereas most commentary shows Nokia suffering at the mercy of Apple, it's Android that took share in Europe.
Can a Windows Phone portfolio turn Nokia's fortunes around? The first problem is that such a portfolio will not be available until next year. The second problem is that the competition will not be standing still. The third problem is that the market itself may not be growing as fast as expected.
It's becoming increasingly difficult to see how Nokia can weather this turbulence and odds are against it.
Google's acquisition of Motorola is clearly designed to be an acquisition of Intellectual Property rather than an entry of Google into the phone business, but the impact on the business will be felt in many ways.
It is surely going to send some Android vendors scrambling. The situation is not without precedent however. The history of governance and ownership of Symbian shows how the licensing of platforms by licensor competitors leads to unintended consequences.
Symbian was formed to be governed in a way very similar to the original Android via the Open Handset Alliance. The company was owned by a consortium of phone vendors.[1] The shares were not equally distributed however with Nokia holding a larger share (though not a majority).
Although nominally involved in decision making, the smaller shareholders never felt entirely comfortable with the arrangement and over time some sold their shares and left the group even though they continued to license the OS.
Eventually Nokia ended up acquiring the company outright and open sourced the code. However, by then the product was obsolete and the only licensee was Nokia itself.
The lesson (and warning) was that a licensor that is also a licensee makes other licensees uncomfortable. The supplier is also a competitor. This is classic channel conflict and never ends well.
Open or not, with or without equity, these arrangements are always unworkable.
So Google's promise that
"This acquisition will not change our commitment to run Android as an open platform. Motorola will remain a licensee of Android and Android will remain open. We will run Motorola as a separate business. Many hardware partners have contributed to Android’s success and we look forward to continuing to work with all of them to deliver outstanding user experiences."
seems naive at best.
--
Notes:
Before its outright purchase by Nokia in December 2008, Symbian Ltd. was owned by Nokia (56.3%), Ericsson (15.6%), Sony Ericsson (13.1%), Matsushita (10.5%), and Samsung (4.5%). The company's founder shareholders were Psion, Nokia, Ericsson, Panasonic/ Matsushita and Motorola. Motorola sold its stake in the company to Psion and Nokia in September 2003. Psion's stake was bought by Nokia, Matsushita, Siemens AG and Sony Ericsson in July 2004.
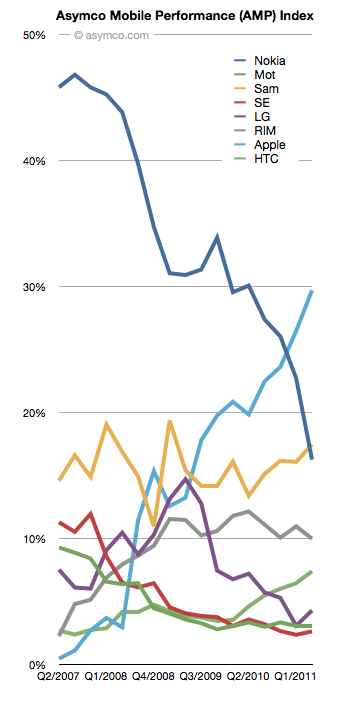
This is an updated view of the AMP index including Q2 data. As a reminder, the AMP (Asymco Mobile Performance) index is an unweighted average of four “shares”:
The updated index figures and spark lines are shown also on the right-most column on this site.
The biggest mover was Nokia which dropped 6.5 points. The second mover was Apple, with a gain of 3.2. Samsung followed with a gain of 1.38 and LG with a 1.21 and HTC with a gain of 0.95.
RIM lost about 1 point and Motorola and Sony Ericsson remained nearly flat.
The plunge in Nokia's AMP score is nearly matched by Apple's gain over the four year time period observed.
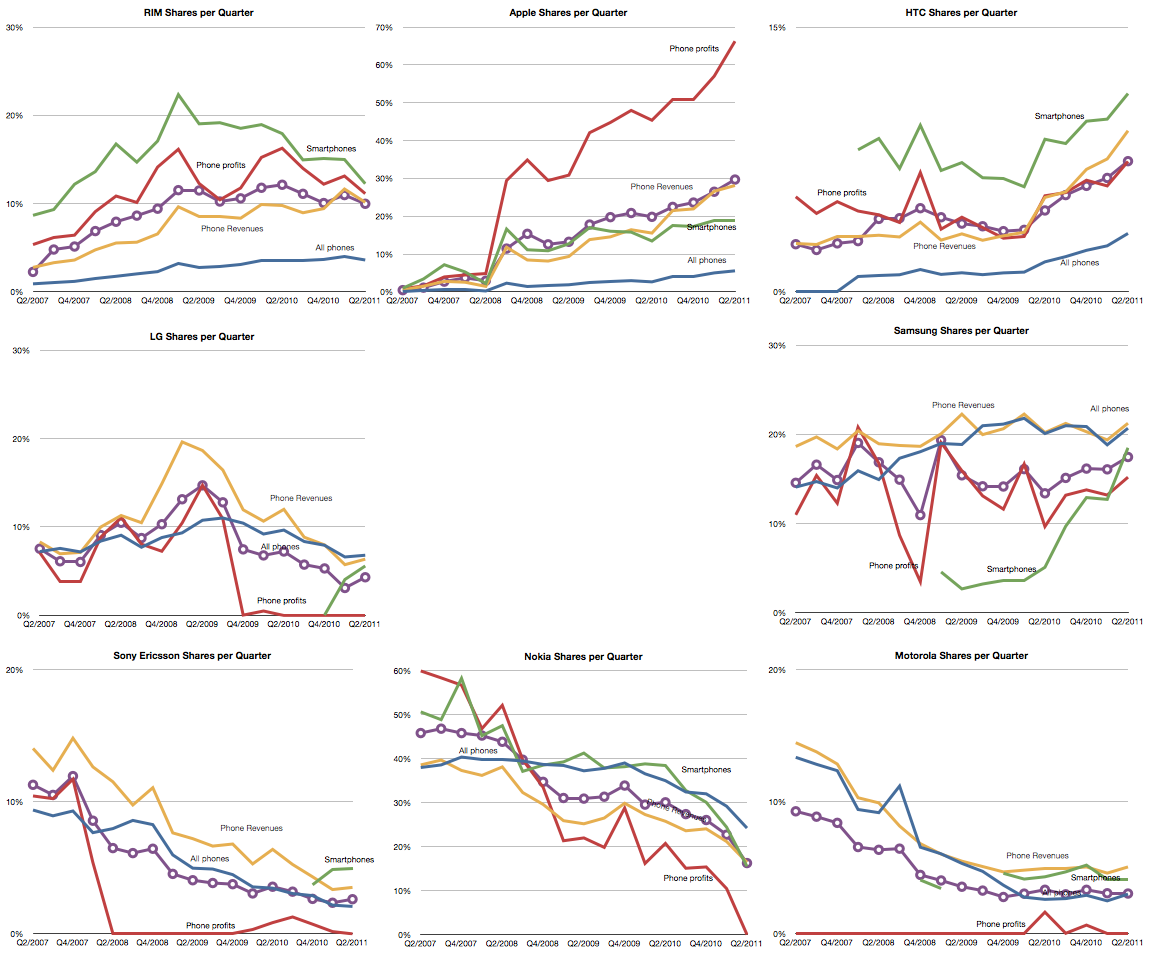
The full picture of each component is shown below: