Asymco

Asymmetric Intelligence

operating margin

  1. The Android Income Statement

    Research · 39 comments

    This is a continuation of the "Android Economics" series of posts. It deals with how revenues and costs are categorized for Android.

    The following diagram shows an approximate representation of what Android's "Income Statement"[1] would look like.
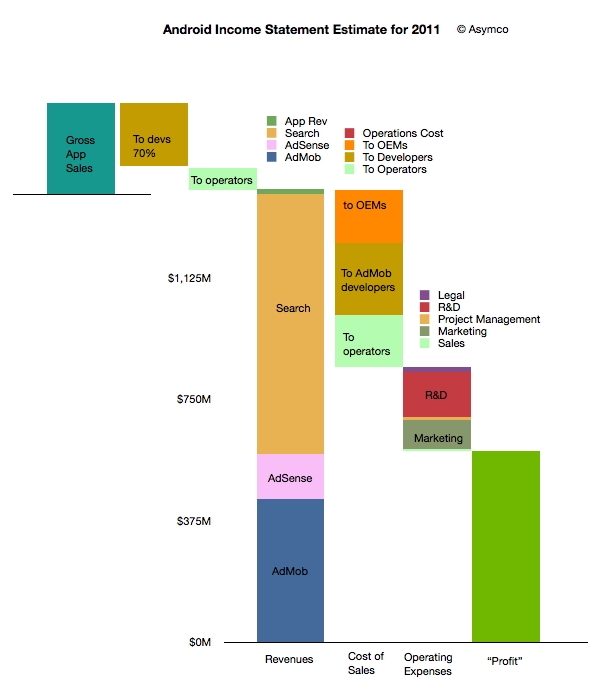
     

    I'll discuss the assumptions that are built into the model as I go along. I'll begin at the upper left and move toward the lower right in the discussion.

    The first thing to note is that sales from Google's (formerly known as Android Marketplace) Play are not registered as revenues. This is because Google, like Apple, treats itself as an agent. Agency means that the revenues don't "belong" to the agent but get passed on through to the primary beneficiaries. In the case of Play, Google passes 70% to developers (or content owners) and then distributes on average 25% to network operators (or carriers).

    I emphasize on average because there are many cases where Play transactions are not handled by or don't pass through operator billing systems. In those cases where operators are involved, it's possible that they capture more than 25%. It's not uncommon for operator billing to capture 45% of a transaction's value. The reason for this is that there is significant collection risk on billing--far more risk than on credit cards. It would also imply that on some transactions Google may be paying out more than it receives.

    This means that on average about 5% of Play content sales to be booked as revenues for Android.

    This 5% ends up a quite a small amount if overall app sales are small. We don't know the exact amount but anecdotal evidence from developers seems to indicate that they receive far more revenues from ad sales than from direct app income. Hence the size of the Android app sales is overall, modest. My estimate is that in 2011 there were about $330 million in gross app sales through the Android market. (Google estimated its sales to be 76 million for 2010 half way through that year.)

    The bulk of revenues are therefore from other sources: Search, AdSense and AdMob. I'm modeling that overall revenues are based on a "revenue per device in use" multiplied by the number of devices in use. Google has publicly stated that they are targeting $10/device/yr. in revenues. This is probably ambitious as the amount was nearly that much in early 2010 but the number of devices bought by emerging market consumers exploded. As they are not actively targeted by Google's primary customers (especially in China), the average revenue per phone is likely to be much lower. I estimated $6.5 on average for 2011.

    However, even if we use $6.5 per phone per year, the total revenues are quite strong since there were likely more than 215 million users at year end[2]. That results in a total revenue base of $1.4 billion for 2011. Removing the app revenues results in about $1.38 billion from Search and AdSense and AdMob.

    How to allocate revenues to these three businesses is mostly guesswork. I used a split of about one third to AdMob, 10% to AdSense and the rest to Search. If we assume this split then the next step is to consider how to allocate costs to these sources of revenue.

    As discussed in the introduction to this series, the primary costs of sales for Search and AdSense are network operators and OEMs or phone vendors. They are the primary "channel" which ensure the flow of search terms to Google. As Google also explains, the channel receives revenue share--so-called traffic acquisition costs (TAC).

    I used an overall allocation of 39% for TAC. Crucially, this includes the payments to developers for AdMob traffic. The rule of thumb I used was:

    • Network operators get 20% of Search
    • Developers get 50% of AdMob
    • OEMs get the rest (of the TAC)

    The resulting split is shown in the column above with the "Cost of Sales" at the bottom. There are also additional operations costs which are negligible.

    After this 39% TAC (revenue sharing), Google needs to pay its operating expenses. This includes R&D, Marketing, Sales and Legal costs for the Android division (including AdMob). You can see the approximate values in the column labeled "Operating Expenses". This operating cost amounts to about 27% of sales, with R&D at 14% and Marketing at 9%. These rather high fixed costs make sense as there is a significant development work underway for Android.

    Finally, after these costs are allocated, the remainder is the contribution of the division. This comes to about 34% of revenues which is called the operating margin. Google has to attach depreciation from data centers and other costs as well as taxes before placing this into earnings.

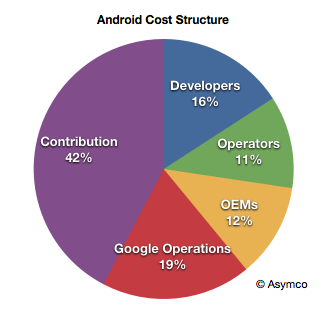
    Considering the agency structure, the overall cost structure of Android looks like this:
    When playing with the assumptions, it becomes clear that the model is most sensitive to the revenue per device and total devices in use. The profitability is entirely dependent on those figures as variable costs are a percent of sales and fixed costs are limited by talent constraints.

    For example, if revenues per device drop to $4.5/yr then the operating margin drops to 38%.

    Now we can calculate some of the more interesting figures. For example:

    • Android OEMs receive $0.76 on average per device per year
    • Android Operators receive $1.07 on average per device per year (including Play)
    • Android Developers, as a group, receive $1.94 per device per year (including Play and AdMob)
    • Google receives a contribution of $2.75 per device per year from Android

    Again, these figures are very sensitive to the revenue per device (currently assumed to be $6.5).

    Because of the number of devices involved, these cash flows are an important part of the value network of mobile computing. The next step will be to assess how they affect the incentives, alignments and competitive stance of various platforms vying for a seat at the table of the future of information.

    --

    Notes:

    1. An income statement shows the sources of revenues and the costs associated with those revenues. It also shows the fixed costs (or costs which are independent of revenues so they don't go up or down if revenues change). Finally it shows the operating income which is called contribution if it's a division within a company. This contribution is still subject to taxes and depreciation before it's recorded as earnings.
    2. I'm using Android installed base estimated based on daily activation rates as published by Google. I've discussed these estimates here. I'm using year-end estimates but subtracting retirements based on a two year device life.
     

  2. Which is best: hardware, software or services?

    Research · 43 comments

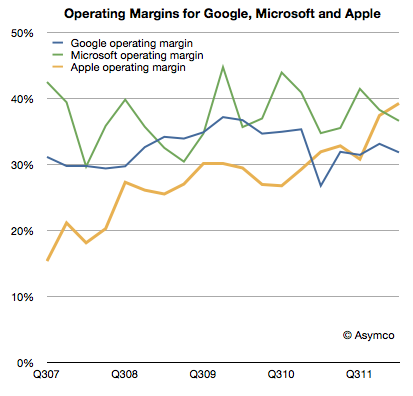
    Apple's recent margins are nothing short of spectacular. It's hard to convey just how remarkable 47% gross margin and 39% operating margins are. For a company that sells hardware these are simply unheard-of numbers.

    The best way I can illustrate this is by comparing Apple's operating margins with those of two other platform-based companies, Google and Microsoft.

    Microsoft invented the software-as-a-business model and, as software is easily reproduced, their margins are phenomenal. The gross margins are typically in the 80% range for software. Overall, the company had higher R&D and SG&A expenses so their operating margins are a more modest 37% on average. However, Apple managed to exceed this value even though it has the disadvantage of actually having to build things made of atoms.

    Google also has led a charmed life free of inventory and factories. Its operating margins have been however hurt by investments needed to sustain the infrastructure for indexing the internet. That means that their margins have hovered around 33%.

    As the chart above shows, Apple has been creeping up on both these benchmark companies with exceptional operational leverage and, as of this last quarter, overtaken them.

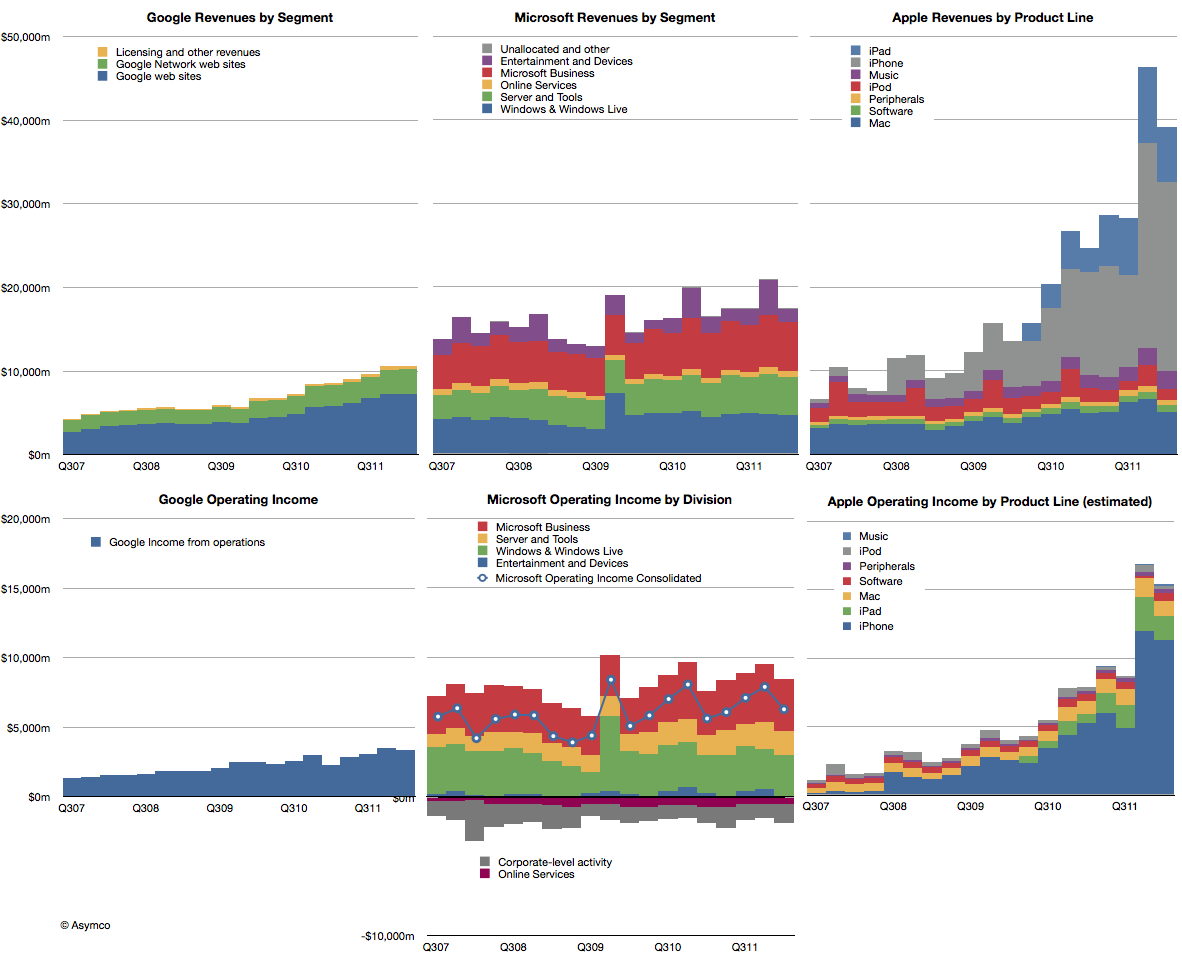
    The reason Apple is able to do this is that its iOS businesses are extremely profitable and, as those businesses grow in absolute terms and relative to its other businesses, the overall margins are reaching into the stratosphere.

    The impact of iOS on Apple is shown in the right-most two charts below. The difference in growth relative to these other great companies makes Apple all the more impressive.

    But the temptation is to compare the "core" business models and ask which is best: hardware, software or internet services. It would seem that hardware is winning, suddenly getting the best margin and best growth--a dramatic reversal with prior technology business dogma.

    However, it would be a mis-reading of what allows Apple to succeed. Apple is the most valuable company in technology (and indeed in the world) because it integrates hardware, software and services. It's the first, and only, company to do all these three well in service of jobs that the vast majority of consumers want done.

  3. Unforgiven: The consequences of profit failure in mobile phones

    Research · 34 comments

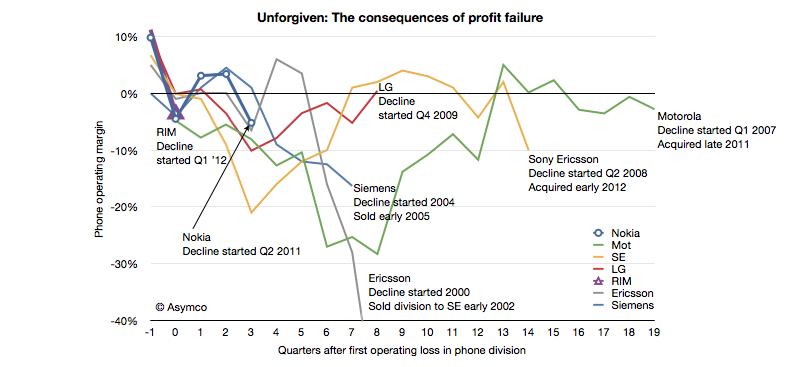
    In June of last year I wrote a post titled "Does the phone market forgive failure?" It was written on the eve of Nokia's Q2 2011 report highlighting the historic consequences of a dip into negative operating margins for a phone vendor.

    I listed 13 phone vendors who were either merged, liquidated or acquired. There are no examples of vendors who recovered from a position of loss making.

    I was prompted to follow-up by a note Charter Equity Research analyst Edward Snyder wrote illustrating the effect of negative operating margins on phone vendors. I took his illustration and expanded it with additional data.

    Since my post in June last year Sony Ericsson and Motorola were acquired making the victims list total 14 companies, with Nokia, LG and RIM having joined the "endangered species list". If the pattern repeats, then RIM and Nokia are in early phases of what promises to be an extended period of pain followed by an exit.

    What the analysis does not answer is when a vendor loses its independence after beginning loss making. Motorola took 20 quarters; Sony Ericsson 14, Ericsson 8 and Siemens only 7. We cannot tell if or when LG, which is still operating after 8 and Nokia, which is now in its fourth and RIM, now in its second quarter post-loss, will lose independence.

    The rumors swirling around RIM and LG are centered around exits and some suggest Nokia will follow. Many also argue that these companies will recover. The conditions they each face are different in details but broadly they are the same. Earlier last decade the exits were prompted by loss of brand value and subsequent loss of distribution. This decade disruption brought upon by mobile computing brings with it new business models centered on ecosystems and value captured through software and services.

    Until and unless these endangered companies solve the dilemma of having the wrong business model at the wrong time, the chances are that they will not be forgiven for market failure.

  4. RIM to give up

    Research · 79 comments

    RIM’s CEO, Thorsten Heins was quoted as saying, “We plan to refocus on the enterprise business and capitalize on our leading position in this segment. We believe that BlackBerry cannot succeed if we tried to be everybody’s darling and all things to all people. Therefore, we plan to build on our strength.”

    via RIM to give up most consumer markets | Ubergizmo.

    RIM's latest quarterly results show a continuation of the decline in sales that began in Q1 2011.

    Here are the highlights:

    • Smartphone units declined 26% y/y and 21% sequentially. Over a four year period the company still shows a positive growth of 20% compounded, though that is far below industry average
    • The smartphone revenues were down 29% y/y and 23% sequentially.
    • Including service revenues, the revenue per smartphone dropped to $346, a drop of 4%.
    • I estimate the phone operating margin to be less than 5%. The company swung to a net negative operating margin due to write-downs of tablet inventory but the phone business managed to break even.
    • Operating income from phone operations dropped to the lowest level in five years.
    • The company is still generating cash flow and has a cash reserve of over $2 billion.

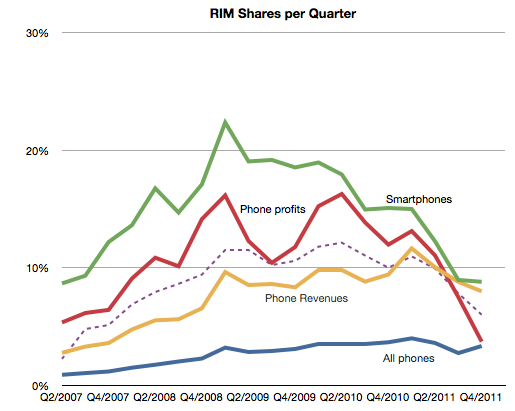
    Seen in isolation, the company is clearly struggling but does not seem to be on its last legs. But no company should be seen in isolation. As part of a competitive market, the company is in far worse shape. The following chart shows the AMP index which measures relative performance through a blend of market shares.

    This chart does not include the latest quarterly data but if it did it would be sure to show a continuing decline. The AMP index actually shows RIM peaking in Q1 2009, well before the volumes peaked.

    It's within this context that we need to evaluate the new CEO's strategic shift. In the quote above we have the first significant strategic departure and split from the past. Should it inspire hope or despair?

    The idea of focus has huge benefits. Focus and the art of saying no are keys to greatness. However, you only succeed if you focus on the right thing. "Enterprise" is not the right thing. It's not a valid target. Enterprise support is a feature, not a product. I don't mean that as opinion, but as a point of fact. Focus on a set of customers whose only characteristic is a job description is missing the whole point of focus.

    Focus needs to be positioned on a job a brand needs to be hired to do. The idea should be to solve an open problem which is either too complex or too uneconomical for anyone else to solve. Corporate buyers have problems to solve but the BlackBerry no longer offers unique or defensible solutions. Furthermore, corporate buyers are themselves being dis-intermediated from the computing purchase decision. Sometimes this process is called "consumerization" but it is more plainly explained as "commoditization". The selection of tools for workers by a group that claims to understand their needs better than they do is an archaic concept.

    This was true even in 2005 when RIM began targeting consumers. It was then that they saw the writing on the wall--that their enterprise business was being commoditized. All of RIM's growth since has been in consumer segments. By abandoning that trajectory RIM is effectively giving up on growth. And giving up on growth is simply giving up.

  5. iPhone sine qua non

    Research · 82 comments

    Last week I made an attempt to measure the iPhone's manufacturing cost given new data points from the Foxconn field trip. The post generated a great amount of new knowledge and the feedback was very valuable.

    The main value to me came from stepping back and looking at the entire cost and value structure for the iPhone. Putting costs into perspective is as valuable as knowing what they are.

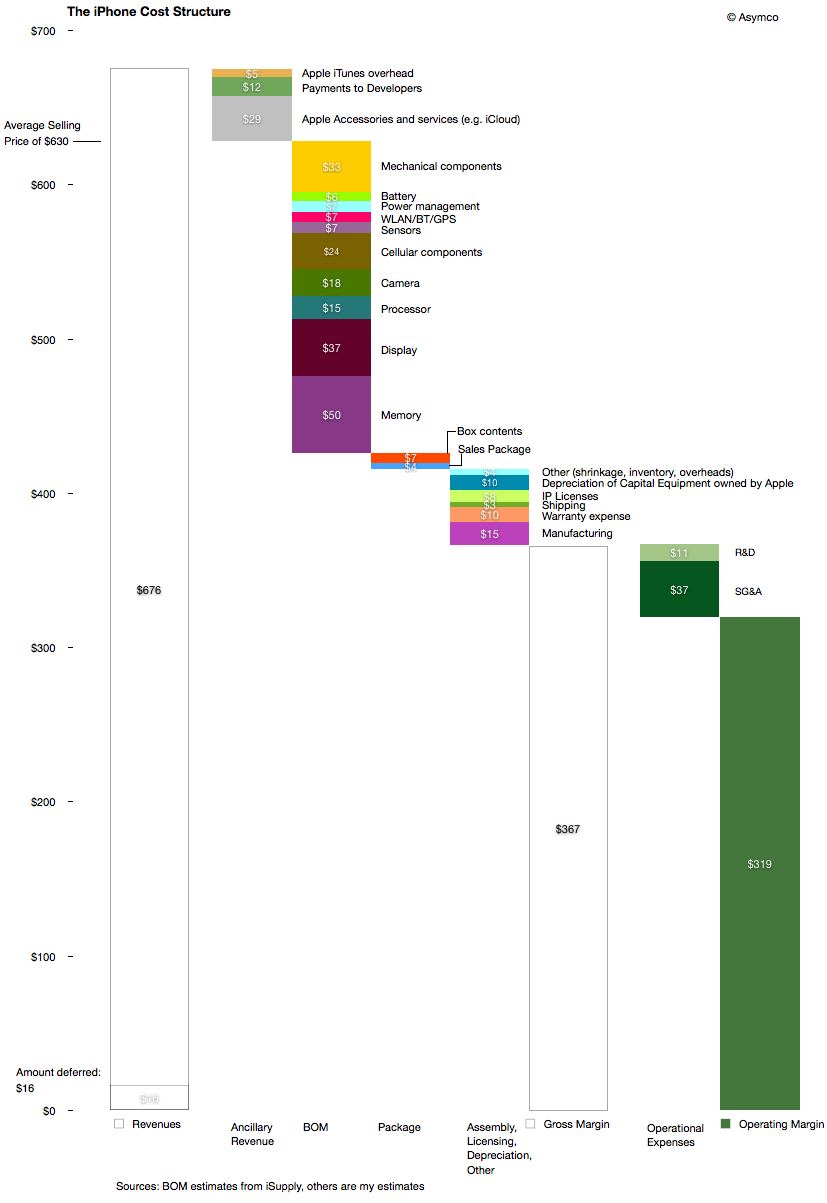
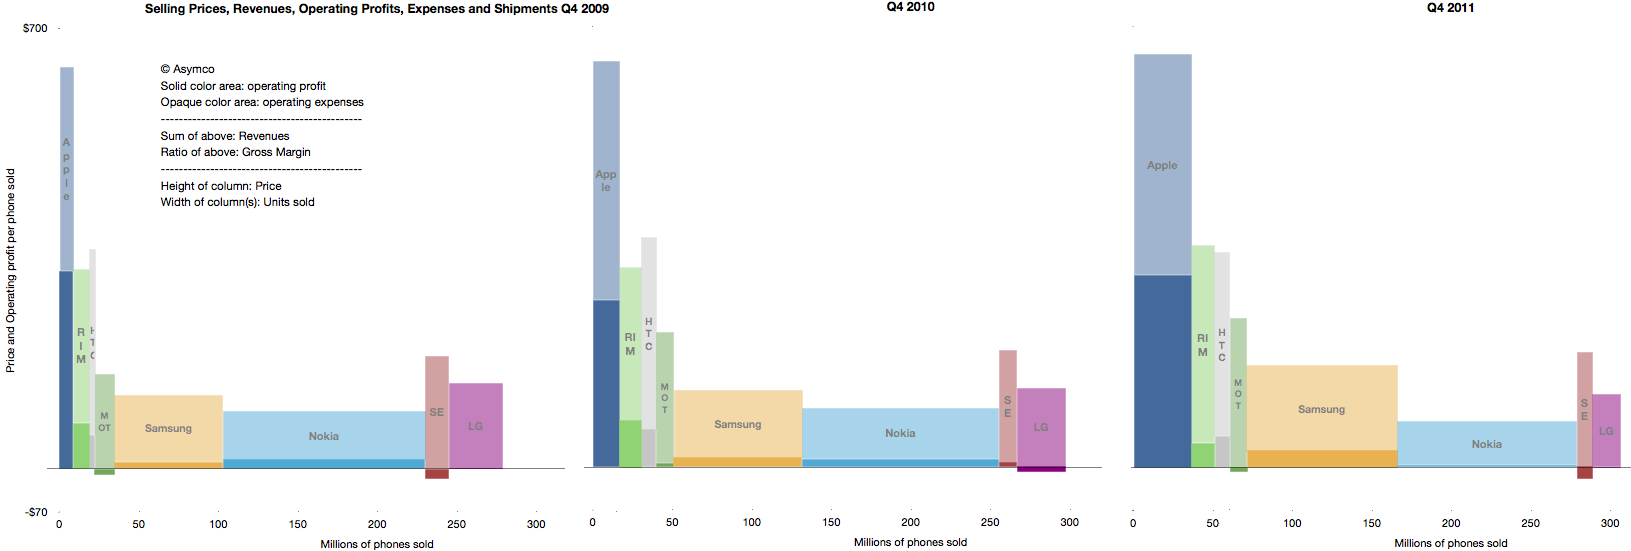
    The following diagram shows my estimates for this cost structure for the fourth quarter given both bill of materials estimates and the other parts of the cost of goods sold and operational expenses and even ancillary sources of revenue.

    Source for BOM estimate: iSupply.

    There are several observations easily made from this view:

    1. The manufacturing cost ($15 may be very generous i.e. high) but it still amounts to a tiny fraction of the device cost and hence value-add. The direct labor part of that cost is tinier still.
    2. Depreciation on capital equipment (Apple owned) amounts to $10 per device, probably higher than the direct labor cost.
    3. External developers as a group receive more app income than the salaries and costs associated with Apple's own developers working on the product.
    4. The gross margin percent is 58%.
    5. The operating margin is estimated at 51%

    The high margin that the product generates is even more surprising given the industry average as seen in this summary view of the industry's performance over three years' fourth quarters.

    The operating margin is the ratio of solid colors to the entire bar.

    As someone pointed out on twitter: one of these is not like the others.

    The question should be: How is this possible? What does this product have that gives it such a pricing advantage? Note the the ratio was preserved through the three years shown and has persisted for nearly five years.

    The answer to this paradox is in data that is not visible in any of the diagrams above: The largest revenue attached to the iPhone comes into the mobile network operators. We don't have global averages but the revenue the iPhone generates over its lifetime is probably two to three times the revenues that Apple directly receives. The ARPU iPhones are attached to allows for a substantial subsidy, but more importantly, loyalty (or churn)

    As seen in the small but clearly visible US market, being an operator having  iPhone exclusivity generates above-average growth and being the only operator to be excluded from the product generates above average subscriber losses.

    It quickly becomes obvious that ranging the iPhone has moved from being an advantage to not doing so becoming a serious disadvantage. The product and its high up-front costs are "hygiene factors" for operators. The sine qua non status means that it can still be priced with the extraordinary built-in margin shown above.

  6. Visualizing Apple's Profitability

    Research · 26 comments

    After the last earnings report, many noted that Apple's gross margins dipped. Turley Muller noted in a letter to PED that the cause was probably the aggressive ramp in iPhone 4 production which broke new records at 14.1 million units.

    That may be. My estimate of iPhone margin shows it dropping to about 49% from the more usual 55% (sometimes even higher).  We'll never know exactly how much, but sometimes margins drop. RIM and Nokia are punished for drops in the GM percent so why shouldn't Apple?

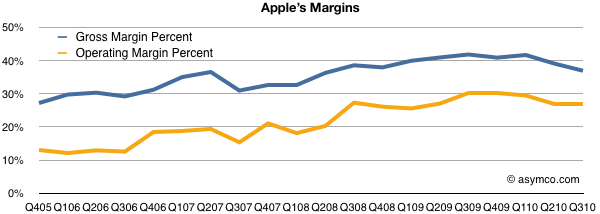
    However, there are some other factors to consider: the overall margin is currently historically very high. As the high-margin iPhone makes up more of the total product mix, the overall margin should be growing. And it is. The chart below shows the trend since 2005. GM was in the high 20's five years ago.

    Note however the other margin: operating margin. After taking the fixed costs into consideration (which we saw to be shrinking as a percent of sales), Apple's bottom line profitability has been rising slightly more rapidly than the GM. It has plateaued recently but not dipped significantly.

    Also note that there have been dips in the past from which GM expansion resumed. One such dip was at the launch of the first iPhone in 2007, though we can't be sure that was attributed to the iPhone itself or to other factors like that most cited by management: components costs.

    However, the bottom line profitability is only part of the picture. It would be instructive to look at which product contribute how much. You won't see this analysis often because the gross margin by product is not published by Apple and it takes quite a bit of guesswork to get there.

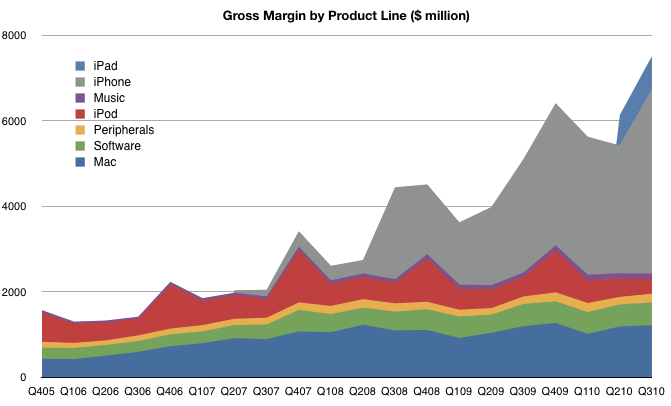
    I maintain product-level gross margins and compute the overall GM bottom-up. The product-by-product line profitability is based on several assumptions which I won't detail here, but those assumptions lead to the following contribution chart:

    There are several takeaways here:

    1. The iPhone is huge (57% of gross profits). It is far more important than most people assume. Without it, the company would not have materially grown EPS since 2007.
    2. The "Music" which includes iTunes revenues is tiny. Many people assume that iTunes is a large contributor to Apple's operating profitability but operating margins on the store are 10 percent. Peripherals add more to the bottom line than the iTMS/App Store. The benefit of the iTunes/App Stores is in the hardware sold.
    3. Software contributes more now than the iPod. This is completely under everyone's radar but Apple's software business has been growing and with 80% gross margins (assumed) it's a big part of the profit picture.
    4. The iPad margins are lower than the iPhone. As it grows in volume, the profit share will grow, but it's a long way from being the profit share leader.

    This picture should also be a warning to Apple's competitors. If they seek to grow shareholder value and shift profits away from Apple they need to see just how much of that profit is captured in hardware. At the same time, they need to realize that it's the non-hardware businesses which make the hardware so desirable. Like it's products, Apple's income statement is very inter-dependent.

  7. HTC: How They Compare

    Research · 17 comments

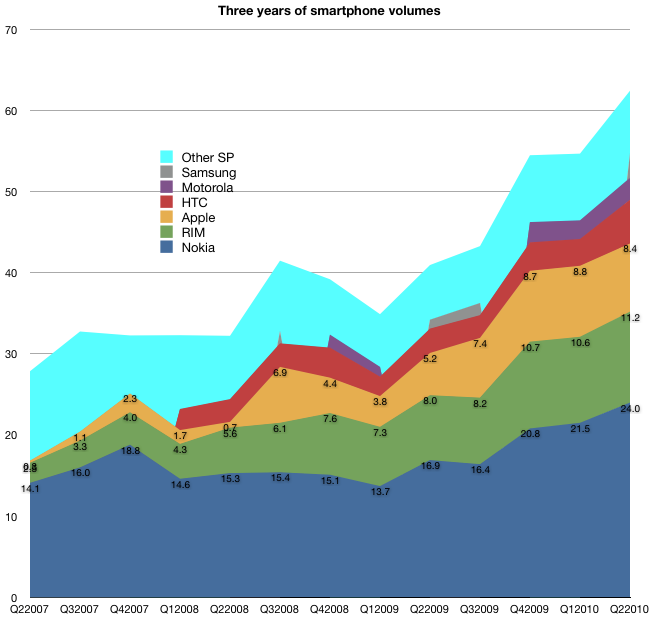
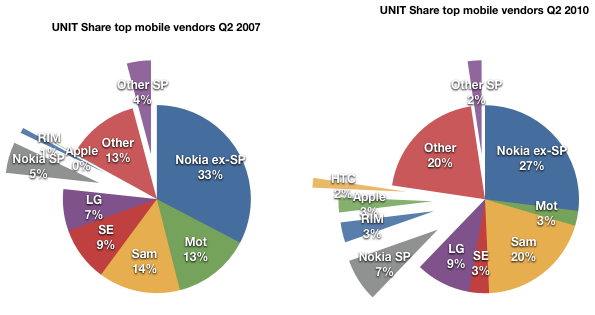
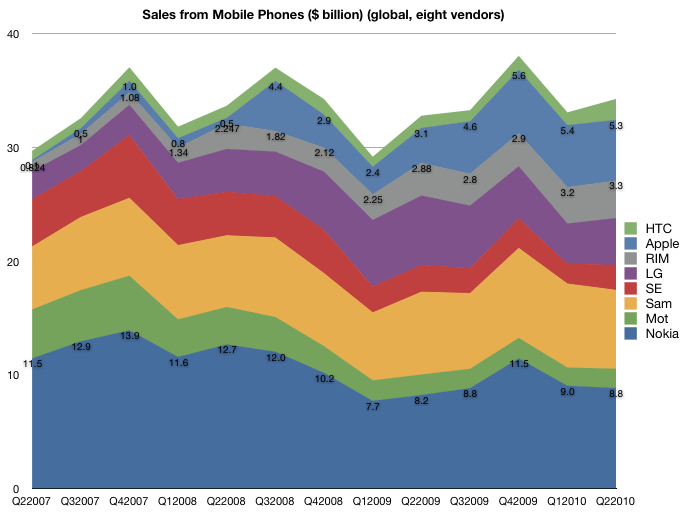
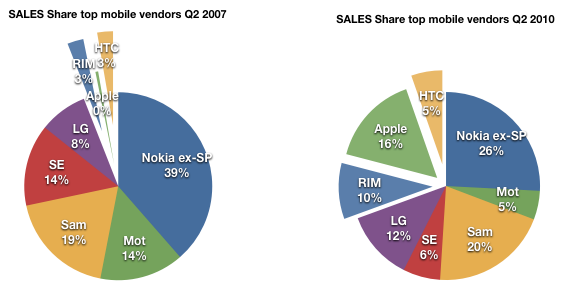
    In the last mobile market update series I wrote of  the evolution of market share, the shift in where dollars are spent, the tale of ASP erosion, profitability ratios over time and EBIT share over time.

    I did not include all vendors for various good reasons. The first survey (market share) did include an "others" category that made the volume data complete, but in the financial data sets, I chose to include the top 7 vendors that make up 80% of device volumes.

    One noteworthy vendor that was not included was HTC. HTC is an important vendor for several reasons:

    • it's a pioneer in smartphones having made the first Windows Mobile devices and the first Android devices
    • at one point it sold 80% of all Windows Mobile devices
    • even if it did not brand its devices, it was the name behind many re-branded or white-label operator branded phones
    • it has a brand of its own today and is expanding its reach

    HTC has been around building devices since 2001 and so it would be a pity to exclude them from any analysis of the effect of iPhone on the market or any discussion on the effect of smartphone disruption on feature phones.

    The challenge with HTC was that historically their branded devices and white label devices were not reported by the company separately. This matters because white label devices are valued differently. Typically these devices are not marketed by the original manufacturer so SG&A is not applied to their cost base. Operating margins, ASPs and hence profitability is not directly comparable with other OEMs.

    But HTC has recently changed its reporting. Thanks to a reader I discovered that, since 2008, HTC has been listing its ASP and Operating Margin making direct comparisons possible. I still don't have all the data, but enough to add HTC to the analysis.

    So, here are the 5 industry performance criteria, now with eight vendors listed.

    Volumes

    Note that HTC volumes start in 2008.

    The volume of units HTC sold has been increasing at about the rate of market growth.

    As a result, HTC's share has not increased as dramatically as those of the other smartphone entrants.

    Sales

    A similar story in the sales picture. Although a consistent performer, the growth has not matched that of RIM and Apple.

    ASP

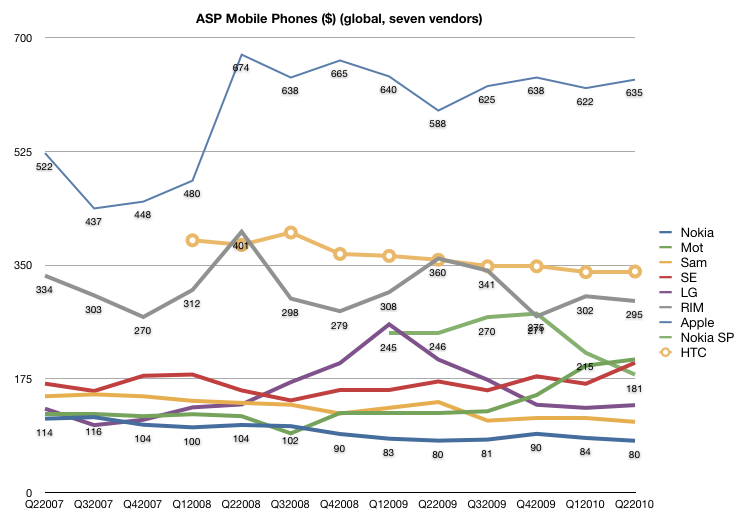
    The pricing story is also a mixed one. Although HTC lies between RIM and Apple in price, the erosion is more consistent with RIM and the rest of the industry.

    Margin

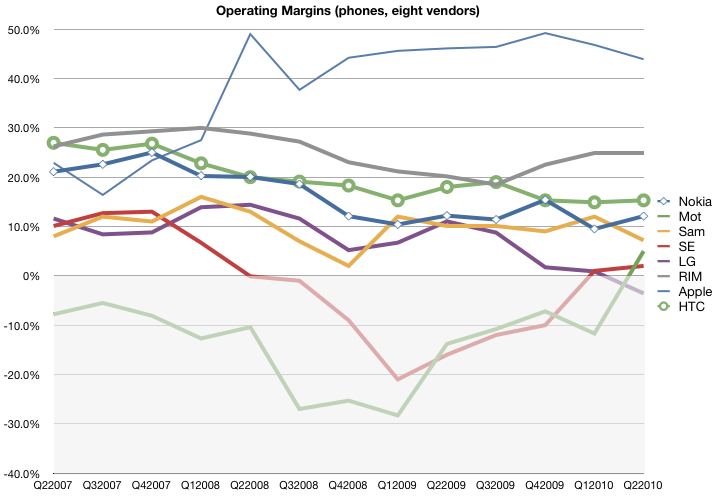
    The margin story is also not as positive as one might expect. The margins for HTC started out above Apple and RIM but have dropped to closer to industry average. This is not what one might expect from an exclusive smartphone vendor.

    Earnings

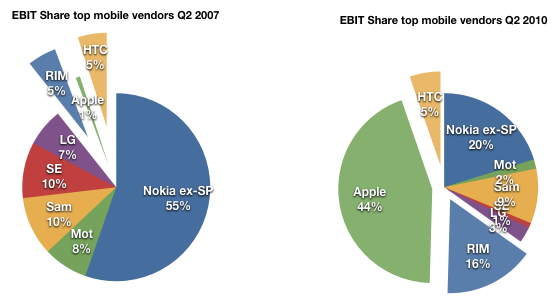
    The share of earnings has remained unchanged at 5% over the period of iPhone presence. It's perhaps a credit to HTC that they did maintain their position in the market with the massive change that has come to pass.

    However, here we also have to ask if HTC is riding a disruptive wave.

    When I wrote the last series, my definition of “loser” was a company that had faced a long series of operating losses and has no viable software assets of its own, making it vulnerable to Android (and Windows Mobile). Motorola first, Sony Ericsson second and LG now coming into the picture. Nokia is not a loser in this sense since it has remained profitable and does maintain an investment in software. Same with RIM and Samsung (now with Bada). When/if they do have the near death experience, they might opt for the Android lifeline (flimsy as it is).

    However HTC does not fit the mold of either "winner" or "loser". It's the Goldilocks company, not too hot, not too cold.

    But I would add that HTC is not an example of a winner because of its adoption of Android. HTC’s dependence on Windows Mobile made their move to Android the most desperate of all. Unlike the larger OEMs, who had their low end devices to fall back on, they are completely dependent on a smartphone OS vendor. When WinMo was showing the first signs of crisis in 2007, they were the first to flee to Android (think of why they would risk the wrath of Microsoft for something so fragile as Android in 07). They are also trying hard to escape the dependence by building up their own UI (SenseUI) and I would not be surprised if they move to their own OS in the future. Being associated with Android does not confirm them as "winners" but in fact, shows their vulnerability.

    What does this all say about Android?

    Again here my thesis is that Google chose to sustain the industry rather than try to upend it. I don't judge their motives, but the fact is that with Android, Google is not in a position to disrupt telecom. There were high hopes dashed with the Nexus One and hearts broken with net neutrality and now there are patent wars to be fought. Android, with its licensees, is still at the mercy of operators.

  8. Android's Pursuit of the Biggest Losers

    Research · 170 comments

    The mobile phone market is intertwined with the telecommunications industry which is vast and there are numerous competitors which are much more dynamic and better capitalized than the moribund PC or music player vendors. It’s also a regulated and fragmented global market with 1.2 billion units and 5 billion consumers—far greater than any of the markets Apple played in for its first 30 years.

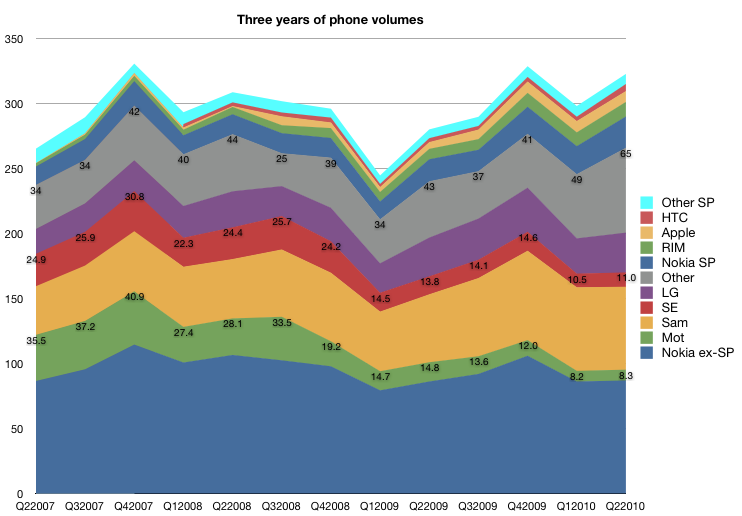
    Nevertheless, the iPhone has had a huge impact on the industry. To show just how much of an impact, I dove in and pulled over 500 data points on three years’ financial performance of seven competitors responsible for 80 percent of units being shipped today. The time frame covers the iPhone’s participation in the market so it allows for “before-and-after” comparisons.

    I divided the findings into five articles:

    1. Unit Volumes. The evolution of market share.
    2. Revenues. The shift in where dollars are spent.
    3. Selling prices. The tale of ASP erosion.
    4. Operating margin. Profitability ratios over time.

    Now I turn my attention to draw a bottom line from all the data above, namely the operating earnings (EBIT or Earnings before Interest and Taxation).

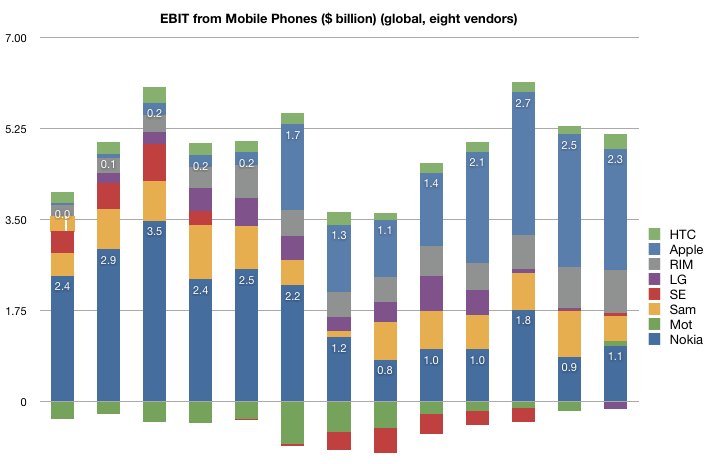
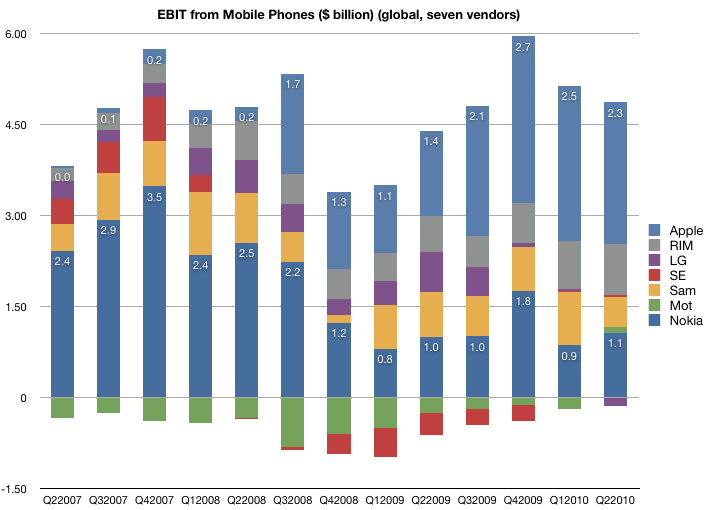
    The first chart shows the EBIT from the top seven vendors of mobile phones since the quarter when the iPhone launched. I annotated Nokia and Apple's bars to give perspective.

    The total available profits in the industry dipped to a bit under $4 billion at the trough of the recession, and have recovered to nearly $6 billion in the holiday quarter last year. However, not all vendors are profitable. As you might expect from looking at the operating margins, Motorola and Sony Ericsson have been generating losses for most of this time period. They have both reached profitability in the last quarter, though at very low levels and after having lost a large part of their sales. LG has turned negative this past quarter after being a modest earner for some time. Samsung has maintained a fairly even consistency in its profit capture, though with its expanding market share, it seems to have come at the cost of pricing.

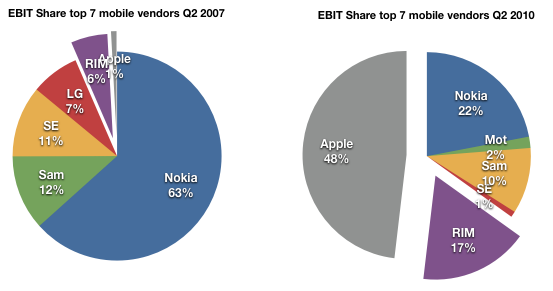
    Finally, looking at the pure smartphone vendors RIM and Apple, the picture is nothing short of astonishing. This before-and-after share-of-available-profit chart shows that the two entrants went from about 7% profit share to 65% in three years.

    Apple in particular is capturing about half of the available profits with three percent of the units. It dwarfs all the other vendors, more than double the nearest (Nokia). All that in three years and with the added burdens of only three models, a recession and limited distribution.

    What does it all mean?

    Here are my conclusions, enumerated:

    1. The lack of a real response. The recurring theme in this series of articles has been that giant multinational incumbents in a vast and rapidly growing industry, enjoying all the advantages that size and incumbency, have had their profits taken from them. And they don't seem to have put up much of a fight.
    2. It's all wealth transfer. Note the total amount of profit available has not increased markedly; this is not about incumbents growing the pie. Two thirds of what should have rightly been theirs moved from the incumbent shareholders to the entrant shareholders.
    3. Speed. This shift of profit occurred over an unprecedentedly short period of time.  Three years is no more than two product cycles in the industry and it's an order of magnitude faster than what happened historically to other industries.
    4. Disruption is the diagnosis here. The incumbents were caught in the headlights. Disruptive innovation leads to asymmetric competition and this is what we just witnessed. History has shown that the shift of profits is usually the last stage of disruption and is usually irreversible because the change in business models cannot happen at the rate of change of profit transfer.

    Which leads me to one final point.

    When analyzing the potential for challengers to the new winners, the most cited is Android. Can Android affect this redistribution of profit once again? And to whom?

    If Android is to become the dominant platform, does it depend on the success of its licensees? Who are these licensees and what are the chances that they will be able to align their businesses to what Android offers (a new revenue model based on services and advertising).

    One problem I see is that Google is making a bet on those same vendors who are now squeezed in the middle of that last pie chart: Samsung, LG, Motorola and Sony Ericsson. Nokia, Apple and RIM will certainly not take the OS over what they already have as it dilutes their differentiation and margins. That means Android is aligned with the biggest losers in the industry.

    So how likely are these disrupted ex-giants to recover and take Android forward? My bet: slim to none. Android does not offer more than a lifeline. It is not a foundation for long-term profitability as it presumes the profits accrue to the network and possibly to Google. Profit evaporation out of devices to Google may be a possibility at some time in the future, but only if the devices don't need too much attention to remain competitive. But because they're still not good enough (and they won't be for years to come), it's certain that attention to detail is what will be most important to stay abreast of Apple.[1]

    So here we have the real challenge to Android:  partnership with defeated incumbents whose ability to build profitable and differentiated products is hamstrung by the licensing model and whose incentives to move up the steep trajectory of necessary improvements are limited.

    In other words, Android's licensees won't have the profits or the motivation to spend on R&D so as to make exceptionally competitive products at a time when being competitive is what matters most.

    [1]: I would argue the same lack of symmetry with licensed software vendor Microsoft is what led the the failure of the same incumbents to make a dent in the industry with Windows Mobile [2003 to 2010].

  9. Phone incumbents' average operating margin: 4.5%. RIM and Apple: 34%

    Research · 10 comments

    After ASP, Sales, and Unit Volumes we look at the three year history of operating margins for the seven most significant mobile phone vendors (Nokia, Samsung, LG, Motorola, Sony Ericsson, RIM and Apple).

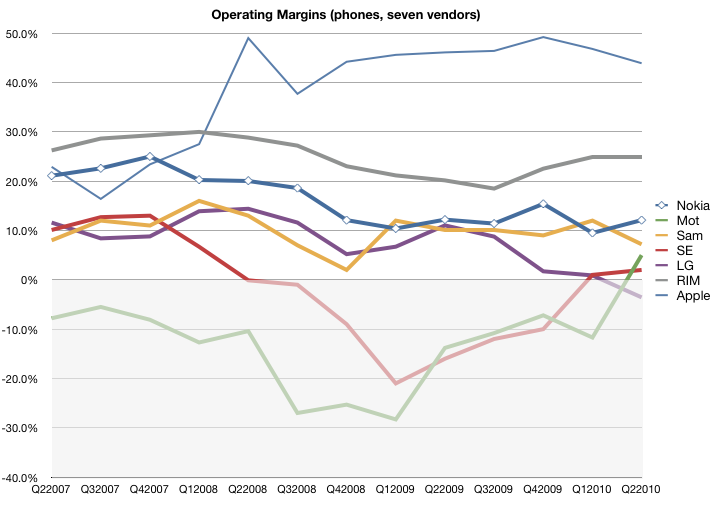
    The following chart shows the OM from mobile phone sales. These figures are as reported by the companies with the exception of Samsung and Apple. Samsung reports OM for its telecommunications unit as a whole and we have to assume that it's largely accurate for mobile phones. Apple does not report margins for its iPhone but it's possible to estimate gross margin percent for the iPhone and then subtract its overall OPEX as percent of sales. This assumes that OPEX is allocated to the iPhone in proportion to sales, which is the best assumption we can make at this time.

    The data shows that the iPhone has been considerably more profitable, due mostly to a high ASP, than other vendors. Motorola and Sony Ericsson have been "underwater" with respect to margin for much of the time period, with LG recently dipping into the red.

    Nokia's margin erosion is a source of significant angst but note that it has just reached Samsung's historic level (around 10%). LG, long seen as an up-and-coming vendor who took over the number three spot from Motorola is shown to have done so with moderate-to-low profit margins.

    Overall, the phone incumbents have an unweighted average operating margin of 4.5%, down from 8.6% three years ago. In contrast, RIM and Apple have an average OM of 34%, up from 24%.  In other words, profitability has halved for the volume leaders while it has increased nearly by half for the entrants.

    This goes a long way toward explaining the "smartphone gap" which is being filled by Android. As vendors see their unit growth, ASP and operating margins under pressure from low end disruptors, there is a tendency to flee to the high end that smartphones represent. Android offers an irresistible siren's song.