Asymco

Asymmetric Intelligence

operator

  1. An interview with Kenney Ho of The Chosun Daily of Korea

    Research · 21 comments

    Kenney Ho, a staff reporter from Korean newspaper The Chosunilbo (The Chosun Daily) sent me a set of delightful questions.

    According to Kenney, The Chosunilbo "has a history of 90 years, has been the most dominant, and influential paper of all time in Korea. It is the No.1 newspaper company in Korea with more than 1.8 million circulation, firmly holding the largest market possession. The paper is recognized Asianwide, where there are many readers in Japan and China."

    -You said "All mobile device vendors experiencing losses are not likely to really recover". Even though, it wouldn't mean that the employees, executives of Nokia has completely nothing in hands for recovery. If you are the CEO of Nokia right now, What are your steps to make Nokia recover its deficits?

    My statement was based on the historic data which shows that 14 phone vendors have either exited the business or lost their independence during the last decade. No vendor that has reached a period of prolonged loss making has recovered. These are just observations and it's possible that Nokia may be the first to recover. However, going by the patterns of the past, it would be very unlikely. When I thought about the reasons why companies have not been able to recover I came to the second observation about the way phones are sold. Once a brand reaches a point where it's considered "risky" for distributors and operators to range they tend to defer purchases which leads to a spiral of continuing losses and more damage to the brand. The market amplifies "distress" and recovery becomes impossible.

    If I were the CEO of Nokia I would set course for turning the company into a new business. I would approach the market asymmetrically and not try to compete directly with the other vendors. I would look toward services, platforms and software solutions and de-emphasize hardware.

    -Many experts say that because Nokia dominated phone making industry in the 2000s, they maintained a corporate culture of complacency, which led them to decline. Do you agree with this? If you agree, Can you point out the examples of Nokia's complacency?

    Complacency would mean that Nokia would not invest or try new things. This is not quite right. The company invested in software, services and platforms. It tried many new things and had a large R&D budget. It was the leader in mobile software for many years. There was, however, a culture of arrogance about their position. This meant that they did not think the basis of competition would change. They thought they were too big to fail. They did not challenge the core business model of hardware-first and try to find an internal disruptive business.

    -Experts note that Nokia should have reacted directly to Apple's iPhone appearance at 2007. What should have Nokia have done at that time?

    The iPhone showed that software and experiences matter more than operator relationships. Nokia did a lot of research on user experiences and software but when the decision came to implement the ideas, the constraints of hardware and logistics and operator preferences took precedence and the software was compromised. What Nokia needed to do is build product around software not software around the hardware and the market.

    -Since Apple's iPhone appeared in 2007, Samsung took a Fast-follower tactics which made them successful, which Nokia could not. Do you think Fast-follower have advantage over first-mover?

    I don't consider first-mover or fast-follower to be accurate descriptions of strategy. Success follows from innovation and only from innovation. There are various forms of innovation: there is new market creation, new business models, low cost or distribution innovation. Nokia tended to create low cost innovations which opened new, low-end markets. Apple created a new market for browser-based devices and for app-based experiences. These were enabled by an ecosystem that benefited from integration.

    Samsung implemented a portfolio strategy with a large number of devices and price points which allowed them to find market niches that could be exploited. This was a distribution innovation. Each strategy has advantages and disadvantages and each strategy is usually linked to company core priorities and processes. There are times during a technology cycle when one strategy is better and another is worse. This is why companies find themselves successful and then fail. Their processes don't match the technology adoption cycle.

    For example, in the PC market there is little potential for new experiences tied to an integrated device (except for tablets) and hence there is little growth opportunity for an Apple-like approach. The innovation that matters in the PC market is mostly cost reduction. Nokia was doing cost reduction at a time when voice products were commoditizing. Cost reduction does not work when the basis of competition is new experiences and new business models. As smartphone hardware commoditizes, it's unlikely that Samsung will have an advantage unless is goes to a low-cost approach and enters into direct competition with low-end devices.

    -Can you predict the 'Big 5' in handset industry 10years from now? Many people think the list will include Apple, Samsung. Who else might be on the lists?

    There is no guarantee that Apple or Samsung will be the top vendors 10 years from now. I expect Chinese brands to become dominant in market volumes. I expect online service companies like Amazon, Baidu, Facebook to create new platforms which and have their own devices, perhaps in large volumes. I expect new input methods (like voice) to create new opportunities and perhaps new platforms and ecosystems. I expect Google may make a lot of money. One thing is for sure, being a hardware-oriented company without software and services and platforms and ecosystems is a sure path to becoming disrupted.

    -Nokia was the leading company in Finland. What are the reactions of Finland towards Nokia's downfall?

    People tend to blame each other for failures and this is the main discussion topic in Finland: who's to blame. The failure of a company is rooted in complex decision processes which usually take years to run their course. It's quite futile to lay blame on persons, especially since the same persons were celebrated for their wisdom at another point of time. At the same time as Nokia is failing however, another Finnish startup is celebrated world-wide and about to go public: Rovio, the maker of Angry Birds. It will be bigger than Nokia. Finland should make sure there are more Rovios to come.
  2. The Android Income Statement

    Research · 39 comments

    This is a continuation of the "Android Economics" series of posts. It deals with how revenues and costs are categorized for Android.

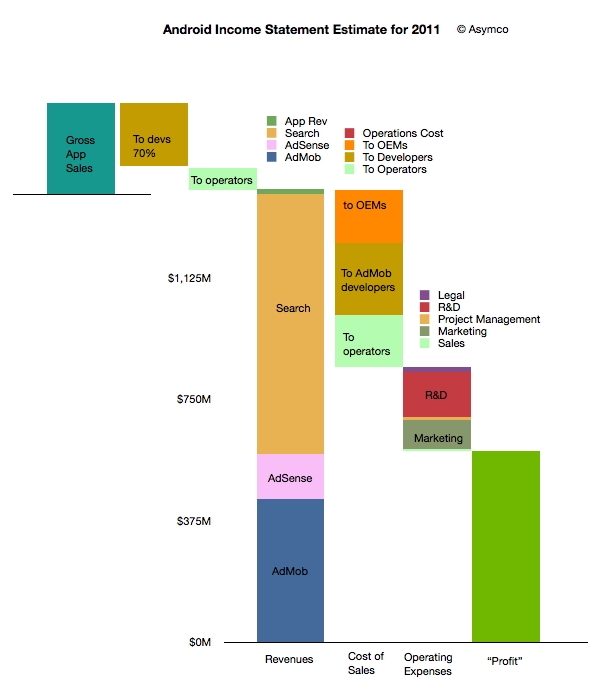
    The following diagram shows an approximate representation of what Android's "Income Statement"[1] would look like.


    I'll discuss the assumptions that are built into the model as I go along. I'll begin at the upper left and move toward the lower right in the discussion.

    The first thing to note is that sales from Google's (formerly known as Android Marketplace) Play are not registered as revenues. This is because Google, like Apple, treats itself as an agent. Agency means that the revenues don't "belong" to the agent but get passed on through to the primary beneficiaries. In the case of Play, Google passes 70% to developers (or content owners) and then distributes on average 25% to network operators (or carriers).

    I emphasize on average because there are many cases where Play transactions are not handled by or don't pass through operator billing systems. In those cases where operators are involved, it's possible that they capture more than 25%. It's not uncommon for operator billing to capture 45% of a transaction's value. The reason for this is that there is significant collection risk on billing--far more risk than on credit cards. It would also imply that on some transactions Google may be paying out more than it receives.

    This means that on average about 5% of Play content sales to be booked as revenues for Android.

    This 5% ends up a quite a small amount if overall app sales are small. We don't know the exact amount but anecdotal evidence from developers seems to indicate that they receive far more revenues from ad sales than from direct app income. Hence the size of the Android app sales is overall, modest. My estimate is that in 2011 there were about $330 million in gross app sales through the Android market. (Google estimated its sales to be 76 million for 2010 half way through that year.)

    The bulk of revenues are therefore from other sources: Search, AdSense and AdMob. I'm modeling that overall revenues are based on a "revenue per device in use" multiplied by the number of devices in use. Google has publicly stated that they are targeting $10/device/yr. in revenues. This is probably ambitious as the amount was nearly that much in early 2010 but the number of devices bought by emerging market consumers exploded. As they are not actively targeted by Google's primary customers (especially in China), the average revenue per phone is likely to be much lower. I estimated $6.5 on average for 2011.

    However, even if we use $6.5 per phone per year, the total revenues are quite strong since there were likely more than 215 million users at year end[2]. That results in a total revenue base of $1.4 billion for 2011. Removing the app revenues results in about $1.38 billion from Search and AdSense and AdMob.

    How to allocate revenues to these three businesses is mostly guesswork. I used a split of about one third to AdMob, 10% to AdSense and the rest to Search. If we assume this split then the next step is to consider how to allocate costs to these sources of revenue.

    As discussed in the introduction to this series, the primary costs of sales for Search and AdSense are network operators and OEMs or phone vendors. They are the primary "channel" which ensure the flow of search terms to Google. As Google also explains, the channel receives revenue share--so-called traffic acquisition costs (TAC).

    I used an overall allocation of 39% for TAC. Crucially, this includes the payments to developers for AdMob traffic. The rule of thumb I used was:

    • Network operators get 20% of Search
    • Developers get 50% of AdMob
    • OEMs get the rest (of the TAC)

    The resulting split is shown in the column above with the "Cost of Sales" at the bottom. There are also additional operations costs which are negligible.

    After this 39% TAC (revenue sharing), Google needs to pay its operating expenses. This includes R&D, Marketing, Sales and Legal costs for the Android division (including AdMob). You can see the approximate values in the column labeled "Operating Expenses". This operating cost amounts to about 27% of sales, with R&D at 14% and Marketing at 9%. These rather high fixed costs make sense as there is a significant development work underway for Android.

    Finally, after these costs are allocated, the remainder is the contribution of the division. This comes to about 34% of revenues which is called the operating margin. Google has to attach depreciation from data centers and other costs as well as taxes before placing this into earnings.

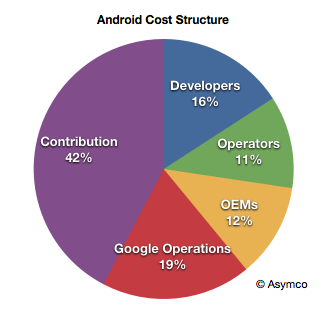
    Considering the agency structure, the overall cost structure of Android looks like this:

    When playing with the assumptions, it becomes clear that the model is most sensitive to the revenue per device and total devices in use. The profitability is entirely dependent on those figures as variable costs are a percent of sales and fixed costs are limited by talent constraints.

    For example, if revenues per device drop to $4.5/yr then the operating margin drops to 38%.

    Now we can calculate some of the more interesting figures. For example:

    • Android OEMs receive $0.76 on average per device per year
    • Android Operators receive $1.07 on average per device per year (including Play)
    • Android Developers, as a group, receive $1.94 per device per year (including Play and AdMob)
    • Google receives a contribution of $2.75 per device per year from Android

    Again, these figures are very sensitive to the revenue per device (currently assumed to be $6.5).

    Because of the number of devices involved, these cash flows are an important part of the value network of mobile computing. The next step will be to assess how they affect the incentives, alignments and competitive stance of various platforms vying for a seat at the table of the future of information.

    --

    Notes:

    1. An income statement shows the sources of revenues and the costs associated with those revenues. It also shows the fixed costs (or costs which are independent of revenues so they don't go up or down if revenues change). Finally it shows the operating income which is called contribution if it's a division within a company. This contribution is still subject to taxes and depreciation before it's recorded as earnings.
    2. I'm using Android installed base estimated based on daily activation rates as published by Google. I've discussed these estimates here. I'm using year-end estimates but subtracting retirements based on a two year device life.


  3. The phone market in 2012: a tale of two disruptions

    Research · 96 comments

    During the first quarter this year HTC, RIM and Nokia all surprised investors with bad news. The effect is evident in the share price of these companies which, in the case of RIM and Nokia is around book value, and in the case of HTC, neared 12 month lows and a 70% drop from peak.

    These "misses" in earnings and expectations are on top of the already woeful news from Sony Ericsson and Motorola, which have not had profits for years and LG, which has been borderline since late 2009.

    In combination, this seems to imply a dearth of profits in an industry that is, by all measures, booming. Units are up 7% with smartphones up 47%. Revenues are up 20% and overall profits are up 52%. This are exceptionally strong numbers. Few industries can measure growth in double digits.

    So if the industry is booming but the majority of participants in the industry are loss making (and surprisingly so) then what is going on? There are two answers: new market disruption and low end disruption.

    The new market disruption is the migration of a large number of demanding customers away from phones-as-voice-products to phones-as-computing-products. The low-end disruption is the migration of a large number of less demanding customers from branded phones to unbranded, commodity phones.

    The New Market Disruption

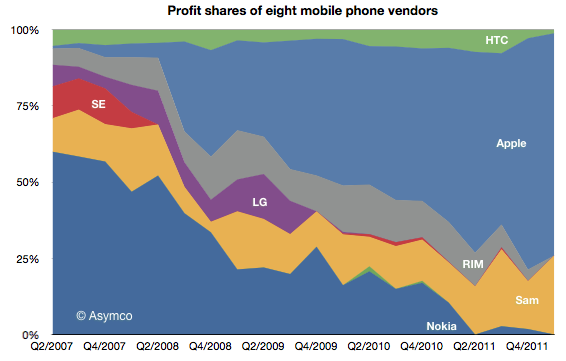
    The new market disruption is evidenced by the shift of fortunes to Apple and Samsung and away from every other device maker. Here is the profit picture:

    Of the vendors tracked (public companies who report mobile phone divisional performance), Apple obtained 73% of operating profits, Samsung 26% and HTC 1% [1][2].

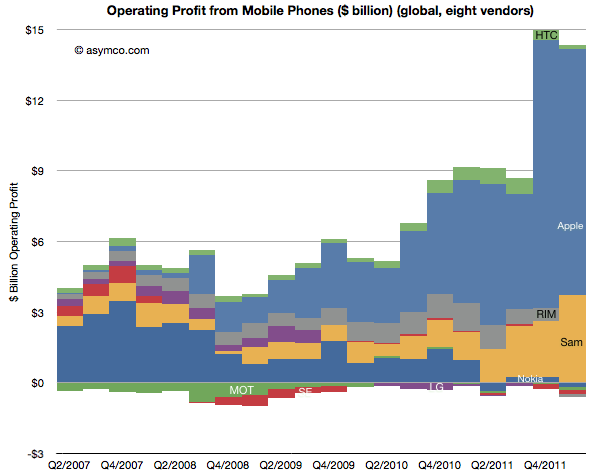
    The "share of profit" picture is potentially misleading because it could imply that the profits available are a constant. They're not. The absolute profits picture below shows how the industry actually expanded available profits by quite a lot. Two years ago the vendors generated profits of $5.3 billion in the first quarter  and last quarter they generated $14.4 billion.

    Seen this way, the story isn't so much that Apple "took the profits from the incumbents". Rather, it's that Apple created a vast new pool of profits. And one need not look far to find out where they came from: operators. These profits were mostly carrier premiums for the iPhone 4S.

    Before shedding tears for operators, consider that although this does amount to a current transfer of profits from carriers, the decision is a popular one. Hundreds of operators have made it. It's unlikely that they all colluded to be robbed. Indeed, they willingly hand over these premiums because the iPhone ensures a competitive advantage or preserves their customer base from churning. The calculations that go into a decision to range the iPhone are compelling enough that 250 operators made the decision (though, crucially, there are still 250 who have not).

    Following this value proposition to its logical conclusion would suggest that the industry is rewarding those who can supply computers-as-phones which preserve the cash flows of what is essentially a trillion dollar data services business. Vendors which cannot offer this solution saw their businesses implode. At least on the high end.

    The low end disruption

    Simultaneous with this shift of the high end to smartphones-as-app-and-service-platforms came an explosion of growth in unbranded phones. As Apple led and most brands followed the new market, the old market of voice-oriented phones was abandoned to new entrants offering cheap "good enough" phones. Nokia tried to preserve its volumes and margins there but it's becoming increasingly difficult.

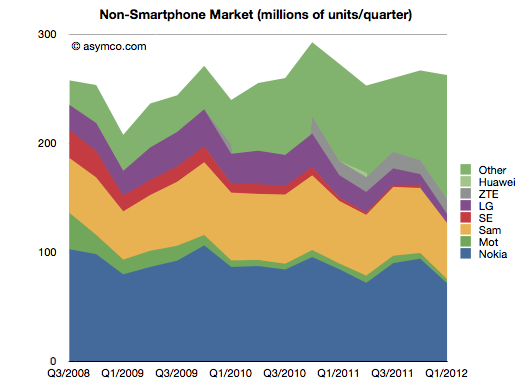
    The following chart shows how the "Other" vendors have come to make up about 44% of the market.

    Note that although this "feature phone" segment is not growing, it is still a large market (250 million units a quarter). The entrants in this market are numerous (perhaps in the thousands) and they are offering white label and unlicensed knock-off products. They are also offering unregulated (i.e. without IMEI numbers) products which are technically illegal and sold mainly in underdeveloped countries which have no incentives to enforce regulations.

    This is a consequence of feature phones reaching the point of being "good enough". The feature set and quality are adequate for voice, text, games and even media playback and are priced at $30 or less.

    This commoditization of the low end is pressuring what would normally be the fallback cushion under an underperforming smartphone business. The crisis for the incumbents comes from not only being unable to shift to the new market as fast as needed but also from not having cash flows from a low end that was thought to be sustaining.

    This combination of two disruptions is why we see an explosively large and growing market failing to reward all but two of the participants.[3]

    ---

    Notes:

    1. You can download, view and interact with a motion chart for the industry data here. All data is sourced from company filings except for some estimates where data is missing.
    2. Operating profits are sales minus cost of sales minus operational expenses attributed to the business. When not available, opex is estimated as a percent of total in proportion to sales. Note that operational income excludes taxes, depreciation and other capitalized costs.
    3. We cannot say that the thousands of low end entrants are unprofitable. They are probably enough profits to sustain them and even to attract more entrants, but we have to also recognize that there are likely to be very low margins.
  4. Segmenting the iPhone opportunity

    Research · 45 comments

    We've been very, very focused on China. China, we've had incredible success with iPhone. Over the past few years, we've gone from a few hundred million dollars of revenue in greater China, to last year $13 billion. So we really've been focused on trying to understand the market there and then taking those learnings to other markets. As it turns out--and not very many people agree with me on this, probably--but what I see is that there's a lot of commonality in what people around the world want.

    Transcript: Apple CEO Tim Cook at Goldman Sachs - Apple 2.0 - Fortune Tech

    People do want the same things globally, but due to various constraints they typically don't get the same things at the same time.

    One of the most important constraints on the purchase of iPhones is the state of 3G (or, more broadly, mobile broadband) networks. An iPhone is a mobile computer whose primary value is derived from high bandwidth data communication. Because this bandwidth is not universally available, the iPhone faces a restricted addressable market.

    The good news is that 3G networks are being adopted very quickly. The International Telecommunications Union reports that 20% of mobile users have "active subscriptions to mobile broadband" (1.2 billion out of 6 billion). That's encouraging but the subscription rate varies widely by country. Ideally we should look at the data on a country-by-country basis.

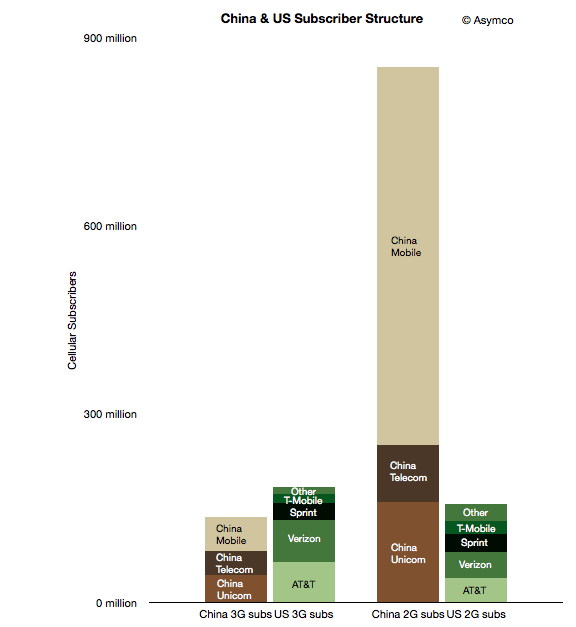
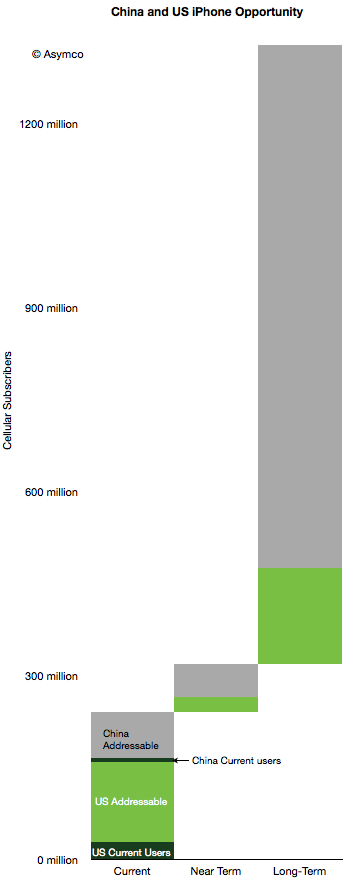
    To start, I took a look at two countries which may form an interesting sample: the US and China. The following chart shows the subscriber structure in the two countries grouped by 2G/3G subscription and by operator.

    The two left-most columns represent nominally addressable iPhone markets. The two right-most columns represent currently unaddressable markets. Note that

    although China is a far bigger market, the lower 3G penetration means that the theoretically "addressable" market for the iPhone is smaller in China than in the US (136 million vs. 183 million respectively).

    However, there are further restrictions. Apple does not have distribution agreements with many (most?) of the world's operators. In these particular countries, China Mobile, T-Mobile and "Other" US operators do not distribute the iPhone. We should subtract those operator customer bases out of the addressable market. But those conditions are variable: operators may sign up for future versions of the phone and 3G subscription rates are increasing. That means we can segment the market as follows:

    1. Currently addressable operators and 3G subscribers
    2. Potentially near term addressable users if all operators agree to distribute the iPhone in these countries
    3. Potentially longer term addressable users if all users switch to 3G and all operators distribute the iPhone.

    This segmentation leads to the following diagram.

    I also added the current users given comScore data for the US (29 million) and an estimate of 8 million Chinese users. Here are some observations:

    1. 10% of China's currently addressable market is penetrated while the US penetration is 18%.
    2. If all operators would agree to distribute the iPhone (i.e. including "Near Term" in the addressable total), the Chinese penetration would be 6% and the US 16%.
    3. If we include all users as addressable, China is about 0.8% and the US is at 8.5%.
    4. The penetration of the iPhone in the US and China combined therefore stands at about 3% today.

    The question that comes next is what is a reasonable limit to total penetration? What can we reasonably expect or what could Apple reasonably target?

    I've been using a global share of 20% as a reasonable target to test growth assumptions. Assuming no significant growth in user bases, 20% share in the long term (>5 years) yields a total of about 258 million users. That's equivalent to a 7x increase. Put another way, a 5x increase yields a market share of 14%.

    Note that these are "penetration" figures or share of available users. This is in contrast to share of units sold in a given quarter. Apple has maintained 20% share of smartphones fairly consistently. If share of units sold in any given time period remains at or above 20% and if smartphones and 3G networks become ubiquitous then reasonable men might consider these targets obtainable.

  5. iPhone sine qua non

    Research · 82 comments

    Last week I made an attempt to measure the iPhone's manufacturing cost given new data points from the Foxconn field trip. The post generated a great amount of new knowledge and the feedback was very valuable.

    The main value to me came from stepping back and looking at the entire cost and value structure for the iPhone. Putting costs into perspective is as valuable as knowing what they are.

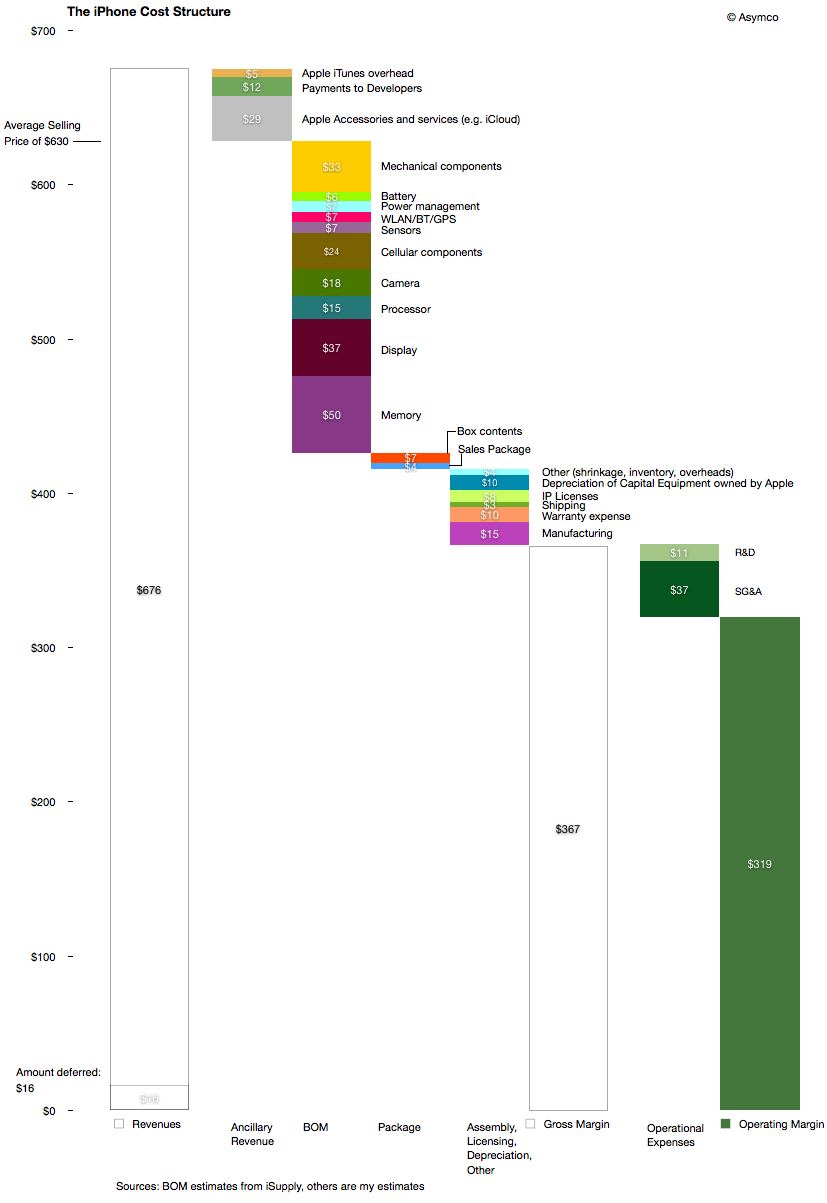
    The following diagram shows my estimates for this cost structure for the fourth quarter given both bill of materials estimates and the other parts of the cost of goods sold and operational expenses and even ancillary sources of revenue.

    Source for BOM estimate: iSupply.

    There are several observations easily made from this view:

    1. The manufacturing cost ($15 may be very generous i.e. high) but it still amounts to a tiny fraction of the device cost and hence value-add. The direct labor part of that cost is tinier still.
    2. Depreciation on capital equipment (Apple owned) amounts to $10 per device, probably higher than the direct labor cost.
    3. External developers as a group receive more app income than the salaries and costs associated with Apple's own developers working on the product.
    4. The gross margin percent is 58%.
    5. The operating margin is estimated at 51%

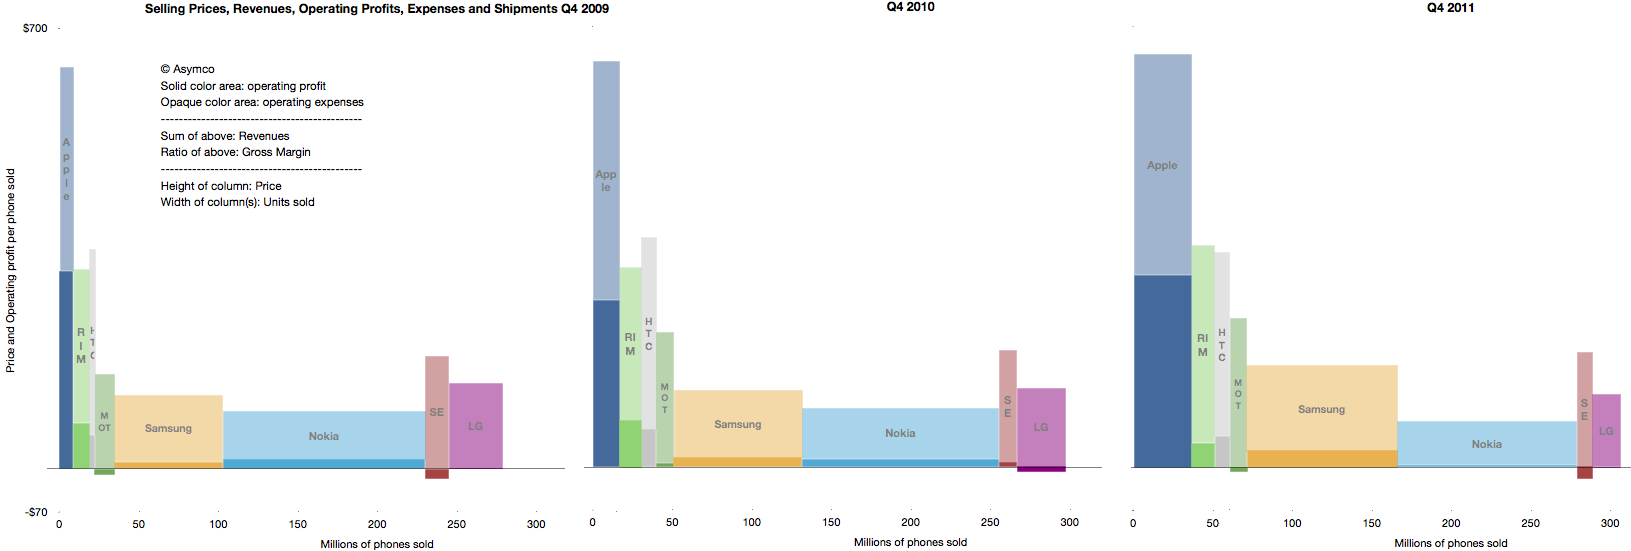
    The high margin that the product generates is even more surprising given the industry average as seen in this summary view of the industry's performance over three years' fourth quarters.

    The operating margin is the ratio of solid colors to the entire bar.

    As someone pointed out on twitter: one of these is not like the others.

    The question should be: How is this possible? What does this product have that gives it such a pricing advantage? Note the the ratio was preserved through the three years shown and has persisted for nearly five years.

    The answer to this paradox is in data that is not visible in any of the diagrams above: The largest revenue attached to the iPhone comes into the mobile network operators. We don't have global averages but the revenue the iPhone generates over its lifetime is probably two to three times the revenues that Apple directly receives. The ARPU iPhones are attached to allows for a substantial subsidy, but more importantly, loyalty (or churn)

    As seen in the small but clearly visible US market, being an operator having  iPhone exclusivity generates above-average growth and being the only operator to be excluded from the product generates above average subscriber losses.

    It quickly becomes obvious that ranging the iPhone has moved from being an advantage to not doing so becoming a serious disadvantage. The product and its high up-front costs are "hygiene factors" for operators. The sine qua non status means that it can still be priced with the extraordinary built-in margin shown above.

  6. How many iPhones are being discarded in the US?

    Research · 83 comments

    In the recently posted US Smartphone Landscape I used comScore's data to paint a picture of the growth of smartphones in general and the shape of the mobile platforms in the US. The source was survey data measuring the installed base. If we compare the installed base sequentially, we can get the increase (or decrease) of a particular platform. Comscore reports monthly but we can also summarize the data at a quarter-by-quarter basis.

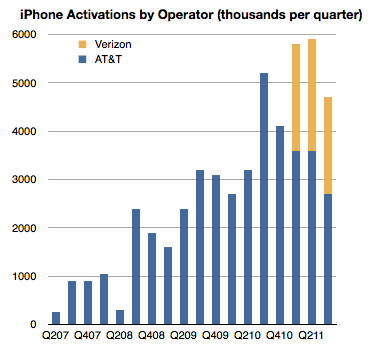
    There is another source however for the US market, at least for the iPhone: operator activations. They report iPhone activations, shown below.

    Can we use activations together with installed base data to learn something about the market? Yes, with some caveats.

    First, it should be noted that install base should account for all sorts of devices. They could be new, old or hand-me-downs or purchased used. Changes in install base would come from addition of new devices but also from devices being discarded and users leaving the platform. Activations on the other hand include units new units but also those which have been re-activated after initial sale because they were either sold or given to other users. As far as I know operators do not report "net" activations so lost users are not included.

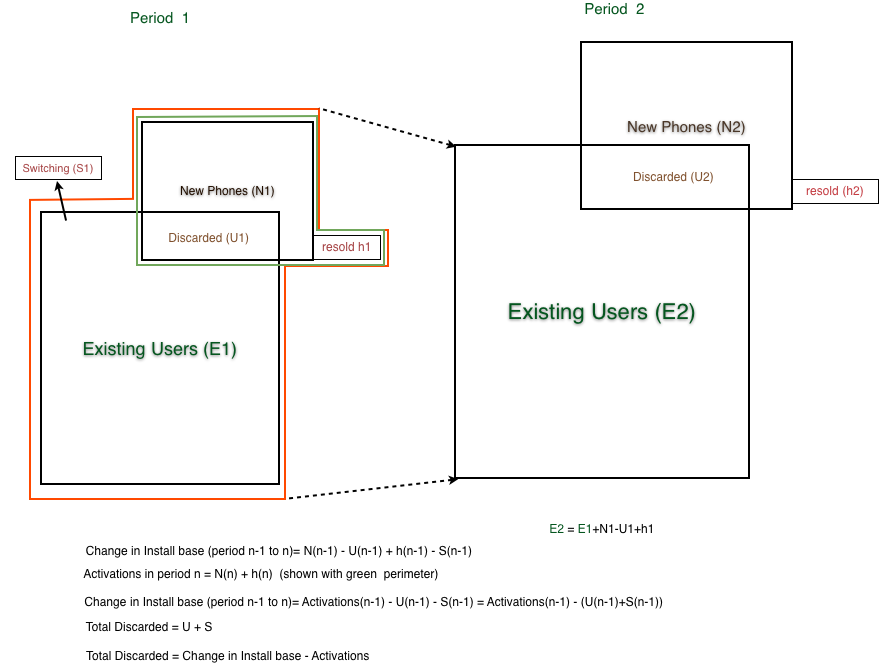
    When the formulas are combined[1], what we get is the change in installed base is equal to Activations minus "discarded" iPhone, where "discarded" are both iPhones put aside in favor of a new iPhone or put aside in favor of another phone.

    Since we have installed base change data and we have activation data we should be thus able to derive the number of iPhones being "discarded" or put out of use every quarter as the difference between activations and change in installed base.

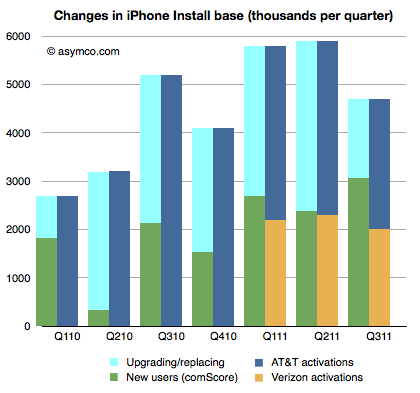
    That allows the following chart to be built:

    The green, dark blue and orange areas are given inputs and the light blue area representing discarded phones is derived.

    This is an interesting (new) piece of information. What it suggests is that at least in the US the discard rate, i.e. number of phones being discarded over number of new phones is about 50% (56% on average over seven quarters.)

    It's a rate I find surprising because I expected more of the phones to be re-used. But more surprising is that it leads to some surprising and possibly implausible behavior at AT&T.

    If you look at the last three quarters, you can see that Verizon activations are very nearly equal to the increase in install base. As all Verizon users are new, they are certainly not replacing iPhones, so the green bars next to the yellow bars imply that all those new users are Verizon users. But that means that all the activations through AT&T were to replace existing phones and that AT&T only added a bit more than one million iPhone users in nine months.

    In quarters prior to Verizon's launch, the AT&T discard rate was a modest 60% on average and after Verizon launch it went to 81%.

    What does it mean?

    ---

    Note:

    1. The following diagram shows the derivation of "discarded" units.


  7. Revolutionary User Interfaces

    Research · 226 comments

    A few years ago, around the middle of the last decade, the mobile phone market was characterized by the rivalry between a few established vendors. These were Nokia, Samsung, LG, Motorola and Sony Ericsson. These incumbent companies had a broad portfolio of devices including smartphones and feature phones and basic phones. Many also sold networking equipment and were deeply engaged with their customers, network operators.

    There was also a set of entrants who offered only smartphones.  They were quirky. HTC was a a prominent "ODM" or original design manufacturer who built phones for companies who added their brands and sold and supported the product. HTC made phones and PDAs for operator brands and for some large PC companies. It also began to sell phones under its own brand. RIM was also offering products that had evolved from pagers into email appliances with added voice capabilities. But RIM's products were not very good as phones. Voice was so poorly integrated that many people carried both a BlackBerry and a voice phone. Then there was Palm with something called a Treo which promised many things but did not quite deliver.

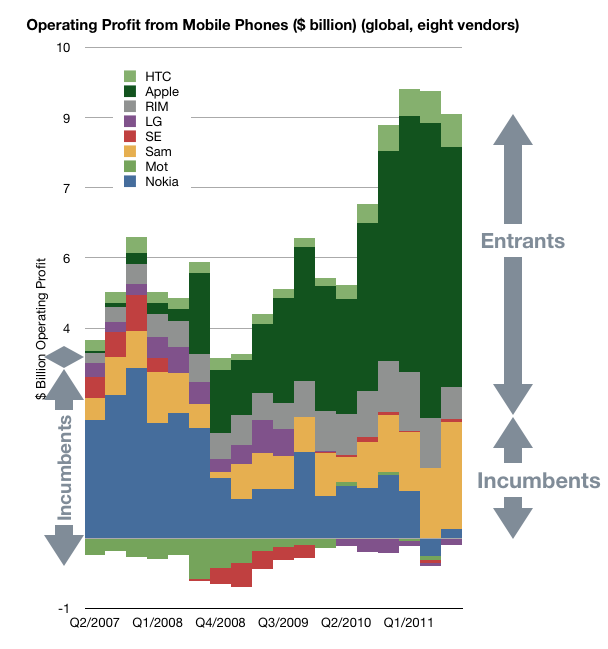
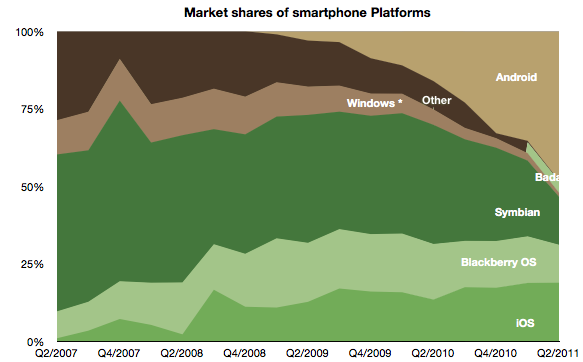
    In 2007 something happened which changed the industry. It took a few years to even realize it was happening but by the time it was obvious, it had changed to such a degree that huge companies found themselves in financial distress. This chart illustrates the effect.

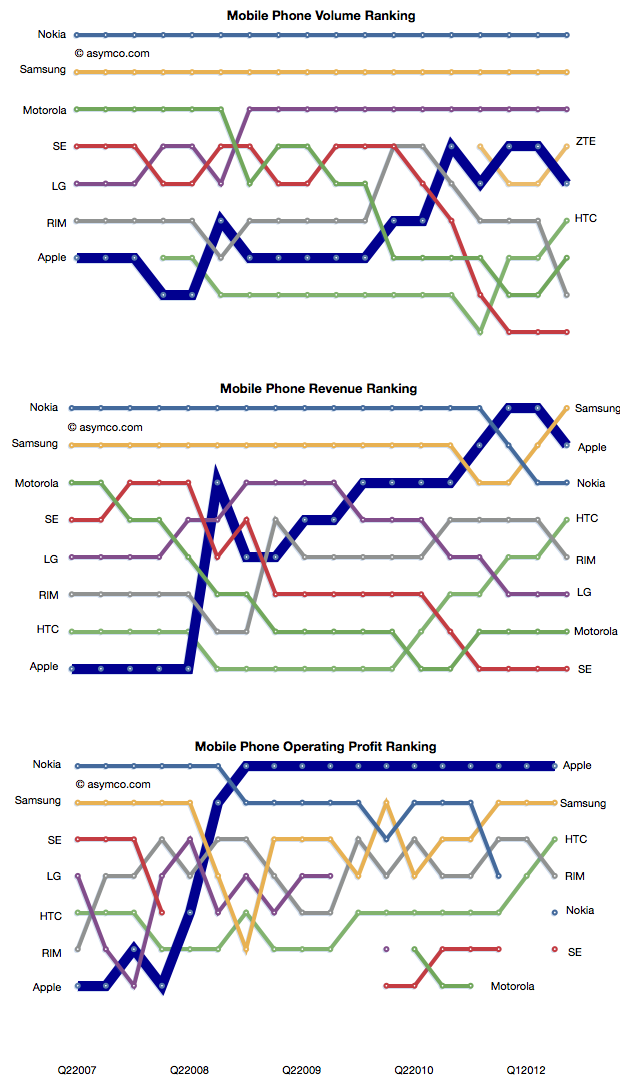
    In a few short years the rivalry between incumbent handset makers has evolved into a rivalry between mobile platforms where the incumbents were caught in an increasingly unprofitable role of hardware integrators. Motorola is now being absorbed by a search company. Sony Ericsson is being absorbed into a consumer electronics company. Nokia is going through a potentially existential crisis and even abandoned its platform. Acquisition talk surrounds LG's phone efforts. Samsung is prosperous but sill at the mercy of its software suppliers. Even the entrants are starting to feel beleaguered. RIM, the oldest pure play smartphone company is trading below book value and has regressed in value to 2004 levels. Palm evaporated. A view into the changes is the rankings of the companies in terms of volumes, sales and profit as shown below.

    How did large, powerful, smart companies let this happen?

    It happened despite having a clear, front row view of the transition of the industry from mobile voice to mobile computing. The shift in the basis of competition from "connecting people" to "connecting people to data" ended up being a classic disruptive trap. Many will argue that it was the failing of individual managers. Perhaps, but how did they conspire to fail simultaneously?

    When you see disruption happening, it's natural to seek out a cause, a pivotal magical "force" or event that enabled the weak to humble the strong--the proverbial sling that enabled David to defeat Goliath.

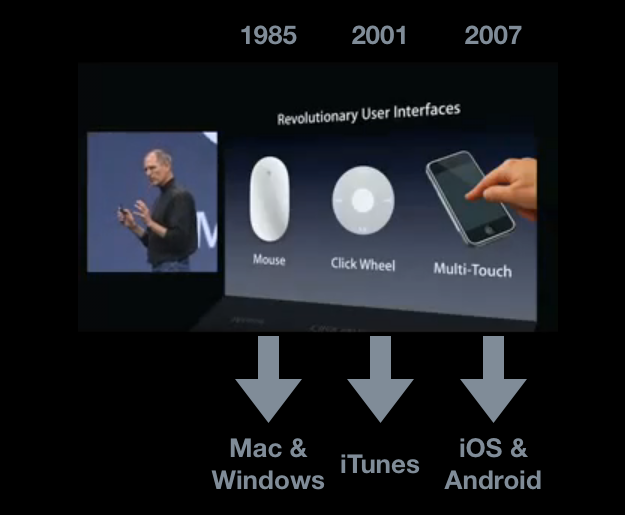
    My hypothesis is that The Primary Cause for the shift of profits from Incumbents to Entrants has been the disruptive impact of a new input method. I illustrated this with the help of the January 2007 slide presented by Steve Jobs at the launch of iPhone.

    Screen-Shot-2011-11-03-at-11-3-10.45.20-AM

    Each new input method led to not just a disruption but new platforms and new business models. Each new "sling" victimized a set of historic companies. Mainframe and minicomputers, consumer electronics giants and now telecoms.

    Just like David's sling, these technologies are not powerful in and of themselves, but rather, the way they are used makes them unpredictably sinister. The context of using capacitive touch on a handheld device rather than on a table-top makes it disruptive. Coupling it with high-speed mobile networks and powerful but efficient microprocessors made it into a force.

    That is now ancient history. The consequences and repercussions are still being felt and weighed, but the smart money should be focusing on the next shift. From the time frame in the diagram above, it's clear that the cycle time between "Revolutionary User Interfaces" is shrinking. It's been five years since multi-touch. Is the next "RUI" already here? Is Siri the next RUI?

    There are many things going for it:

    1. It's not good enough
    2. There are many smart people who are disappointed by it
    3. Competitors are dismissive
    4. It does not need a traditional, expensive smartphone to run but it uses a combination of local and cloud computing to solve the user's problem.
    5. It is, in a word, asymmetric.

    My disruptive hypothesis for Siri is that it shifts the competition from platforms positioned on a device to a "coupled" super-platform dependent on broadband and infrastructural computing.

    Just after collecting enough data and observing patterns in it that give us clarity, It looks like things are about to change all over again.


  8. Windows Phone, a year on

    Research · 103 comments

    Windows Phone is in limbo. The company acknowledged that it has performed below expectations. During the last quarter for which we have data (ending June) I have an estimate that Windows Phone sold only 1.4 million units (Gartner's sell-through analysis suggests 1.7 million). That gives Microsoft a 1.3% share of units sold (Gartner 1.6%), a new low.

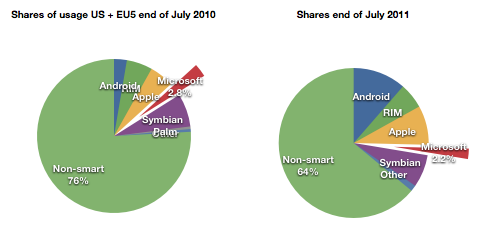
    At the same time, comScore data shows that user erosion in the US and EU5 has slowed and is holding at about 2.2% of all users.

    For its part Microsoft has lain low during the last few months. It released version 7.5 (Mango) last month to manufacturers.  It has a number of Windows Phone SKUs in the market or recently announced (27 with version 7 and eleven with version 7.5)

    It also sued Android vendors successfully and obtained royalties from the largest Android licensees Samsung and HTC. Patent royalties from Android are probably going to be higher than license revenues from Windows Phone for quite some time.

    Something is missing from this analysis. Clearly Microsoft has a plan. It's always had a plan. The plan is not easily perceived because the market Microsoft addresses itself to is not directly to the consumer--we cannot read the message. Microsoft needs to work through partners. Device vendors and operators mainly. In order to persuade them Microsoft deploys its check book.

    Put another way, the plan is that Microsoft intends to buy market share. Before we get into exactly how, we need to understand the most important but least discussed contributor to device sales: channel incentives.

    Before a phone is sold it needs to get through a mine field of obstacles: it needs to appeal to operator or distributor priorities; it needs to fill a slot in a portfolio of products for the manufacturer and the channel; it needs to acquire shelf space; it needs to appeal to some end users and, unless it has a blindingly strong brand, it needs to offer incentives to the retailer.

    This last piece of the puzzle is something of a mystery. Although not a universal practice, in many cases retail staff are paid commissions directly or indirectly by the device vendor. This relationship between the retailer and the vendor is not transparent. A buyer typically does not know what incentives are attached to a given device. Stories of salespeople steering people to and away from certain devices abound.

    Microsoft acknowledges this:

    Both Samsung and HTC Corp. have committed to increasing marketing budgets for the phones, said Andy Lees, president of Microsoft’s mobile unit, in an interview. While manufacturers will determine how the money is spent, some of it will probably go toward spurring retail staff to tout Windows Phone models, he said.

    Microsoft Phones to Get More Marketing, Sales Incentives - Bloomberg.

    In another interview:

    Q: It seems like one of the challenges is getting the salesperson in the store to push the phone.

    A: Absolutely. I think that's a number of things:

    One — they get influenced by how good the product is. The reviewers have influence with that and also their own experience.

    The second thing is the alignment with the operator. I think we're already pretty aligned and over the life of this release, we'll get even more aligned.

    Much more here: Business & Technology | Windows Phone chief Andy Lees sees time ripe for Mango | Seattle Times Newspaper.

    What's more, Microsoft and Nokia have a deal whereby at least one billion dollars from Microsoft are earmarked for the promotion of Nokia Windows Phones.

    Even prior to the launch of the Nokia relationship, with the original Windows Phone launch exactly a year ago, Microsoft made clear that it had a budget for promoting Windows Phones ($400 million in fact). In the event, the money seems to not have been spent, or spent sparingly because LG made public its disappointment. The coded language can be interpreted as a snub to Microsoft for withholding promised funds.

    Perhaps the funding was withdrawn because by the time the launch was scheduled, the Nokia deal was being negotiated. Perhaps Microsoft felt it better to put more effort behind the re-launch of the platform with Nokia on board. A re-launch which has yet to happen but seems to have already had $127 million allocated to it by Nokia alone.

    Microsoft is proud of what it has accomplished with Windows Phone because they were able to update the OS in 11 months and took only about two years to completely rebuild Windows Mobile into Windows Phone.

    But the dependence on a complex value network means that products do not reach users quickly enough and when they do the marketing message is weak, even when backed by large budgets. The real problem with Microsoft's approach is that it's neither viral like Android (because it has a price and a contract associated with it) nor is it focused and agile like Apple's. It seems to suffer from the worst aspects of modularity (market lag) without benefiting from the control over the ecosystem and end user experience that differentiates it.

    Microsoft will muddle through but the 20% share that it says is "conservative" seems anything but.

  9. The new iPhone portfolio and implications on ASP

    Research · 74 comments

    The iPhone portfolio is now larger than ever. It's arguable that, for the first time, we can actually call it a portfolio vs. the [n, n-1] pair of products that's been available to date. A year ago I even argued that the n-1 variant of iPhone was more of a cognitive illusion than a real alternative.

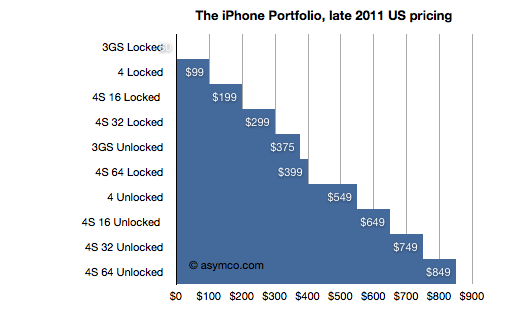
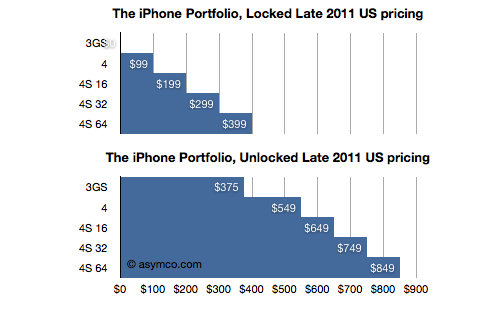
    But that all changed last week. For the first time since launch, there is a real portfolio. The iPhone is now available as five different variants with 10 different price points. Prices and options may vary by country, but I took the US portfolio as the baseline and illustrated it:

    Including all the pricing options It's a very regular pattern. It reminds me of the iPod which, at one time was sold at every $50 increment point from $50 to $500. The logic behind this pattern is that "there is now an iPhone for every budget". Of course, as with any purchase decision, each of these price points has trade-offs. Considering product performance or in terms of option value, the buyer has many things to weigh.

    To simplify, I divided the options into two subsets: Locked and Unlocked.

    We can now see the premium for unlocking (or, the discount for losing the freedom to use the phone on another network, as the case may be). We can also compare unlocked prices to unlocked prices for competing products.

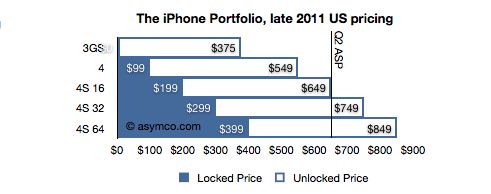
    To assess it further, I combined the two charts above into one, superimposing the unlocked price onto the locked price.

    In this last chart it becomes clear that buyers who purchase an unlocked phone are paying $450 more (the white areas), regardless of the phone's spec (except for the 3GS where the difference is only $375). For locked phones, the $450 discount is, presumably, the value of the change of carrier (GSM only) option for a buyer.

    But there is more to this picture. The unlocked price is also the price that Apple sells its product direct to consumers, many of which will be traded in secondary markets world-wide. Many will be sold in countries where Apple does not have distribution agreements with any operators. Because Apple needs to avoid channel conflict, they cannot price the unlocked product lower than they sell it to their channel. As a result, the unlocked price must be very nearly the price that operators themselves pay (excluding any volume discount).

    We can actually confirm this because Apple publishes the average selling price (ASP) that Apple obtains from the iPhone. I made a line in the last chart at the price Apple got in the last quarter.  It falls very nearly around the mid-point in the portfolio (and thus assuming the mode equals the mean and median in the distribution of sales.)

    There is one further implication in this. I think it's a safe assumption that the ASP for the new portfolio will be largely unchanged. Although Apple introduced the lower price for the 3GS ($375), it also added a more expensive 64G option. The lowering of ASP with the 3GS may be offset by the additional high-end sales, especially early on.

  10. Sprint's gamble

    Research · 62 comments

    The Wall Street Journal reported that Sprint Nextel made a "multibillion-dollar" gamble on the iPhone. This is based on information that Sprint committed to buy 30.5 million iPhones over the next four years.

    Wall Street Journal reporters calculated that the deal is worth around $20 billion on the basis of iPhone ASP during the last quarter (about $650). That Sprint would get that price is possible but not necessarily correct as there is likely to be some discount and the ASP Apple receives includes accessories.

    But the "gamble" is more than the deal value. The way it's being reported is that Sprint bet the company on being able to sell this many iPhones. So naturally we have to ask: how hard can it be to sell 31 million iPhones?

    First, note that the order is over a four year period. It's also not likely to be linear, with volumes accelerating over time. If I estimate a ramp where in year one the commitment is for 4 million, year two 6, year three 9 and year four 12 million we get a total of 31 million. Can Sprint sell this volume?

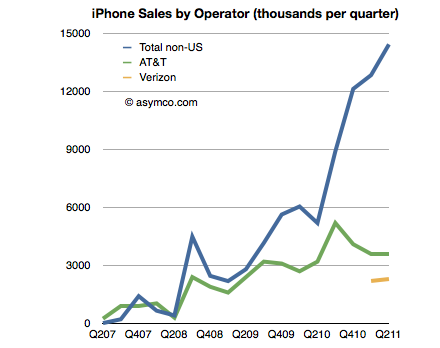
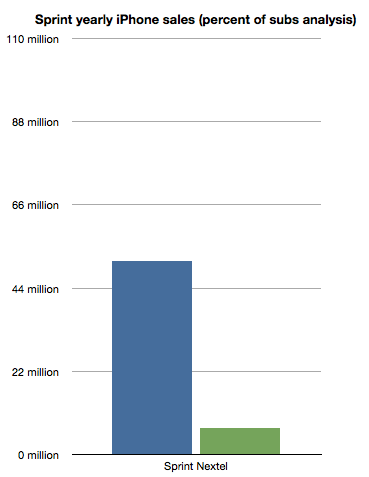
    To get an idea we can look at the sales rates for the other US operators. I built a table of iPhone sales by Operator last July. The data is shown in the following chart:

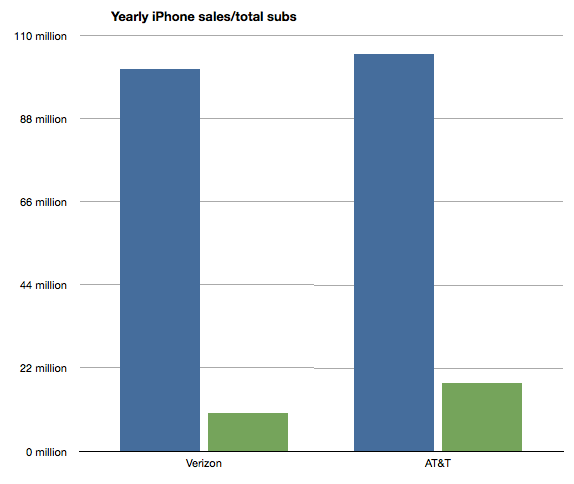
    What is interesting is to see the number of iPhones sold in a given time frame as a percent of subscriber base. I chose to measure a year's worth of iPhones where I extrapolated Verizon's volumes from the six months reported so far.

    The ratios are that Verizon sold iPhones at the rate of about "10% of its subscriber base per year". AT&T has been selling at the rate of about "17% of its subs per year". If we average these two we get about 13.6%.

    So if we assume that Sprint can sell iPhones at about the same rate as Verizon or AT&T (as a percent of their user base which was 51.1 million) we get about 7 million iPhones per year.

    That's right in the middle of the range it needs to get to 31 in four years [4,6,9,12]. I charted the projection on the following chart:

    So the gamble Sprint is taking is that they will be able to sell iPhones at the same rate as Verizon and AT&T.

    How is this risky?

    The deal seems to be inline with what is known about the product's popularity and the pattern of purchasing and upgrades that US consumers have been exhibiting for a few years.

    As with AT&T and Verizon, volumes ramp up over time. As with AT&T, users are loyal and they upgrade regularly. As with Verizon, there is competition from Android and Blackberry. As with both, payment is expected up-front with payback over the duration of contract length. As with the others, there will be incentives to keep churn down.

    If anything the riskiest thing for Sprint would have been not to do the deal at all. Indeed, we'll get to see the effect of that option on T-Mobile.

  11. The case against the Kindle as a low end tablet disruption

    Research · 232 comments

    In an Harvard Business Review post Rob Wheeler makes the case for the Kindle Fire as a disruptive innovation. I believe that it is but crucially I disagree that the Kindle Fire is a low end disruption.

    My assessment of the Kindle Fire is based on the two attributes which Amazon highlights as the key selling points which offer a basis of differentiation and potential for asymmetric competition: a low price and a new browsing model. I believe that these two attributes result in two opportunities: one for low end disruption and another of new market disruption. I reject the first and tentatively support the second.[1]

    The price

    It's immediately obvious that the price point of the Kindle Fire is well below alternatives. That forms the basis of disruptive potential, but before we jump to analyzing the disruption hypothesis we should determine whether and to what extent Amazon profits from the device directly. Profitability gives us a clue to where Amazon will apply resources and thus establish its trajectory of improvement.

    We know the margin on the Fire is low because we can calculate the bill of materials for 7" tablets. Gene Munster of Piper Jaffray estimates that Amazon "loses" $50 for each unit sold. We also know that the design Amazon used is essentially very similar to the RIM PlayBook and was sourced from the same ODM. RIM priced the product at $499 but has struggled to find buyers and is reluctantly dropping the price. We also can estimate that Apple with a product having more than twice the screen size is keeping modest (~30%) gross margins for at a price point approximately double that of the Fire. It does seem that Amazon does not have much or any margin to dip into.[2]

    So the Fire can be classified as a low price product. Does that make it a low end disruption?

    Disruption requires asymmetry but it also requires the ability to go up a trajectory of improvement along the basis of performance that a majority of users demand. The first condition is met, but what of the second? In a combined system where one asset is used to leverage another--the subsidized being sacrificed to benefit the profitable--success is conditional on one element being "good enough" while the other "needing improvement". Investment follows accordingly.

    But investment decisions have consequences. The subsidized device is starved of investment while the profitable service is nurtured. We see evidence of short cuts in investment in the off-the-shelf nature of Kindle products: from a second-hand (unsanctioned) OS to a second-hand (ex-RIM) hardware. Meanwhile, Amazon spends heavily on capex for the infrastructure that delivers the profitable content.

    If the hardware is indeed commoditized and cannot be usefully improved, then this model works. If, on the other hand, the hardware and systems software can benefit from dramatic improvements in technology then the model fails. The very asymmetry of a service vs. a product turns into the latter having all the advantages and the former failing to gain traction.

    I'll give three examples of this how service model creates limitations which lead to a failure to disrupt a product model.

    The Game Consoles

    The first is the game console business. In consoles, the vendors maintain long hardware product life-cycles to recover their hardware investment and subsidy by maximizing the number of games attached to each console. If you plot product cycles you realize that the bigger the subsidy, the longer the hardware lifecycle. The result is a very wide turning circle which prevents innovation in new dimensions.

    Consider that the Playstation or the Xbox could have been a low end computing disruption. The original Xbox was in fact a PC. It was supposed to bring PC dynamism to the console business and create a cottage industry of new developers building games on commoditized hardware. However by the second generation the Xbox was a locked down, custom architecture, pure gaming machine. Gone was Intel, gone was the PC architecture and gone was any dream of cheap development.

    This is entirely due to the economics of subsidized hardware. It compelled Microsoft, the world's greatest software company, built on the open and cheap PC architecture to make closed, expensive hardware. Sony followed in kind as did Nintendo. Each generation of consoles was a sustaining improvement on gaming and had no ambition beyond gaming[3]. The subsidy and the dependence on an integrated content value network led to a distinct lack of disruption and an insular industry which continues to seek out increasingly immersive experiences for increasingly demanding customers while itself being disrupted by casual, mobile gaming.

    The Set-top boxes

    The second example is the TV set-top box business. There again, the vendors maintain long hardware cycles in order to recover subsides. There too, the main value driver is the content and its distribution which stipulates the architecture, and through subsidy, defines its evolution. This offers the vendor no motivation to improve the user experience[4], secondary uses or the absorption of new streams of content (like those the internet can offer.)

    Again, the set-top box could have been a budding disruptive opportunity for Microsoft. They invested billions in the 1990s to acquire placement of software on set-top boxes in an attempt to penetrate the living room. And again Microsoft was not alone. Since then Tivo, Google and Apple and many others tried to attach cheap hardware to video streams. They all failed to get on a disruptive trajectory. And again, the blame can be placed on the stifling effect of subsidies and dependencies on services or content which dictate where the value and hence the investments should go.

    The Blackberry

    The third example is the RIM Blackberry. Although RIM made most of its money on hardware and was by no means subsidizing it, the differentiation of their product was undoubtedly its service value. Both as a corporate device with BES and as a consumer device with BBS, customers "hired" the product as a service. By being committed to this model RIM management became blind to the hardware and client OS software innovations coming down the pike.

    Through their own admission, they could not accept a touch screen because it would make the messaging experience too slow and it is messaging that sells Blackberries. They could not accept apps (and hence platform orchestration) as a differentiation because their customers did not hire Blackberries for "lifestyle apps". Merely being differentiated as a service leads to blindness and enough hesitation that you run off the disruptive rails.

    People ascribe myopia or incredible absence of mind to RIM's management but the opposite is true. They were deeply committed and observant of the things which made the Blackberry successful. It just happened to be something that stopped being relevant.

    The iPhone

    I'll add one more "bonus" example on this. The iPhone is also a subsidized product and it seems very successful. How come it won? The answer is in details. As I mentioned, the other products ended up in poor life cycles or incorrect motivations. The iPhone differs in that the lifecycle of the product is much shorter (2 years ownership with 1 year for product updates). The shorter lifecycle works for the iPhone because it has a very high service revenue base to dip into to offset the subsidy. Something none of the content models above could count on.

    Consider that each game console subsidy needs to paid off by a handful of game titles whose royalties to the console maker are modest. Or that the TV box needs to ride on top a service that also has thin margins from a stable or slightly shrinking user base. In contrast, the iPhone enables vast new consumption worth thousands of dollars to the operator. This is the famous ARPU uplift that smart phones enable. Users are doubling their telecom spending when they move to smartphones.

    The margins for Kindle content are thin. Very thin. Apple runs its content business at break even though it transacts billions of items per month. The amount of content that needs to pass through the Kindle ecosystem (with lower prices than Apple charges) will need to be astronomical to make it profitable on the shortened cycle time the iPhone enjoys. Thus the Kindle is likely to languish in a leisurely update cycle with users encouraged to hang on to their devices for years. This is the case at least with the original e-Ink Kindles. How eagerly awaited are new generations? How many users stampede to update the hardware or even upgrade the software? How many users have owned every version of the Kindle?

    Service Scale

    Finally one last point about services. As Amazon asserts, they see Kindle as a service, which, I concede, is asymmetric to a product business. The problem is that services don't scale as well as products. Consider that none of the content streams that Amazon will depend on are available outside the US. The Kindle has not been a strong seller internationally. This is because book rights are limited to national boundaries as are movie rights and song rights. Apple has only this week finally completed the rollout of iTunes music to all of Europe! A process that took almost a decade. And they are still unable to sell music in most of Asia and forget about movies or TV shows.[5]

    The reality is that there are no global service brands. Not in telecommunications (operators are, at best, regional), not in Media (TV, radio, publishing are a local businesses), not in Banking (not even in commercial banking) and not in Retail (even Wal-Mart was humbled trying to export its disruption). The internet has not broken down any of these boundaries and even Amazon has modest reach outside the US for any of their franchises. Services are local but products can be global.[6]

    To wrap up, this discussion on the asymmetry of device-based services to product models leads me to conclude that the Fire will not have the opportunity to disrupt the iPad or tablets in general. Amazon sees the hardware and software of a device as a commodity and the content and its distribution as valuable. This assumes that the device is "good enough" and will not require deep re-architecting or that new input methods can be easily absorbed. In short, they see the tablet as at the end of its evolutionary path. Apple sees the exact opposite. The iPad is 18 months old, and as they say in the ads, they see it as only the beginning.

    ---

    Notes:

    1. Due to length of discussion, in this post I will make the case against the low end disruptive potential and use a second post to make the case for it being a new market disruption.
    2. Presumably, Amazon will also distribute only through Amazon.com and thus not incur channel mark-ups. This means that comparisons with other tablets should be at a price nearer to 70% of retail.
    3. Gaming networks and video streaming are extensions but neither leveraged open architectures.
    4. See also discussion from June 2010 on the challenges to Apple TV that Steve Jobs enumerated.
    5. Apps are another story. Because it controls the medium, Apple can and does sell apps in every country where the iPhone or iPad or iPod touch is available.
    6. Note also that because of distribution through Amazon.com, the Kindle cannot reach as many buyers as a tablet selling through the tens of thousands of points of purchase that operators and retail shops offer.