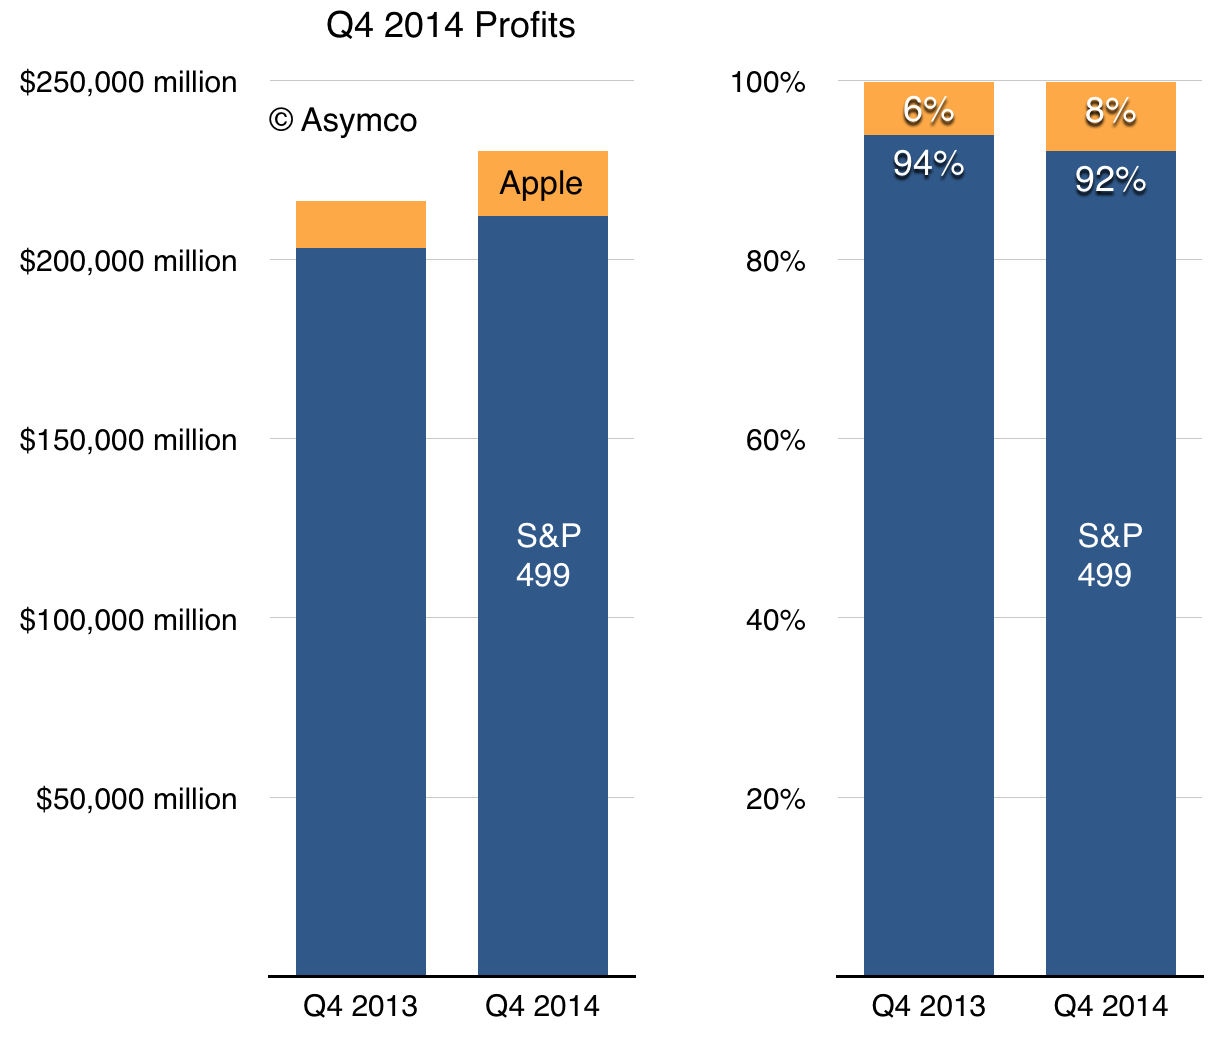
Thomson Reuters reported that excluding Apple, the entire S&P 500 grew profits at a rate of 4.4%. Including Apple the figure is 6.4%.
Using one weird trick ((Algebra)) I calculated the value of profits generated by the S&P 499 (i.e.the largest public companies excluding Apple) in Q4 2013 and Q4 2014.
Apple therefore accounted for nearly 8% of the S&P 500 in the last quarter. A year earlier Apple was a mere 6%.
It should therefore be obvious why Apple's P/E ratio is 16.1 while the S&P 499 P/E ratio is 19.8.
Amazon's recent disputes with publishers (Hachette and Disney) shows a degree of market power that is closer to monopsony than to monopoly but this power is nevertheless real. It may not not be something that requires intervention, regulation or even scrutiny but market power is evident in both how companies operate and in how they are valued.
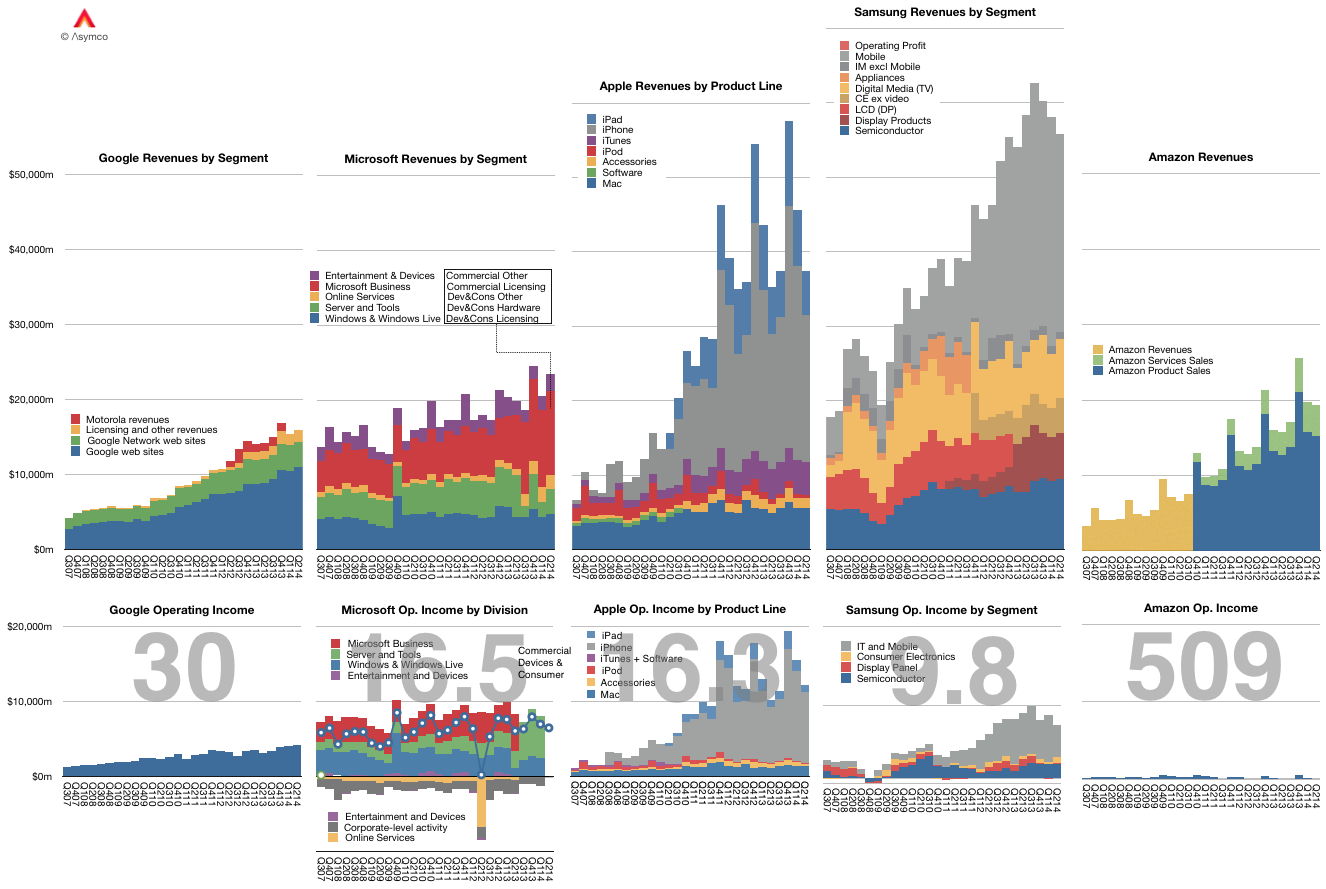
If you look at the following graph, it's easy to spot those with "monopoly" power. The graph shows a short history of revenues/operating income and P/E ratios. Modest or no growth in earnings coupled with extraordinary high P/E ratios indicate that the market understands the business is not threatened by competition.
In contrast, "beleaguered" companies include those with great sales growth but no perceived long term prospects. This perception is evidenced by a low P/E ratio. It indicates how long the company can maintain its present level of profitability. I've highlighted Apple's continuing, and indeed perpetual, beleaguered state. Excluding its existing capital base, Apple rarely gets votes for a life span longer than 10 years. One can see the same status in many Asian companies. Samsung is even more beleaguered than Apple by this measure.
The underlying implication is axiomatic as far as investments are concerned.: Being under threat all the time is undesirable.
But is this true?
One of the issues with monopoly/monopsony is that it leads to business practices and strategic priorities that are tainted by hubris. In contrast, the stress of competition leads to "paranoia" and to a sense of urgency which is blessed by innovative insight.
This is a corollary of Grove's "only the paranoid survive" or Jobs' rant on why Microsoft was unable to come up with breakthroughs. Grove and Jobs looked at dominance of a market (as either buyer or seller) and saw a curse. Their understanding of the human condition went beyond what the arithmetic of markets would suggest. Running a business and managing people who are asked to create things leads to this insight. Peering at spreadsheets doesn't.
The observation to be made is that those who invest in companies haven't caught on.
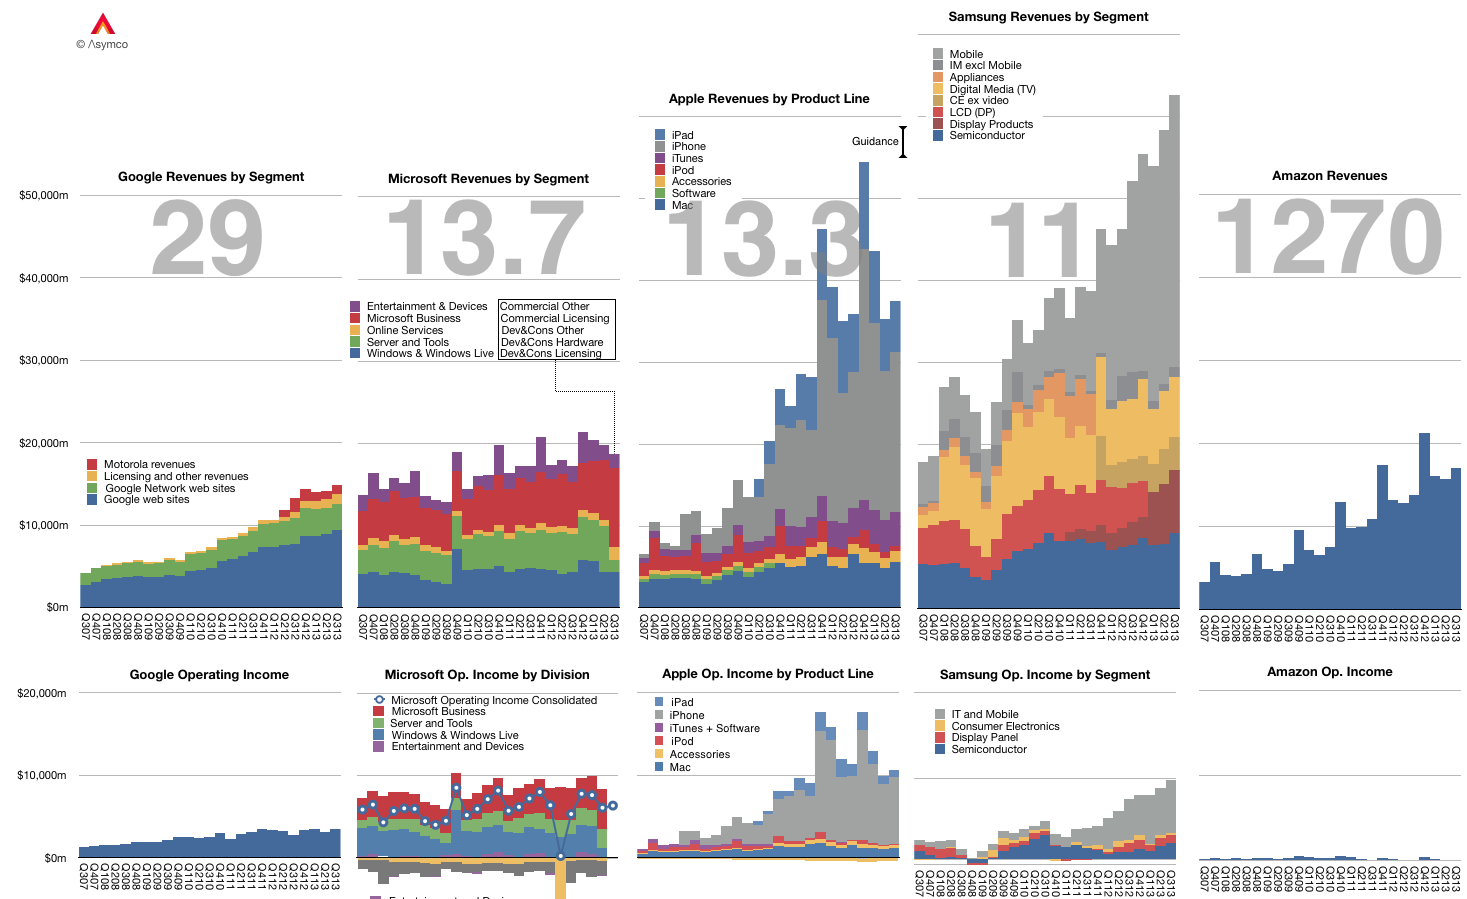
The graph below shows the Revenue and Operating Income for a select group of companies. The large numbers represent the share price to earnings (trailing twelve months) ratio (P/E or PE ratio).
Of course the P/E ratio hides a lot of subtlety. It mostly fails to account for the fact that earnings are largely a matter of opinion. A company can defer income (as Apple and Microsoft do), it can invest earnings (as Amazon does) and can otherwise avoid declaring it since it's taxable.
A better measure is the Enterprise Value to Free Cash Flow ratio (EV/FCF). It reflects a "harder" measure of performance in the form of free cash flow. It is not a matter of opinion but a fact. Enterprise Value also excludes cash which is a measure of past performance.
Nominally both P/E and EV/FCF measure the valuation of a company. They give what amounts to the number of years that current performance can be expected to last. For example a P/E or EV/FCF of 10 can be read as "If I purchase a share today, I should expect the company to pay me back in earnings in 10 years." Any earnings after 10 years are essentially "profit" for the investor.
Inverted these ratios are a measure of Yield or how much of the total investment is paid back in a given year. In the example above, the Yield would be 10% or "If I purchase a share today, the company will pay me back 10% a year in earnings."
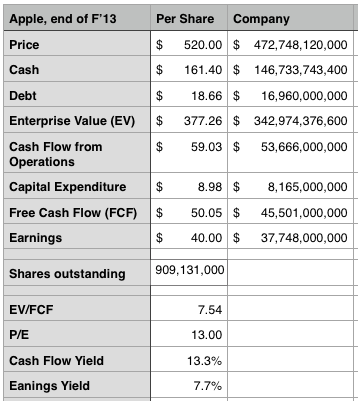
Relying on P/E is troublesome since, as mentioned above, it's deceptive. We get into difficulty when P/E and EV/FCF differ greatly. If a company has minimal cash and declares all free cash flow as earnings then the ratios are the same. However, consider how different these two ratios are for Apple:
The P/E ratio is 13 while the EV/FCF is 7.5. ((It would be very interesting to have both ratios available for all the companies in the graph above.))
This means the investment horizon is nearly half of what P/E suggests. (The cash flow yield should give pause). Put another way, the market suggests that Apple has 7 more years of current profitability and not 13. Note that the P/E ratio for the S&P 500 is above 19.
As Apple's deferrals are increasing investors should look again at what the company's worth. We had similar confusion when the company was deferring most of its iPhone revenue.
In the Innovator's Curse I reflected on the fact that a serial innovator cannot be efficiently financed or even rewarded for having figured out how to repeatably create. If anything, a serial innovator has to suffer a discount to peers who do not habitually (or ever) innovate. The innovation process is the proverbial goose that lays the golden eggs but is destined to perish due to the lack of faith in its existence.
So how can I back this up?
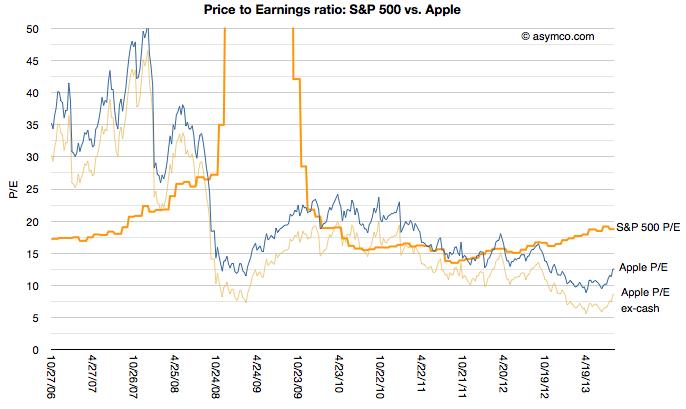
To start, this is partially evidenced in this graph of Apple's price to earnings ratio since 2006 vs. the S&P 500's. The S&P reflects the 500 largest companies in the US and is thus a proxy for the "average" company.
[I added Apple's P/E excluding cash for additional perspective.]
The graph shows that during the period of time when iPhone and iPad changed computing and telecommunications, Apple was mostly held in contempt: the profits it was generating were not considered of "sufficient quality" relative to an average company. Since markets look forward, not backward (one assumes), the vote cast is decidedly that success cannot be repeated. Put another way: you can trust that a soft drink maker like Coca Cola (P/E of 19) or a utility like ConEd (P/E of 18) will continue in the manner we've seen them perform in the last year more than Apple (P/E of 12) will.
I can offer yet another way to consider this curse. Apple's iOS business is designed to capture profits through the sale of hardware. That hardware is manufactured through a process where, while not being the manufacturer, Apple purchases tooling in a capital-intesive strategy to control the means of production. I've discussed this at length before.
But Apple's business is more complex than just enabling manufacturing. Tooling allows for production and production allows for supply but supply is nothing without demand. And demand of the product is driven by investments in software and services and design and marketing and countless details.
In other words, for Apple's modus operandi, if anything should correlate with value it's opex, not capex. It's the investment in the people Apple employs not in the tools it buys.
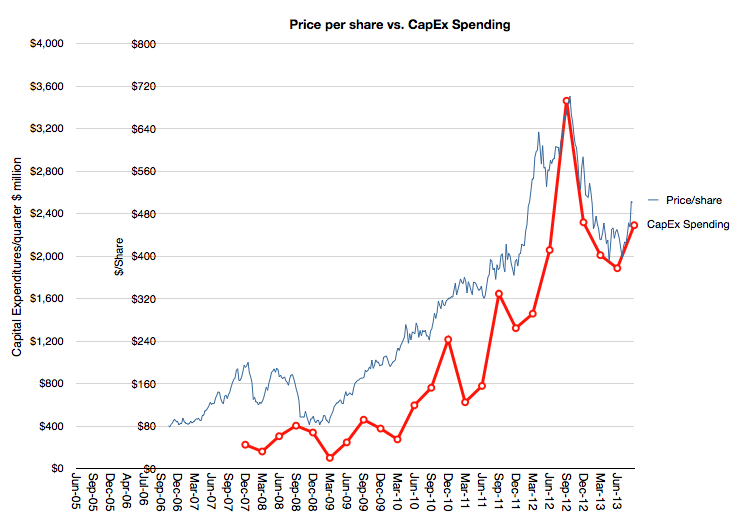
And yet consider this graph:
It shows how the market (though its pricing of Apple shares) values the company overlaid with a Apple's spending on capital equipment (PP&E capex).
The relationship is uncanny. I'm not suggesting causality—that capex (which is publicly pre-announced) determines the share price level—but I am suggesting that there is a valuing of Apple as a producer of goods (for which tooling is a handy proxy). There is no sophistication to this formula. The more iPhones are built, the more the company is valued. Obvious.[1]
But it's not obvious that prior to the iPhone there was iPod, which was a different business (and prior to it was the Mac, ditto.) The stock did not reflect the transitions nor does it assume that anything else will follow. It is, in other words, looking backward, not forward.
--
Notes:
One could suggest looking at CapEx months in advance and predict the stock price, but who would believe such an absurd idea?
The Price/Earnings ratio is a very simple measure of the "value" a company has. The Price is the current share price and the Earnings is usually the sum of the last 12 months' earnings per share. In other words it measures how many of the last year's earnings are built into the share price. Put yet another way it's the answer to the question "If earnings don't change, how many years will I have to wait before I'm paid back for my share purchase with retained earnings."
So a company with a P/E of 10 implies that if nothing changes, in 10 years a share owner would "earn" back the price they paid for the share. Any earnings after 10 years would be "profit" for the share owner. You can imagine it even more simply as buying not shares but an actual small business of your own. You pay up front for it and then wait until it pays you back. After getting paid back for the initial purchase you then make money that you can set aside.
Obviously this figure of P/E is very sensitive to growth in earnings. Consider paying $100 for a share of a company having just earned $10/share last year. It would have a P/E of 10. If earnings stayed at $10/yr for 10 years, you'd "get your money back" in 10 years. However if earnings grow at 20% then next year the earnings would be $12 then 14.4 then 17.3 then 20.7 etc. Adding these up means you'd get your $100 back in five years, not 10.
So with a company growing at 20% the "realized P/E" is 5. You realized the price of $100 in five years' worth of earnings. In the scenario above you paid expecting to wait 10 years but you got paid in five. If that's your retirement plan then you can retire five years early. Not bad.
Let's then look at what Apple gave investors as "realized P/E."
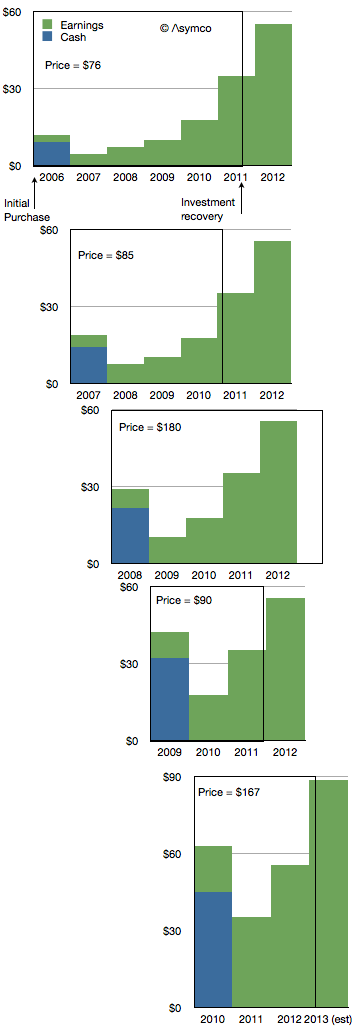
If you bought shares in the first Friday of 2006 you would have paid $76.3/share. At the time the company had $9.36 in cash so you actually paid $66.94 for any future earnings. The P/E ratio at the time was around 35.
The company went on to earn $2.78 in 2006. Another $4.63 in 2007, $7.47 in 2008 and 10.24 in 2009 and 17.91 in 2010. Then in 2011 it earned $35.11.
If you add these values up you realize that Apple reached your price about two thirds of the way into 2011. So the company earned your purchase price in 5.7 years. That becomes the realized P/E if you bought in early 2006. The following diagram shows the time period as a box encompassing the earnings (and cash) for a share purchase in early 2006.
I repeated this for purchase in early 2007. The result is a Realized P/E of 4.9. I did it for 2008 as well[1] and got 5.4 then 2009 yielded an astonishing 2.9. 2010 was not much different with 3.2.
Investing in Apple between 2006 to 2010 meant obtaining a payback period of less than 4.5 years, on average. In other words, regardless of what the trailing or forward P/Es getting quoted at the time (trailing is illustrated below), buyers actually paid for only about 4.5 years of earnings. In other words they actually bought Apple for a P/E of about 4.5.
Using our small business analogy, buying Apple in the past few years has meant getting paid back in less than five years. That makes it a very low risk opportunity.
I could try to repeat the process for years 2010 onward but it would require making forecasts beyond 2013, something I leave as an exercise to the reader.
---
Notes:
I had to make assumptions about full year 2012 and 2013 earnings. I used $55.4 earnings for full calendar year 2012 and 60% growth for 2013.
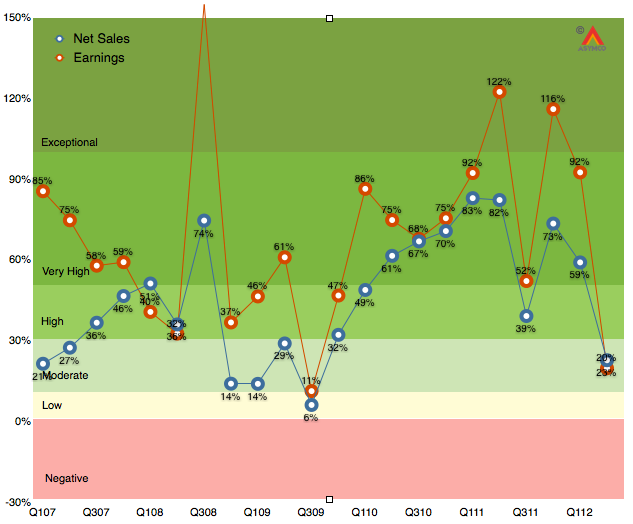
As the chart below shows, the last quarter (second calendar 2012, third fiscal 2012) was disappointingly moderate with 20% earnings growth and 23% net sales growth.
It was the first quarter since the iPhone launched that earnings growth has fallen into moderate (below 30%) territory. Much of that disappointment (to me) was the relatively low performance of the iPad following a launch quarter. The iPhone was weak as well, though that was expected. As I said last quarter, the iPhone is still the most important component but the iPad is becoming increasingly decisive in overall performance. In fact, I’m projecting that the iPad will have the same revenues as the iPhone had one year earlier.
The iPhone is going to be extremely difficult to project. On one hand we have the launch of the i5 which will account for about 10 million units in the quarter, on the other, chances are that sales were very weak prior to the launch as purchases were being deferred even more than during the last quarter.
So with these very meager clues, here are my estimates for the quarter (with y/y growth in parentheses):
iPhone units: 27.8 million (62%)
Macs: 5.6 million (15%)
iPads: 18.8 million (69%)
iPods: 5.6 million (-15%)
Music (incl. app) rev. growth: 40%
Peripherals rev. growth: 10%
Software rev. growth: 15%
Total revenues: $39.5 billion (40%)
GM: 42%
EPS: $9.75 (38%)
This earnings value would imply a trailing twelve months’ EPS of about $45.2. At the current price of $697/share the P/E would be 15.4. Cash and equivalents will probably increase to $125 billion or $131/share. Excluding cash, the P/E would be 12.5.
[Update. The EPS figure above includes a tax rate estimate of 30%. Company guidance was 25.5%. Using the company's guidance yields an EPS of 10.43. TTM EPS becomes $45.9/share and at $697 the PE is 15.2. At time of this update the share price has fallen to $665 and thus the pro-forma trailing P/E ratio is 14.5).]
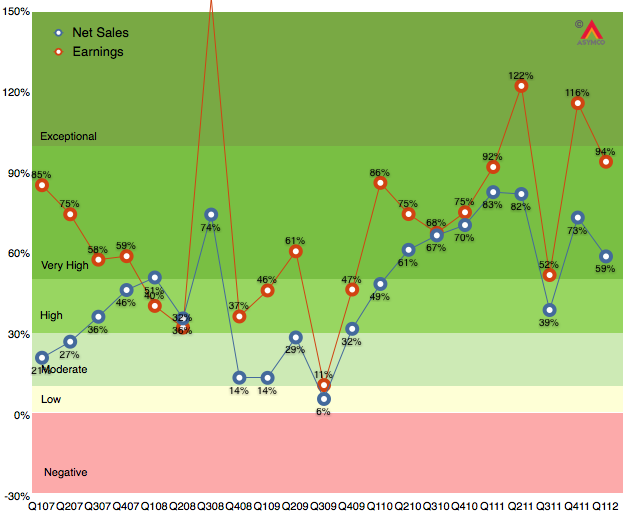
As the chart below shows, the last quarter (first calendar 2012, second fiscal 2012) was robust with 94% earnings growth and 59% net sales growth. Subject to the usual superlatives, the performance was, again, unexpected by many.
Much of that surprise was due to the underestimation of iPhone sales in China during what is a holiday quarter in that nation. Growth this quarter will be more difficult to estimate. The iPhone is still the most important component but the iPad is becoming increasingly decisive in overall performance. In fact, I'm projecting that the iPad will have the equivalent of 73% of the iPhone revenues this quarter.
In this quarter the iPhone is reaching a late stage in its launch cycle but it continues to reach more points of purchase through distribution agreements and it also has a "portfolio" in terms of multiple price points and models available.
The iPad was supply constrained last quarter and may be in balance this quarter. Management has very clearly and repeatedly signaled that the iPad will have a very strong quarter.
So with these clues, here are my estimates for the quarter (with y/y growth in parentheses):
iPhone units: 28.5 million (40%)
Macs: 4.5 million (15%)
iPads: 24 million (160%)
iPods: 6 million (-20%)
Music (incl. app) rev. growth: 35%
Peripherals rev. growth: 20%
Software rev. growth: 15%
Total revenues: $41.9 billion (46%)
GM: 44.8%
EPS: $11.54 (48%)
This earnings value would imply a trailing twelve months’ EPS of about $44.8. At the current price of $571/share the P/E would be 12.7[1]. Cash and equivalents will probably increase to $118 billion.
---
Apple's P/E also dropped to 12.7 around Christmas 2008. I did a search for some headlines to recall that time and came across one that seems appropriate: "Unrest Caused By Bad Economy May Require [domestic] Military Action, Says US Report".
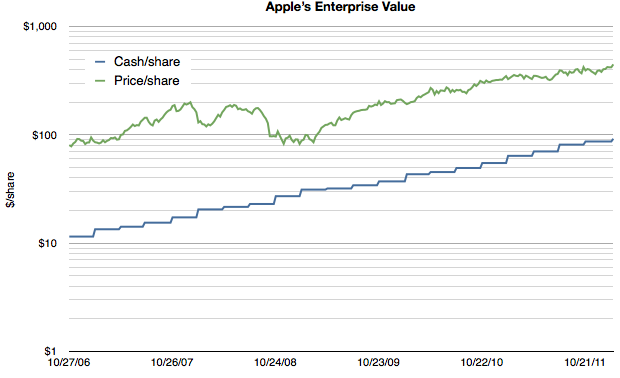
As Apple's extraordinarily low valuation is being more widely noted, explanatory hypotheses are proliferating. Everyone seems to have an opinion. Some explanations come in and out of fashion. Others are reliable old clichés. We've seen liquidity issues with large funds forced to sell, "too much cash", management transitions, an impending loss of mojo, share price too high to afford, "law of large numbers", and that old chestnut, competition. None of these satisfy. They don't explain why reliable growth is not valuable. And reliability is indeed what Apple offers in spades. Consider the following chart:
Note that the scale is logarithmic so that the growth patterns can be seen clearly.
It shows Apple's cash/share vs its price per share. First, it should be noted that the company's cash has been growing reliably on a log scale, increasing by a factor of 10 in five years. As a proxy for retained earnings, the cash trajectory shows exceptionally predictable earnings.
Second, although the share price has grown it has not grown either as reliably or as quickly. It's as if the reward for reliable earnings is a significant dissent.
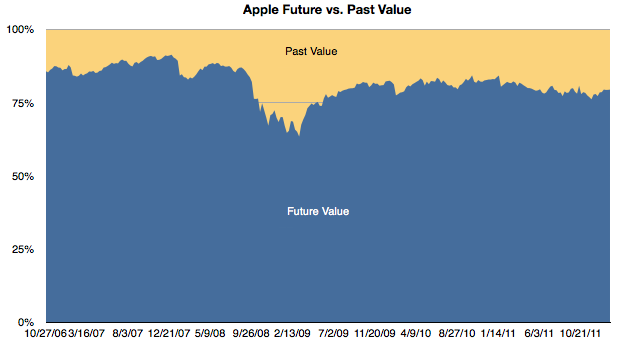
Third, if we subtract the cash/share from the price/share we obtain the enterprise value (EV) per share. The EV reflects the future value built into the price. It reflects the expectation of more earnings. In the chart above one can see the shrinking of the gap as a multiple of the cash value. To bring that gap into focus, I prepared this chart showing the percent of the share price allocated to past value (cash) and future value (EV).
One can see the gradual erosion of emphasis of future value. With the exception of the credit crisis induced equities crash, future value as a percent of total value is at a new low. In late 2006 the future was was about 86% of the share price. At the end of last week it had dropped to 79%.
Another way to interpret this is that in 2007 when the iPhone was born nearly 90% of the business value was thought to be in its future. Today only 80% is future value.
To clarify further, if a company reaches a price where 100% of its value is cash then it's seen as having no future value. Having any significant portion of the price attached to the past is extremely rare for a growing company and I would say unheard of in a company growing as rapidly as Apple is.
This preoccupation with the past and discomfort with the future is, I believe, the key to understanding the valuation paradox for Apple. I have gone over the conventional metrics of P/E and P/E/G(trailing) that illustrate absurd pricing (updated below). But they don't help explain the mis-pricing.
A disruptive company is inherently unpredictable. Success and growth are unrewarded because there no understanding of the underlying causes of these phenomena and therefore there is no expectation of repetition.
In other words, a five year dead-straight line of logarithmic growth is not a sign of anything resembling reliability if the underlying causes are not understood. Today Apple is still a mystery wrapped in an enigma and without a causal understanding of its suceess its pricing will remain paradoxical.
In last week's discussion of Apple's (historically low) valuation, comments arose that perhaps the company's discount is not unique. Can we look at comparable companies and determine whether the relationship between growth, size and valuation are consistent?
The challenge is in finding "comparable" companies. Apple is characterized by being large in terms of market capitalization, highly profitable, in the technology sector and growing relatively quickly. One can find a cohort of companies with each of these characteristics but not all.
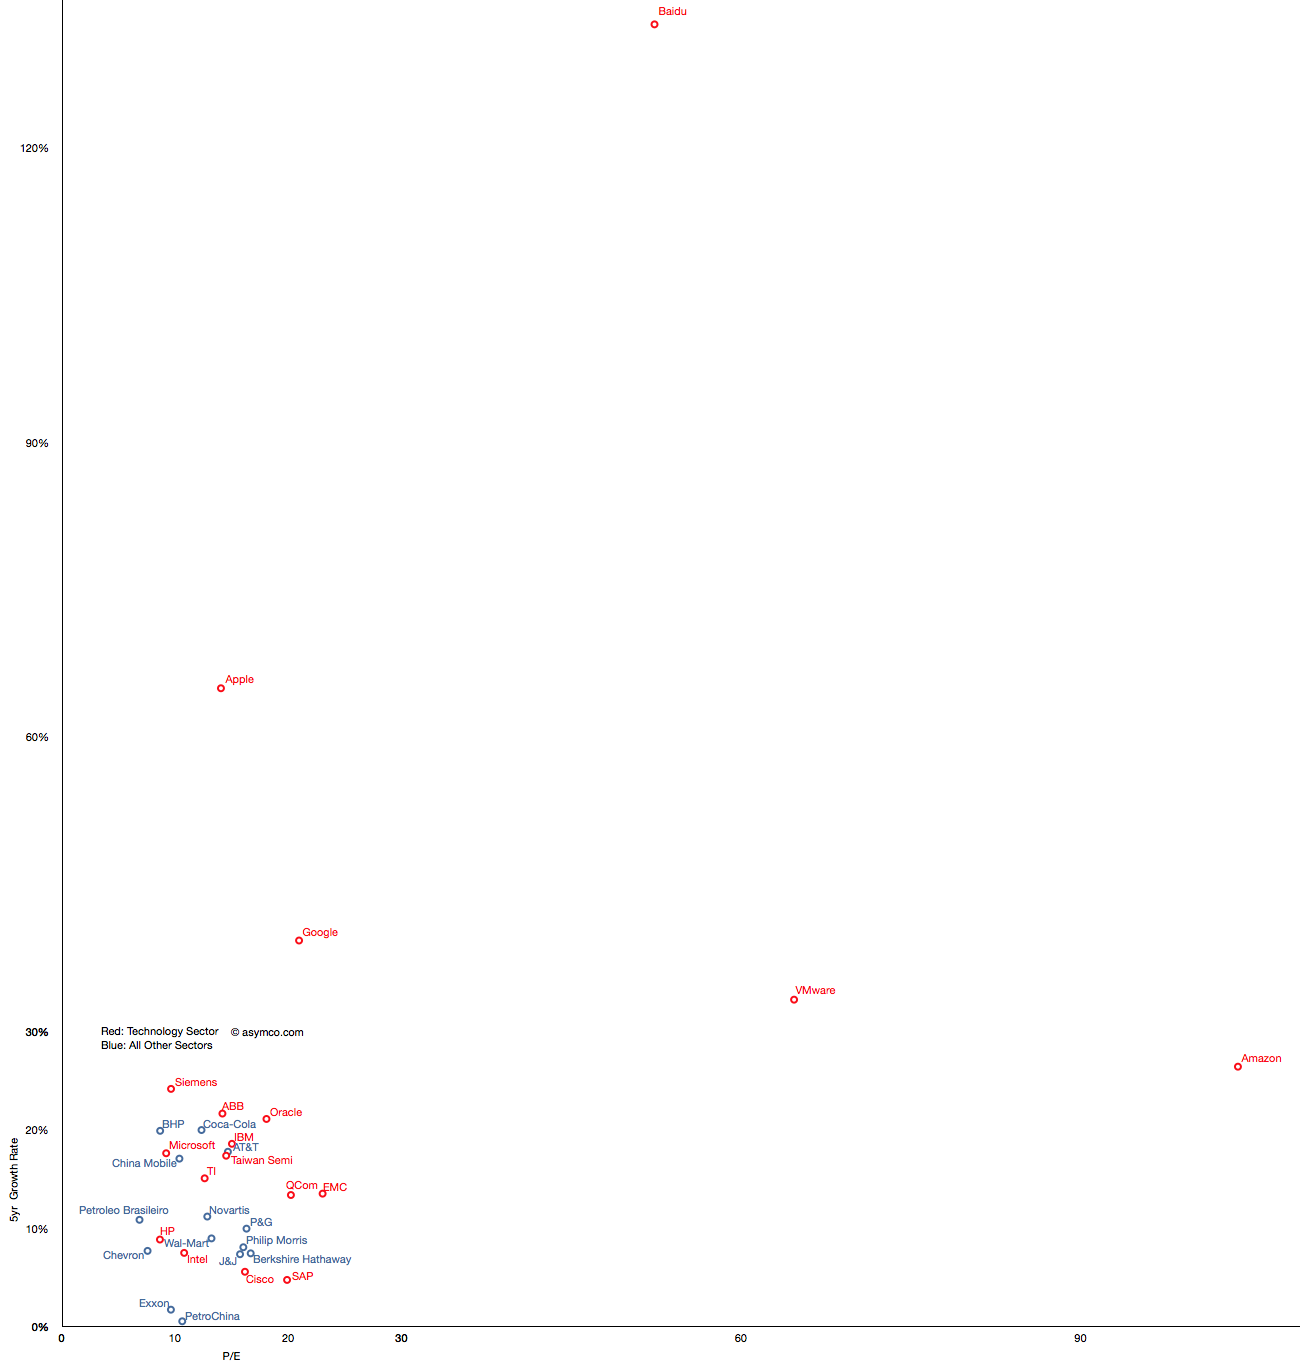
Here is an attempt at looking at the largest companies by Market Capitalization (the so-called Mega-caps) to spot patterns of valuation. Some of the companies in the top 20 mega-caps were technology companies so I thought I'd highlight them. I then also added a few of the top 20 technology companies by capitalization to create a larger sample.
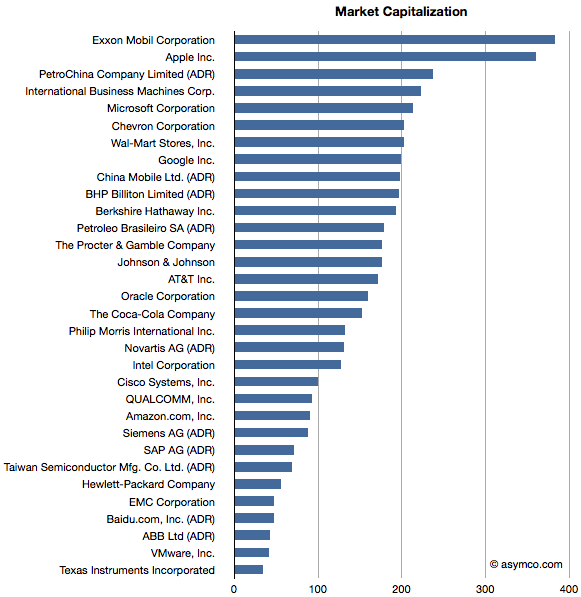
The group I settled on is shown in the list below ranked by market cap.
Companies below $130 Billion in market cap (i.e. below Novartis) are in the top 20 technology list but not in the top 20 overall list.
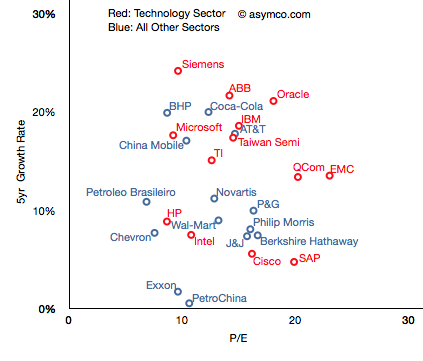
I then plotted the P/E rate vs. 5 year Growth Rate for these companies, separating the tech sector by color (Red):
The pattern is not encouraging. It appears that there is no correlation. Perhaps the technology companies are, as a group, further up and to the right, but overall they are equally unobservant of growth.
For example, SAP has grown less than 5% in five years and yet enjoys a P/E of 20 whereas Microsoft has grown 18% and has a P/E of less than 10. The non-technology sector companies are similarly broken. Berkshire Hathaway, a conglomerate, is rewarded for slow growth and China Mobile is punished for relative high growth.
But you'll notice that some companies are not on this chart. That's because they are outliers. Their growth or P/E are so far out of this cluster that the would make it impossible to discern individual performance. The complete "top 20" picture is shown in the following chart which will require either a large display or a lot of scrolling (1300x1364 pixels):
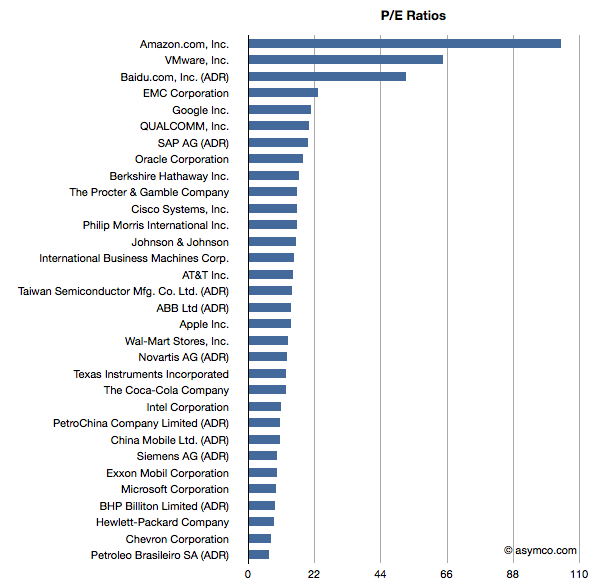
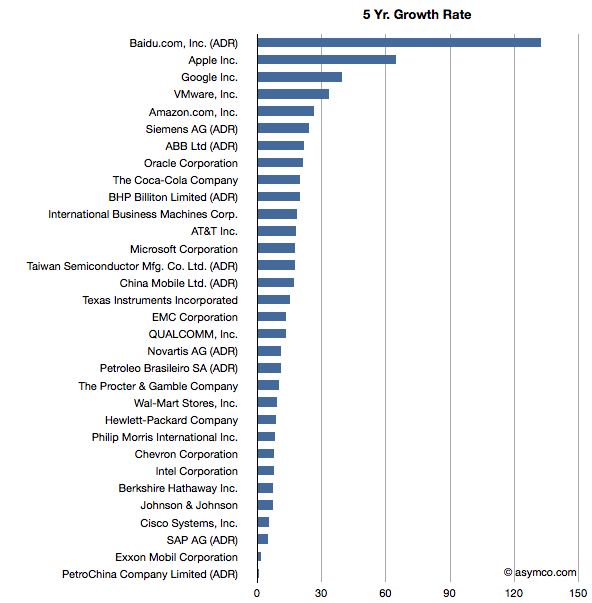
With this level of detail, we can see how distinct some companies are. Not only from a correlation point of view but from a cluster of peers. The outliers are Amazon, Baidu, VMware, Google and Apple.
These outliers can be seen also in ranking of P/E and Growth:
Baidu has grown earnings by 132 percent while creating a market cap of $47 billion and has a P/E of 52. Amazon has grown by 26% while having a total value of $90 billion and a P/E of 104. VMware is "only" a $40 billion market cap company with a 5yr EPS growth of 33% and a P/E of 64. Finally, Google has returned a 39% growth rate, a market cap of about $200 billion and a P/E of 21 and Apple brings up the rear of P/E with 14 but with the second largest market cap of $360 billion and the second largest growth of 65%.
What this analysis shows is that the market does not have any "rule" of rewarding growth with a high P/E. If anything, the outlier analysis shows that there are significant anomalous valuations that cannot be explained by growth data.
---
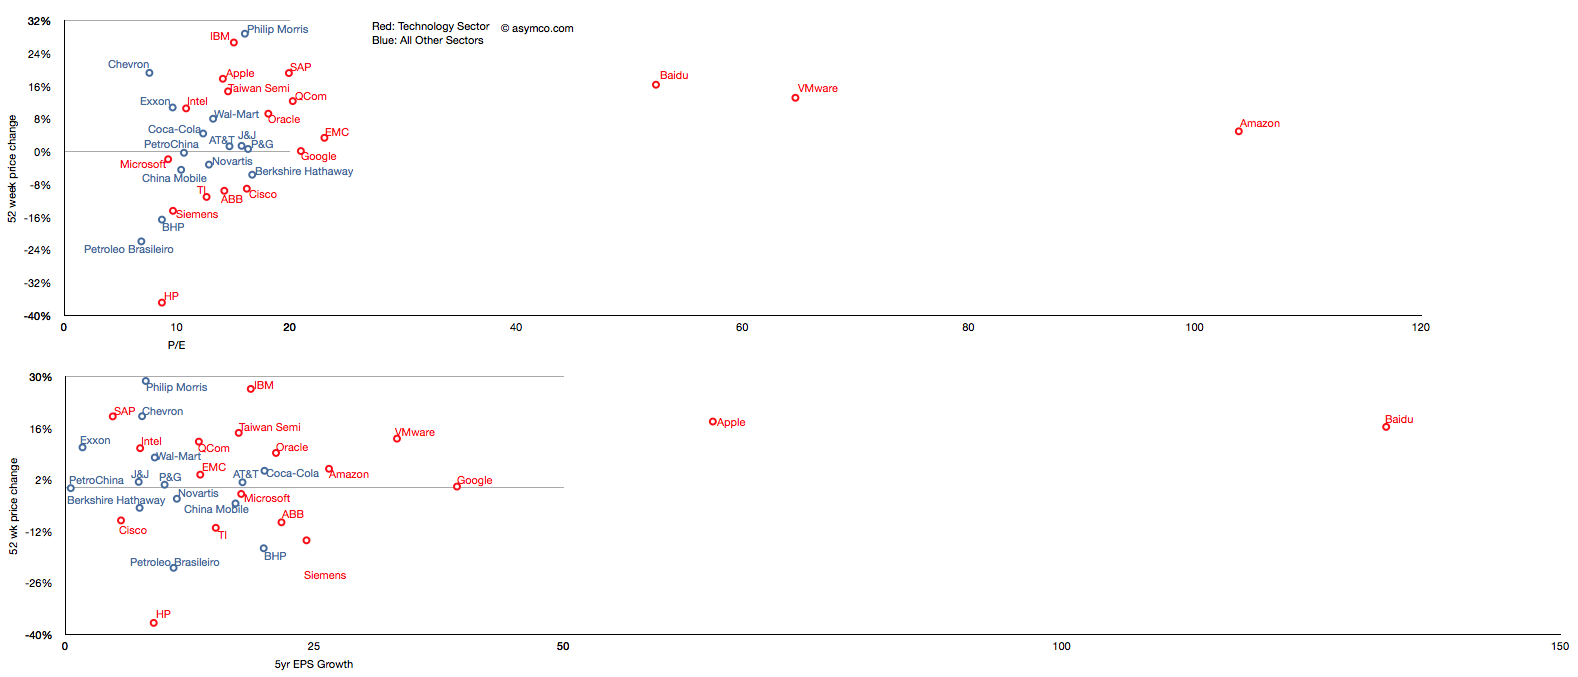
Note: I've also tried to observe correlation between recent share price change and growth and recent price growth and long-term earnings growth.
Similar anomalies and lack of correlation can be observed.
Andy Zaky at Bullish Cross wrote a great post on Apple’s valuation, showing the deep discount of Apple's earnings vs. an average company. It essentially states that Apple's money is not green.
Felix Salmon took it forward by enumerating a few explanations that might be used for the despondent valuation. None are successful arguments, but that should not be a surprise.
To understand the phenomenon a bit more precisely, I maintain and think about these charts:
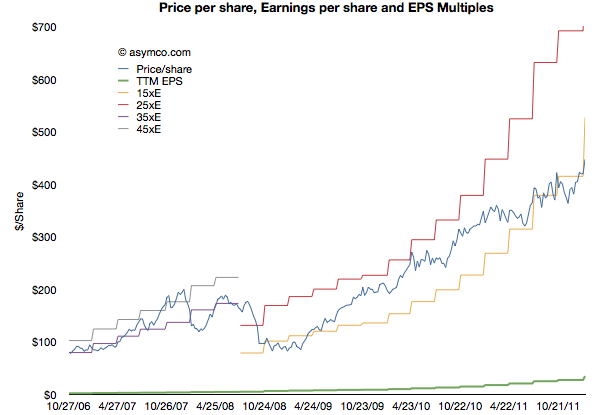
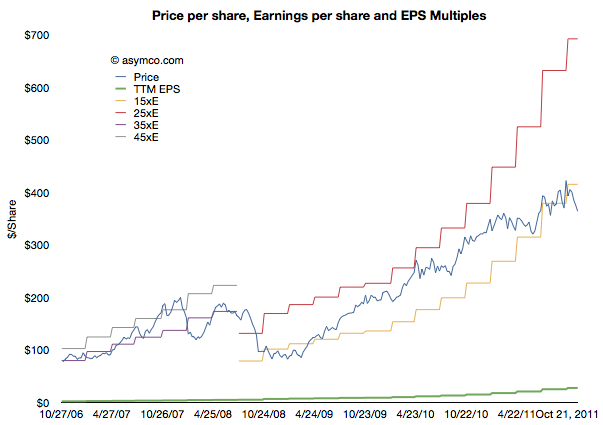
This shows Apple's share price ("P" in blue) and its earnings per share ("E" in green). In addition there are multiples of the earnings in "bands". The first band is 35xE to 45xE which bounded the price during the period of 2006 through most of 2008. The second band is 15xE to 25xE which bounded the price since then. The data is updated weekly so it is current as of last Friday.
Illustrating it this way shows how the stock is seen as representing different companies at different times. The 2006 era (iPod) Apple was seen as a high growth, dynamic company with loads of headroom for growth. The current (iOS) Apple is seen as a slow growth, fairly static company with most forecasts showing 20% growth potential.
Note that the price has dropped outside the current band for the first time since the great recession. It is still below 15xE today. Perhaps a new band is forming.
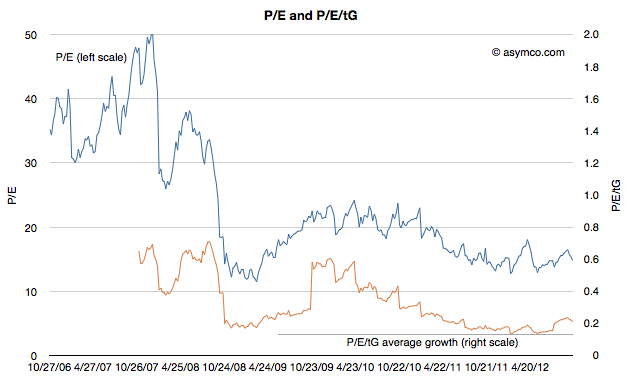
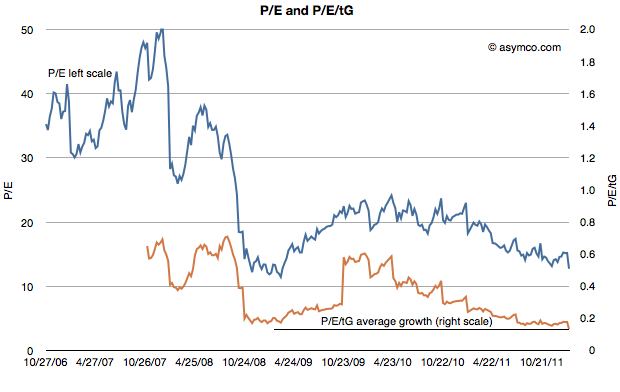
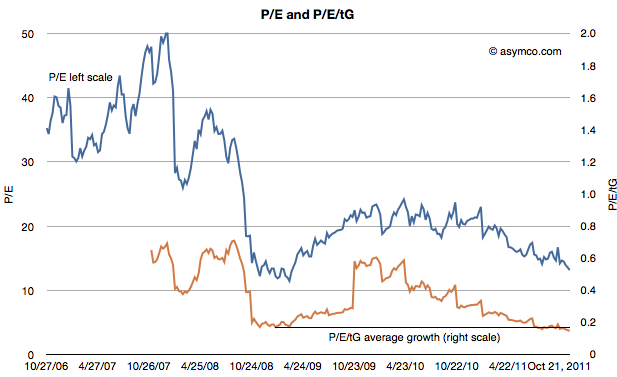
The second chart shows the P/E on its own (in blue) but with a second measure where the P/E is divided further by the average trailing twelve months' growth (P/E/tG). This is a variation on the P/E/G (aka PEG ratio) where instead of (mostly wrongly) estimated future growth I use actual growth history--hence the t for trailing. The P/E/tG is a way to normalize P/E as a function of growth and hence a more appropriate index of value potential.
I added a horizontal line to the chart to show the minimum value P/E/tG reached during the recession (0.17 in January 2009). As you can see, the P/E/tG is now lower than at that time (0.15). It implies a deeper discount for the company's earnings growth than during the time when the world faced economic contraction.[1]
Note also the trend of that line as it shows a steady linear path toward zero.
Of course, it cannot reach zero unless Apple files for bankruptcy. But until it does file, the line can only reach zero asymptotically as E/tG increases. Which is a relief, I suppose, as it means the rate at which P/E/tG drops will decrease. This implies that as earnings growth persists, the drop in price will have to moderate.
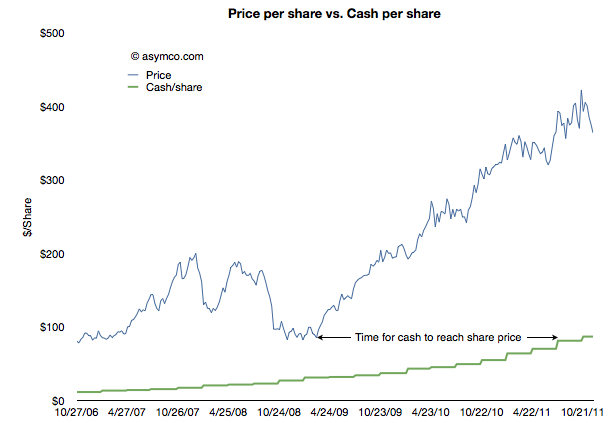
The other threshold to keep an eye out for is when Apple's share price will reach its cash per share. That's the point when investors will consider the company to be a net value destroyer. If you performed that analysis in January 2009, and you were accurate about earnings forecasting, the answer would be well before today. See the following chart:
In other words, in January 2009 the stock was trading at a price (<$80/share) below the current cash per share (>$85/share). It took Apple 18 months to grow its cash to reflect the price set on the company. Had the stock not risen then the company would today be trading below book value.
The amazing thing is that today the valuation structure (P/E/tG) is even worse than in it was January 2009. An interesting exercise would be to project how long it would take for the cash to increase to the current share price.[2]
I imagine this time interval should have a name. How about the time to boil: the time for growth pressure to become sufficiently high to exceed disbelief that growth can happen.
---
Notes:
Note that the low values were placed on the company after the crisis took hold, not as an anticipation of contraction. See the behavior of the index during the summer of 2008 as the credit crisis was unfolding.
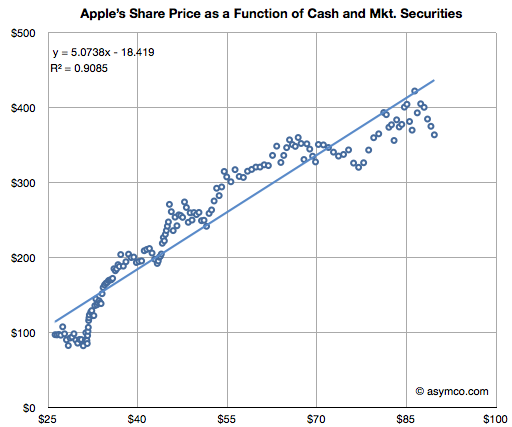
This analysis is consistent with the analysis that Apple is not valued on earnings or earnings growth but on its balance sheet. The ratio of Price/Cash has been fairly constant but if it breaks down (as it has been--see below) then we need to assume a new dynamic is in place.
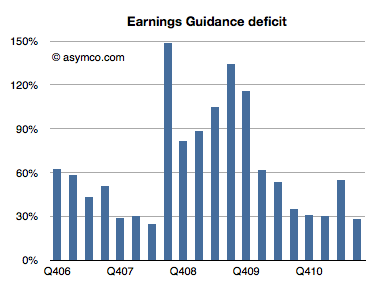
Every quarter Apple's management issues a "guidance" or forecast of their own earnings in the following quarter. Over the years, this figure has been nearly useless because not only is it not accurate, the error itself has been wildly variable. I plotted what I call the Earnings Guidance Deficit for Apple based on the formula (Actual EPS diluted - Guidance)/Guidance.
The higher the value in the bars above, the more the company underestimated (or under forecast) its performance. Note that during the recession the company routinely offered guidance at half the level they actually delivered. After the recession they returned to a more reasonable ~30% under-reporting.
The problem with this analysis is that there is such a high volatility in this factor that we can't count on it to predict where earnings will fall. Even if we saw a range bounded at 30% to 60% the usefulness of this would be very low as that is far worse than the range that analysts can get through other means (Deagol's accounting of analyst error). The best thing we can say is that the range seems to be bounded by 30% and 150%.
Rather than using this history for precision, perhaps it makes more sense to assume that the lower bound offers at least some limit to the possible value of next quarter's earnings. Maybe it can give us a "sanity check" for our own estimates.
For the next quarter Apple guided $9.30 per share. If we assume a 27% "deficit" which is at the lower end of the range above then the earnings are likely to be about $11.8.
That's equivalent to an 84% growth in earnings year/year. It would also imply $33 for the 2011 calendar year. At the current share price of $384 that implies a P/E of 11. That happens to also be the P/E for Apple at the trough of the recession in January 2009.
In other words, if the stock price does not rise (or falls) from the current level by the time earnings are reported in late January, then the P/E for Apple may drop to less than 11 on growth of 83%. That's a sanity check all of its own.