Asymco

Asymmetric Intelligence

P/E

  1. Growth and punishment: The vector space model

    Research · 23 comments

    After processing more than 1500 data points on the performance of thirteen technology companies, patterns are beginning to emerge. The steps so far:

    The final step is to plot the changes in the relationship between pre- and post-crisis for the set of companies normalized to the same starting point and then classifying them: 
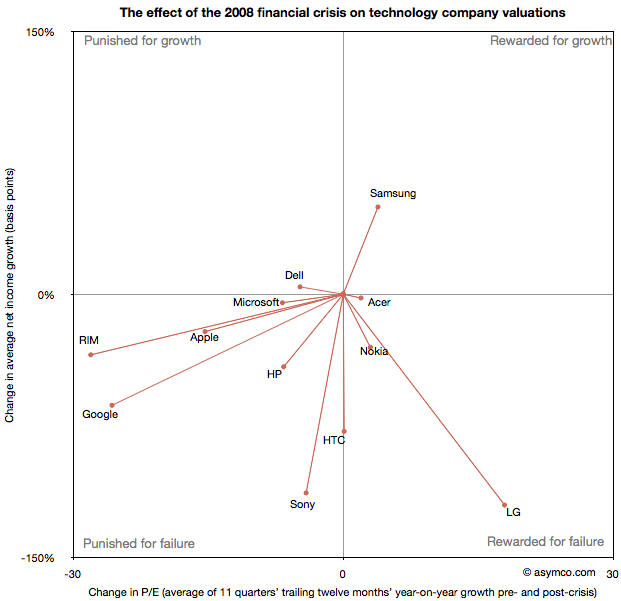
    The chart shows how the "average P/Es" changed after 9/30/2008 vs. how the companies performed during those periods. An evocative categorization is suggested for the four quadrants.

    One way to read the data would be as a degree of effect of the crisis. For example, in the case of HP, its P/E dropped by about 6.5 while its average growth decreased by 41 basis points giving an average of 0.16 drop in P/E for every basis point reduction in growth. That would be a fairly modest impact. In the case of HTC, the impact would be even less. The effect on P/E was zero even though growth dropped by about 78 basis points. At the same time the impact on Microsoft was severe with the P/E dropping as much as for HP even though its growth only moderated by 5 basis points.

    Therefore the "slope" (or angle in vector parlance) of each of the lines in the chart above may be interpreted as the severity of discount in value that the crisis invoked. Those values are shown the following chart:
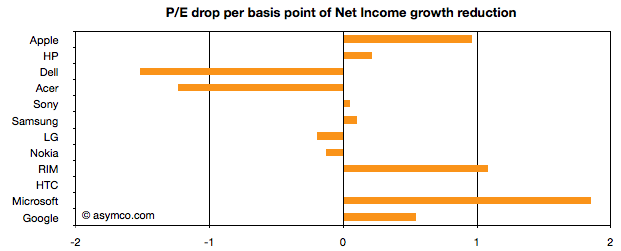
    A strong bar on the right half of the chart implies severe impact, a bar around the middle implies minimal impact and a bar in the left represents an inverse relationship where the market priced in opposition to performance[1]. What should be considered along with this chart is the quality of earnings and consistency of performance (which are shown in the posts linked above.)

    Discussion

    As noted in a previous article, there are really only six companies which had strong separation between pre- and post-crisis valuations: Apple, HP, RIM, HTC, Microsoft and Google. They are also the companies which had strong P/E drops (except for HTC). As a group they are also the companies with the best growth stories historically. This is perhaps the reason for the drop. Basically, because these were strong companies they "had the most to lose". The market "punished" them more severely than the weaker companies because the weak had already been discounted.

    The other observation is that Apple and RIM are not treated particularly differently. The drops in P/E are at about 1 for every basis point drop in growth. This means that the the degree of value lost is about the same as a function of growth loss. Microsoft seems to have been the most affected. We can argue that it is perhaps weaker than the others strategically so this is reflected here, but I doubt it's weaker than RIM. Microsoft is also in contrast with Google which seems to have been given a lot of benefit of the doubt.

    Nonetheless, this framework offers some hints on how technology companies have been treated after the crisis. There is no rightness or wrongness about this treatment but it may indicate potential for significant reaction in the opposite direction if and when macroeconomic conditions improve. These vectors are, in a way, proxies for volatility or "beta" in terms of correlation to the overall market. The greater the beta, the more amplification to market movement; the greater the slope value

    As always, Apple is the canary in the coal mine as far as sentiment is concerned. What should be watched is the pricing reaction as Apple moves from a net reduction in growth to a net increase in growth. How will P/E react? The argument on this site so far has been that growth is exceptionally strong for Apple and it's not being reflected in the price. However, in this analysis we've stretched the time frame and did a longer retrospective. On this new time scale growth is not yet at the levels Apple enjoyed in the heady days of 2005/6. Perhaps this growth will return and when it does we'll get to see which way Apple's vector moves.

    ----

    Notes:

    1. An inverse relationship with value can happen for various logical reasons, for example that a company has volatile performance which is depending on anomalous events.
  2. Growth profiles of 13 companies

    Research · 13 comments

    The previous article showing the profile of Apple's growth vs. its P/E prompted a similar review of a set of comparable companies. The cohort is composed of:

    Apple
    HP
    Dell
    Lenovo
    Acer
    Sony
    Samsung
    LG
    Nokia
    RIM
    HTC
    Microsoft
    Google

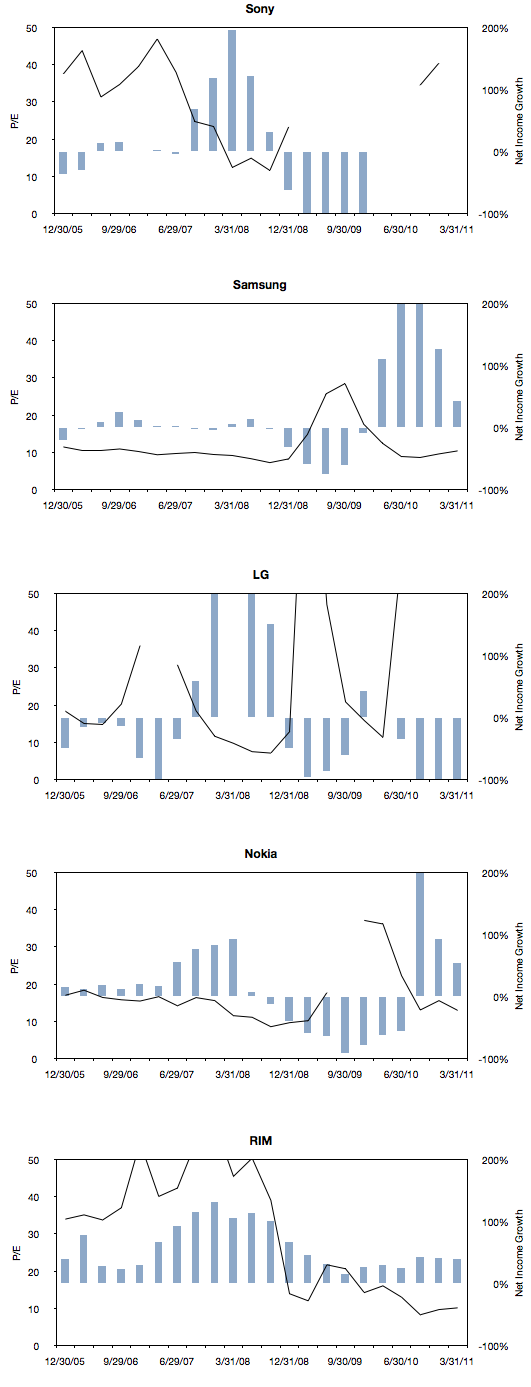
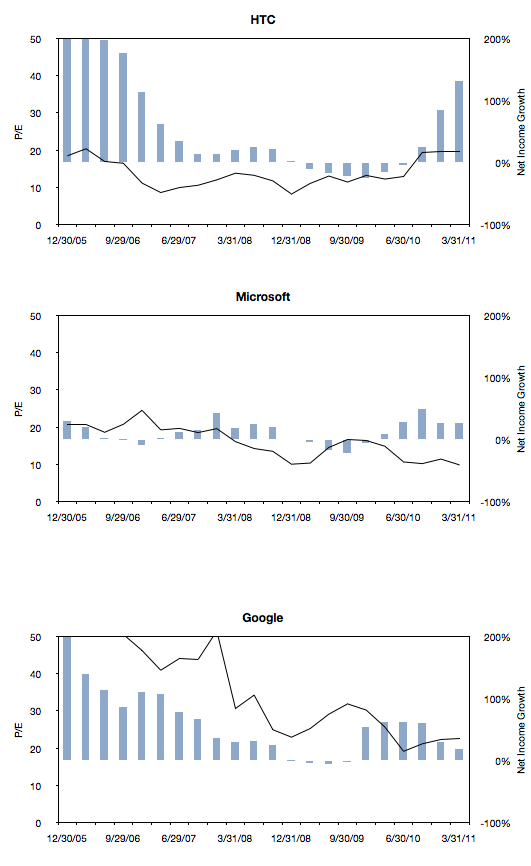
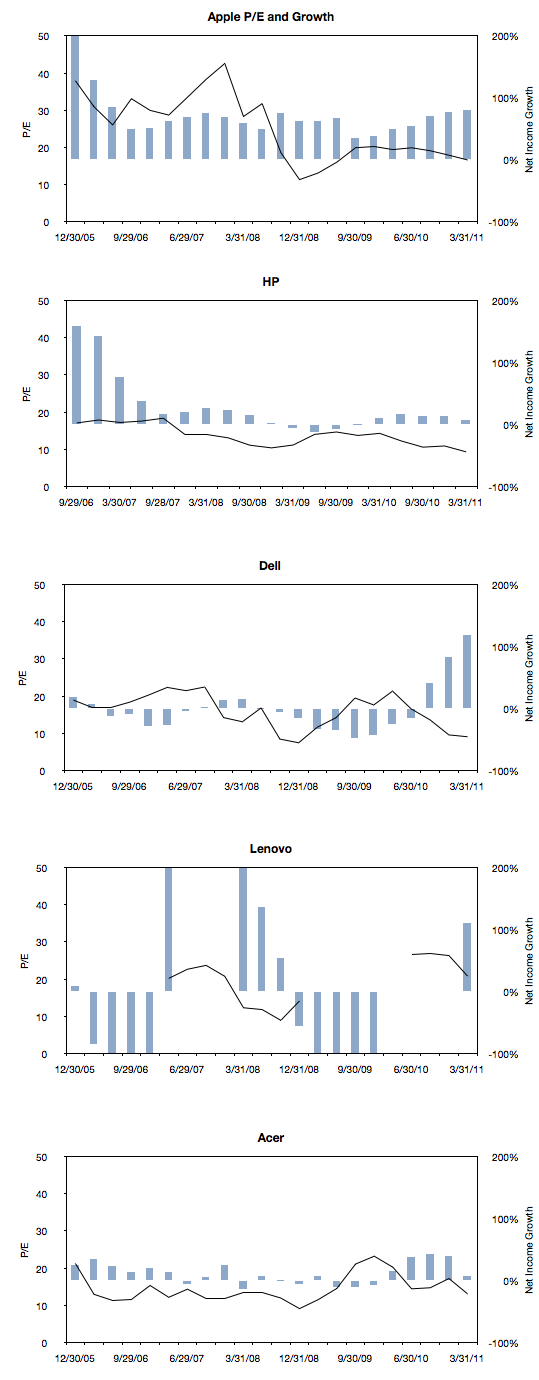
    The following charts are a simple representation of P/E (line chart with left scale) with Net Income growth super-imposed (bar chart with right scale.) The time period is 22 quarters; 11 quarters after the crisis (i.e. quarters after the one ending in Sept. 2008) and 11 quarters before the crisis (quarter ending 12/20/05 through the one ending 6/30/08).

    We made one change to the growth data from the previous post where the Net Income growth is not quarterly year-on-year but average of four quarters year-on-year. This reflects the fact that P/E is also a trailing twelve months' earnings. It also has the benefit of smoothing the growth data making it easier to discern.

    Here are the charts:

    Note that all charts are to the same scale (P/E from zero to 50 and Net Income growth from -100% to 200%). Some clipping of the values is possible. Growth from unprofitable periods are undefined (i.e. when measuring growth from a to b, if a is negative, the data is omitted.)  Growth from a positive period to a negative period is defined as -100% (i.e. when measuring growth from a to b, if b is negative, the value is defined as -1).

    There are some anomalies, for example growth due to an acquisition or loss of profitability due to re-organizations, however the patterns are probably what matter most.

    Next post will discuss the relationship between P/E and growth in the pre- and post-crisis time windows for all these companies.

  3. Apple's P/E compression illustrated

    Research · 118 comments

    The reason we look at valuation is that it offers insight into how innovation is perceived. If a company is a successful innovator it usually creates vast wealth for its owners. However, the timing of that wealth creation depends greatly on its recognition by others. In other words, valuation lets you determine how recognizable innovation is. If your analysis tells you that a company is supremely innovative but nobody else recognizes this then you have an investable opportunity.

    So with that in mind we like to compare industry and innovation analysis with what "the market" thinks about Apple.

    The latest method we had in mind was to compare P/E (a measure of valuation) and Growth. We've shown before that they seem to be moving in different directions. That's not been news for over a year. What we will try to do now is to see if there is discernible change in the relationship before and after the financial crisis.

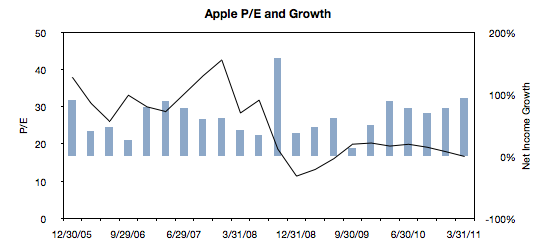
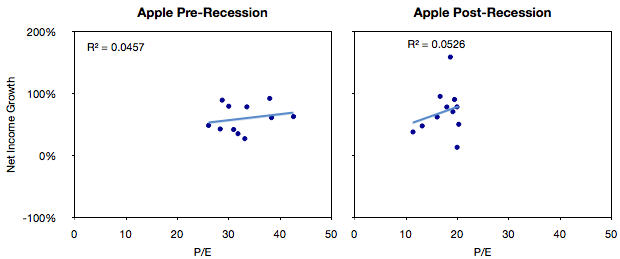
    The following chart is a simple representation of P/E (line chart with left scale) with Net Income growth super-imposed (bar chart with right scale.) We chose a time period of 22 quarters. 11 quarters after the crisis (i.e. quarters after the one ending in Sept. 2008) and 11 quarters before the crisis (quarter ending 12/20/05 through the one ending 6/30/08).

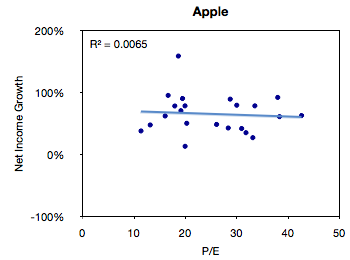
    We then plotted a scatter of all these pairs (P/E vs. Net Income Growth).


    The R-squared value simply shows that there is no correlation between these two variables, but this is not a surprise.

    The next step would be to compare the pre-and post-crisis data sets. The idea being to see if, and to what degree, there was influence from conditions beyond the control of the company.


    What seems to be happening is that the cluster of values did indeed move from the right (high P/E) to the left (low P/E) without much change in the growth.

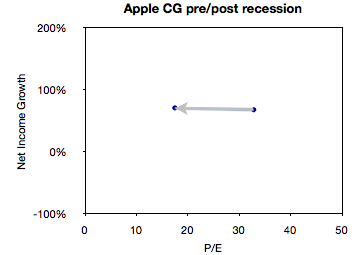
    We can get an even better feel for this by measuring the "center of gravity" of the clusters and plotting how they shifted.

    This chart illustrates succinctly the phenomenon of "P/E compression" where P/E drops while growth continues.

    In the case of Apple, average growth actually increased slightly between the two sampling periods (from 68% to 71%) while the average P/E dropped from 32.8 to 17.5.

    What will follow over the next few weeks will be pair-wise comparisons of Apple and comparable companies along these metrics of P/E and Growth.

  4. Quantifying the phobia of owning Apple shares

    Research · 51 comments

    As the market continues to exhibit signs of instability, an interesting paper[1] identified a correlation between the U.S. stock market and an index of the U.S. Financial Conditions. This index measures the assessment of the probability of a crisis.

    The conclusion is that an imminent crisis mentality pervades equities markets today and implies that pricing is largely disconnected from fundamentals. On this blog we've discussed the topic of fundamentals and marveled at how pricing seems to be largely exclusive of it.

    The case is made by the following chart:


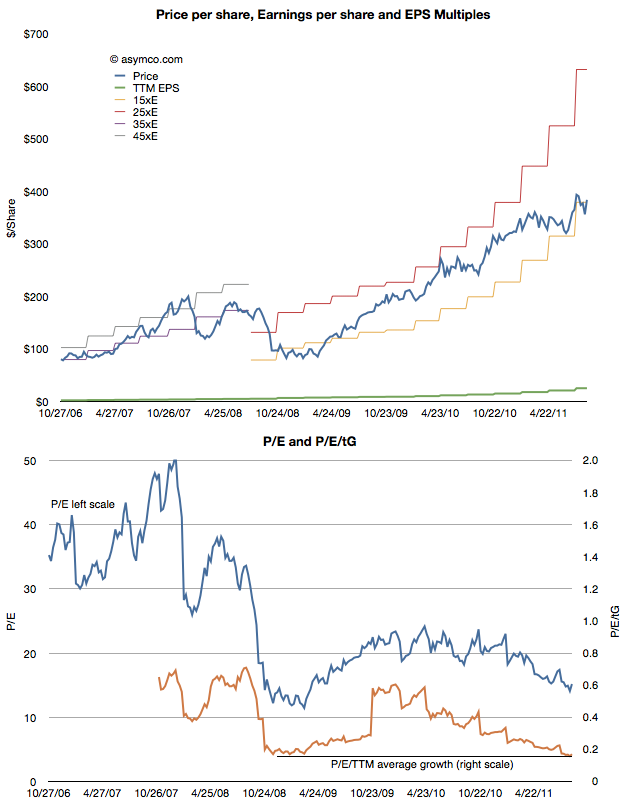
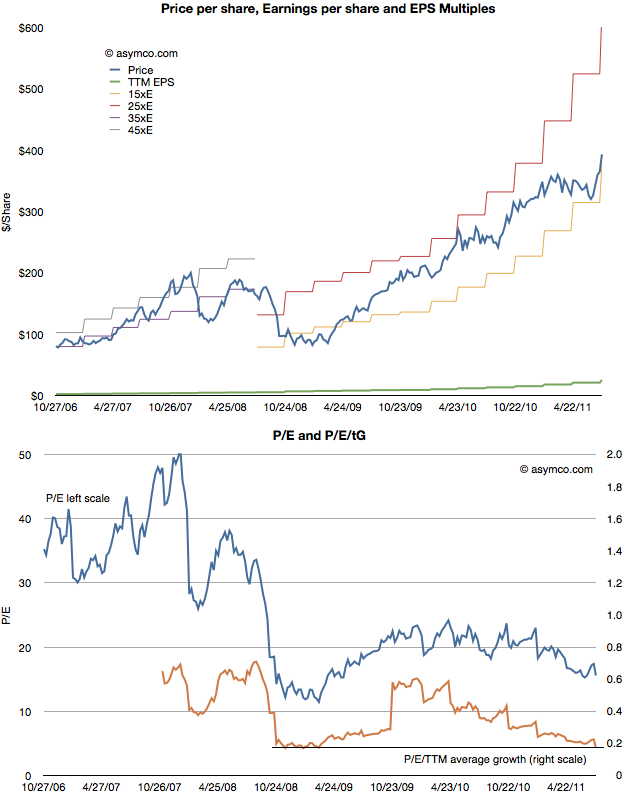
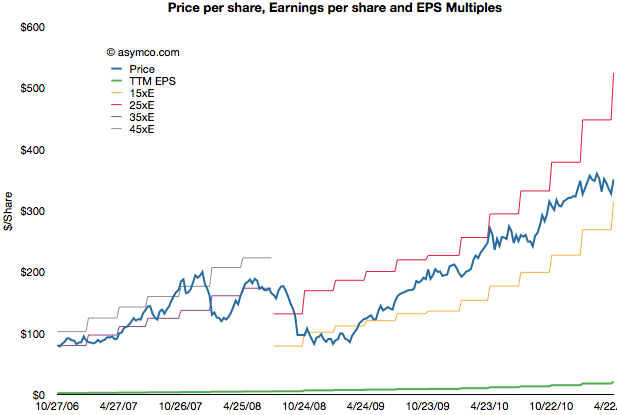
    The first chart shows the share price (blue) and the earnings per share (EPS in green) as well as several multiples of EPS. During the period of 2006 through 2008 the stock ranged between a P/E of 35 and 45. beginning with the collapse in confidence due to the banking crisis, the share price fell to within a range of 15 and 25. Now, with Apple's growth accelerating above 100%, the stock price seems to be sliding below the 15 P/E bottom.

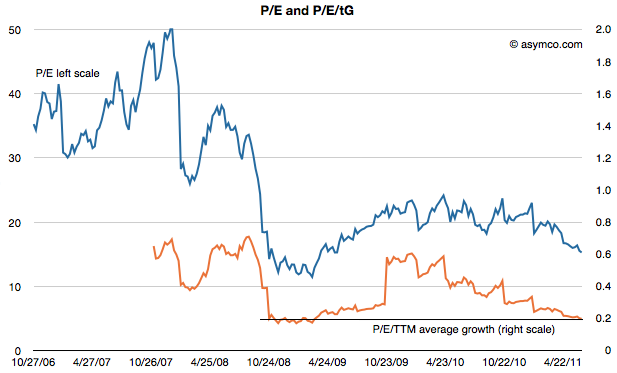
    In the second chart I show the P/E in blue and the P/E/trailing Growth. Adjusted for earnings growth the equity is cheaper now than at the bottom of the last recession. You can also observe the trend or slope of the decline in the P/E/tG. It might be alarming to see the decline but it also might be comforting to know that the P/E/tG cannot go to zero. Either Price has to go to zero or earnings or growth have to go to infinity. The closer P/E/tG goes to zero however (it's at 0.17) the more undervalued Apple appears to be.

    Naturally these metrics of P/E are arbitrary and the price is simply what the buyers are willing to pay for the equity. But the value of any metric is the trend. The value can be compared to a different time or to a different equity. The trend here is that Apple, at least, is being discounted at a time when it's growing more robustly than ever.

    Which is why finding an explanation is so important. This is where the paper sheds some potential clues. The author concludes that there is a pervasive crisis phobia which affects multiples. Paulsen writes:

    If cultural mentalities were less crisis-phobic today, what would the PE multiple be on the stock market coming off a 12.8 percent profit quarter with a 2.2 percent Treasury yield and only about a 1.6 percent core consumer price inflation rate? Certainly, much higher than 12 times earnings! 16 times earnings? 17 times? This simply illustrates just how much the crisis-centric mindset is depressing investment potential and it also suggest how much opportunity there is to increase stock valuations just by improving the cultural mindset. Long term, the real investment opportunity is not a dramatic improvement in economic or profit growth (although either or both could occur), but rather is just a slow but steady decay in “crisis-fears” similar to what we experienced during the last recovery.

    ----

    Reference:

    1. A Crisis Phobic Investment Culture, James W. Paulsen, Ph.D. Wells Capital Management.
  5. Apple and comparables P/E ratios: Is punishment for growth being dispensed equally?

    Research · 72 comments

    Apple's valuation has been discussed several times on Asymco. Apple’s relative valuation in terms of P/E ratio has not improved since the recession despite an acceleration in financial performance. As Apple seems to be getting punished for growth, we have to also ask if it is the only one.

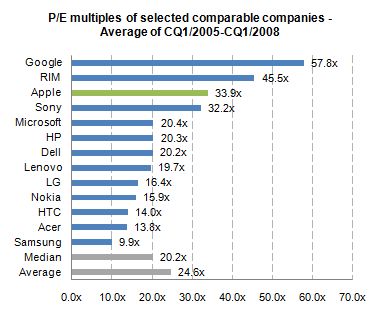
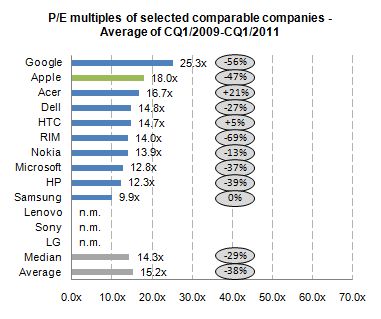
    When looking at valuation from an institutional investor or financial analyst point of view, the most common methodologies are discounted cash flow (DCF) as well as comparable company multiples. Most often, a DCF valuation is performed and cross-checked with comparable multiples. The justification for using comparable companies is the exposure to the same market dynamics including, for instance, market growth and profitability. So to understand this perspective, let us focus on a peer group valuation by looking at the average P/E multiples[1] for the calendar quarters 1/2005 to 1/2008[2].


    We can see that before the financial crisis Apple has been valued above the peer group average with a P/E ratio of 33.9x.

    During the financial crisis stock prices declined across industries. For the selected companies share prices declined on average more than 80%. One would assume that with the improved industry outlook and worldwide recovery since 2009, peer group multiples should return to pre-crisis levels. By looking at the average P/E multiples for the calendar quarters 1/2009 to 1/2011, we can derive the change in relative valuation levels.


    The data shows that, on average, all companies are continuously trading almost 40% lower for a two year period after the financial crisis. Despite Apple’s higher-than-average discount of 47% to pre-crisis valuation level, Apple is valued above the peer group average and on top of the mobile phone and PC vendor group.

    By using the comparable company valuation approach, we are able to see how institutional investors analyze and value Apple. The analysis points to a valuation paradigm shift affecting not only Apple, but many comparable companies post financial crisis. In addition, there was a premium on Apple’s valuation before crisis and there is a premium after the crisis.

    The notion that Apple has been single-handedly punished by the market does not hold in the context of comparable companies.

    The next step will be to determine if the P/E premium for Apple is consistent with its growth premium.

    ---

    Notes:

    1. Share prices as of end of quarter, earnings include last twelve months
    2. Charts excluding negative multiples and outliers (turn-around multiples)


  6. Estimates for Apple's fourth fiscal quarter: Entering the post-P/E era

    Research · 92 comments

    I'm late with posting my estimates for Apple's current (fourth fiscal) quarter. Normally I post my estimates a few days after the previous quarter's earnings are announced. This quarter however there was a lot to think about.

    As pointed out in my analysis of the previous quarter, the iPhone sold at a far faster rate than I thought. I had expected it would be a "lame duck" in the quarter but the expanding distribution allowed it to continue at a triple-digit growth rate (142% in fact, the highest quarterly growth rate since 2009).

    So the question for this quarter is, as always, what's the iPhone growth? The problem for me is that I have to choose between two assumptions:

    1. Due to distribution and dual product strategy (n-1 variant) production has now become more consistent.
    2. This quarter is the actual transition quarter when iPhone 4 production is throttled down in favor of the new model.

    The first assumption would put the iPhone growth at 100%+ while the second would place it in the 60% to 80% range. I decided to dial in a figure somewhere in between at 90% but I'm not very confident in this until we see more evidence that a new pattern has emerged.

    So here are my "mid" quarter forecasts:

    • iPhone units: 26.8 million (90%)
    • Macs: 4.8 million (23%)
    • iPads: 10.5 million (150%)
    • iPods: 7.0 million (-22%)
    • Music (incl. app) rev. growth: 30%
    • Peripherals rev. growth: 23%
    • Software rev. growth: 32%
    • Total revenues: $33.2 billion (growth: 63%)
    • GM: 41.8%
    • EPS: $9.05 (95%)

    Three years ago the company's share price was trading at a P/E ratio of about 35. The above estimate and today's price implies that's it's trading at the same multiple but the Earnings is measured over one quarter not one year.

    As @Patricklgoe noted on Twitter: the post-PC era for Apple means it's the post-P/E era as well.

  7. Apple's share price (adjusted for earnings and growth) reaches new low

    Research · 30 comments

    After Apple reported earnings growth of 125% its share price dropped to a P/E of about 15. This reduction in valuation is part of a trend I've written about for over a year so there were no surprises. The first chart below shows how the stock has traded between increasingly lowered P/E bands.

    As the second chart shows, not only is the P/E ratio declining, but when seen against the trailing twelve months (TTM) average growth rate, the P/E/TTM ratio is now at the lowest since the great recession (around 0.17--a value of 1.0 is a rule of thumb for "fair value" in a growth stock).

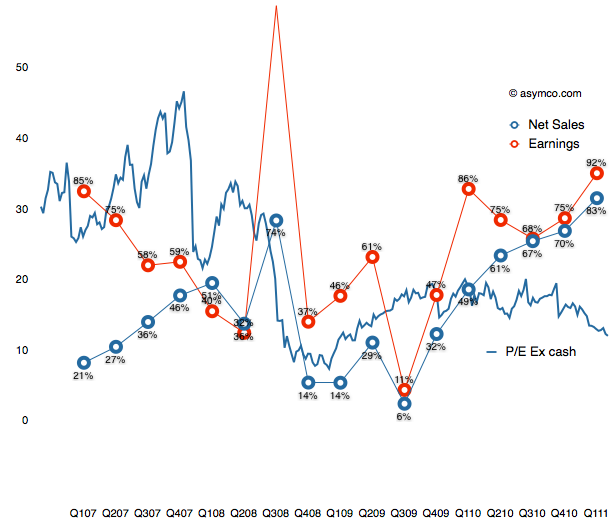
    Those values include cash. Excluding cash, the P/E as of Friday was 12.4. On a forward basis (my estimate--which has shown be be conservative lately) the P/E is around 7.

    Perhaps some day in the future investors will come around to looking at Apple as a growing company, but there has been no such inclination for over two years. As I've pointed out numerous times, growth and valuation are moving in opposite directions.

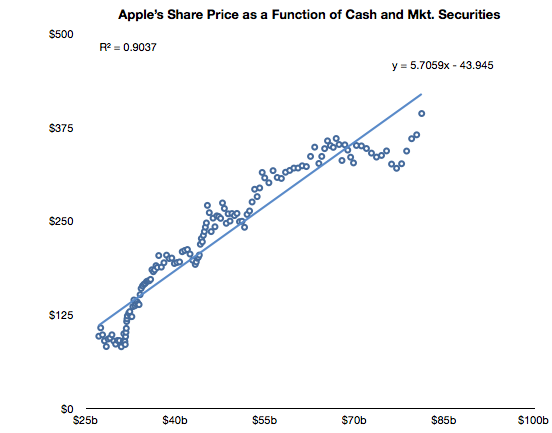
    The only correlation to the stock price has been found on the balance sheet, not the income statement. Looking again at the relationships between cash and the stock price, we see a clear relationship (r squared of .9)

    After a lapse during the first quarter, the relationship that has been in place since October 2008 is returning.

    Note the formula of the trendline which allows some interesting guesses on what the stock price will be. For example, putting $95 in cash per share results in a share price of $500. Let's see if the relationship holds until then.


  8. A new way to value Apple

    Research · 38 comments

    Almost all valuation models for Apple assume it's a hardware company. The modeling algorithm for hardware is simple:

    • For each year in near future
    • For each product line
    • Compute contribution
    • Determine company value by summing contributions and multiplying by a P/E ratio

    The major difficulty is in predicting the growth of each product line. This is difficult because buyers can be fickle. Companies employs all sorts of tools in order to secure repeat customers but if switching costs are low, the company can crash in value. For this reason, analysts pick various ways to predict device  sales. Some choose to index each product on production (channel checks), demand (customer surveys,)  or even on a top-down share of total (market research on growth of whole market and assumptions of share).

    Although simple and convenient, this model does not probably match the way Apple is managed. The company does not build hardware products to sell and forget. It builds platforms which are best seen as sources of recurring revenues. Users are incentivized to continue buying devices. iCloud, iTunes and other Apple properties are expressly designed to that goal--and they are not cheap to run. So, the company must see the world through a different set of lenses than the default model shown above.

    To think about the business like they do, we need to put the data through a similar set of lenses. I began with a modest proposal last month to value each user as a source of recurring revenue. Now it's time to expand on this method.

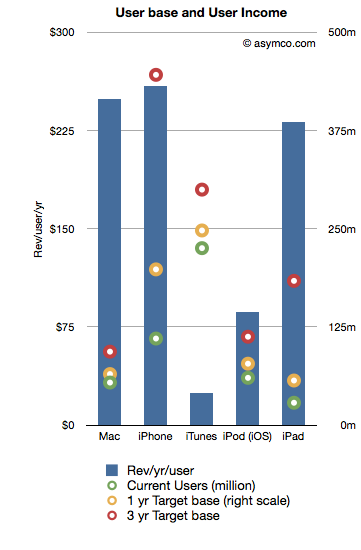
    The following chart shows the recurring revenues per user by product and the current and possible future size of user bases.[2]

    Revenues/yr/user are bars with the left axis and the User bases are various colored circles indexed with the right axis.

    The assumptions that went into the data are as follows:

    1. Device life span is as per previous article linked above
    2. User base growth for 1 year is: Mac 20%, iPhone 80%, iTunes 10%, iPod 30%, iPad 100%
    3. User base growth for 2nd and 3rd years (recurring): Mac 20%, iPhone 50%, iTunes 10%, iPod 20%, iPad 80%.
    4. The Revenue per user is assumed constant

    Note that the user base growth figures are lower than the product growth levels seen historically. Obviously, the model is highly sensitive to these growth assumptions so they need to be scrutinized and tested rigorously.

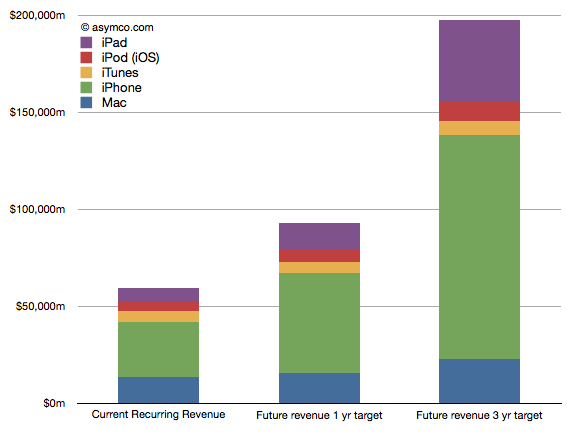
    Nevertheless, as a straw-man proposal,  the recurring revenues for all these products[1] is shown in the following chart:

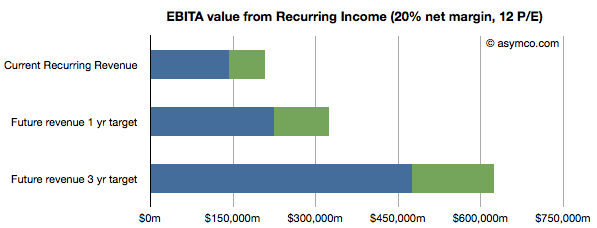
    Once the income is estimated, we can take that value and assume a profit margin (net) and then multiply the earnings by a multiple. Using a 20% net margin and 12x P/E yields the following chart.

    (I added an assumed level of cash in green.)

    This model would imply that the company today could be valued at $208 billion on the basis of its installed base alone. That value would be about $323 billion in one year and $620 billion in three years. Dividing by the number of shares outstanding (935m this year increasing at 2% a year) yields a share price of $222, $339 and $629 by mid 2014.

    These values can be considered "lower bounds" on valuation since they assume income from previously secured customers. The speculative part of investment would be based on what the future bases will look like (so, for example, if one believes these assumptions, the $629 figure could be considered a target to be discounted to today).

    ---

    Notes:

    1. Excludes Software, Peripherals, non-iOS devices, and any other service revenue.
    2. Compare this char to social media companies (MIT Technology Review)
  9. Thinking over Apple's value

    Research · 71 comments

    In intra-day trading Apple's stock price traded at a P/E ratio below 15. That threshold is now at a price of about $315/share. Excluding cash the P/E is under 12. On a forward basis, there is widespread agreement that Apple has the reward (yield) profile of a bond without the risk of inflation.

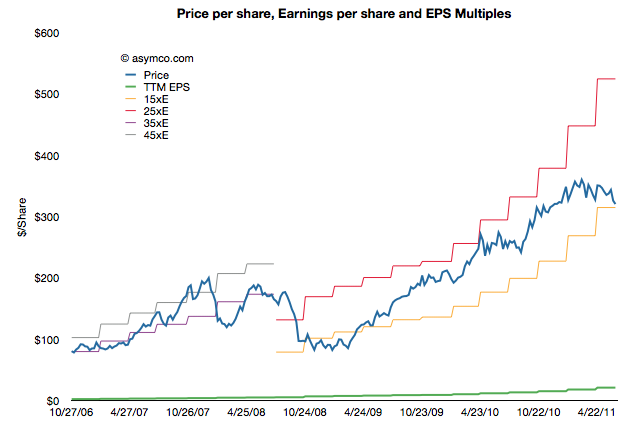
    The history of the P/E ratio and the share price is shown in the following chart:

    As the chart shows, Apple traded in a range of P/E between 35 and 45 until late 2008 and has been trading between a range of 15 and 25 since about spring 2009. It might seem that the price is rewarding growth, but it's not.

    When adjusting for the growth the company has maintained, the company is at a similar P/E/tG (Price/Earnings/trailing Growth) to the depths of the recession.

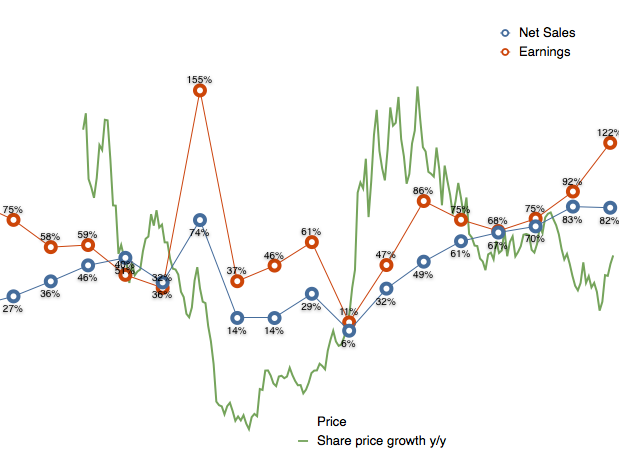
    At the trough shown above, the company was growing earnings at high 30% rates and sales in the teens. Today the company is growing earnings at 92% and sales at 83%. the following chart shows P/E ratio vs. growth.

    From a historic perspective, Apple is as cheap as it was at the bottom of the recession. At the time there were many reasons given for why the company would suffer 'headwinds'. Most commonly cited was that the company was a maker of "luxury" products and luxury does not sell in a recession.

    Today reasons being given for why the company will not prosper are far more nuanced. I won't re-iterate them but they deal with competition, platform issues, production issues, sympathy with companies that are failing, and saturation of markets.

    The trouble is that these arguments are easier to refute than the luxury vs. economy argument.  Exactly because the arguments are more precise, there is data that can be used to counter pessimism.

    And yet, with or without data, markets sometimes decide that profits are not reliable indicators of value created or potential for value creation.

  10. The Apple Growth Scorecard

    Research · 127 comments

    Apple's revenue for the first quarter was $24.7 billion, which at 83% was the largest quarterly revenue growth they ever experienced. Operating margin was an all-time high of almost $7.9 billion, representing 31.9% of revenue and yielding 95% EPS growth.

    After earnings were announced the share price reached $350.7. This includes $70 in cash. Trailing twelve months' earnings were $20.97. That makes the Price/Earnings ratio 16.7. Excluding cash, P/E is 13.4. The average growth over the past four quarters was 77%.

    The following chart shows the share price vs. earnings. The green line is price and the blue line is share price. I also added multiples of the earnings to show how the stock traded in certain multiple bands.

    During the period of 2006 to 2008 the company shares traded roughly in a range of 35 to 45 P/E. Since late 2008 the company shares have traded in a range of 15 to 25 P/E.

    Share prices normally reflect potential earnings growth and past growth is often a good indicator of near term continuing growth. This is why the P/E is usually a proxy for growth. The faster the growth, the higher the P/E. Or so one would think.

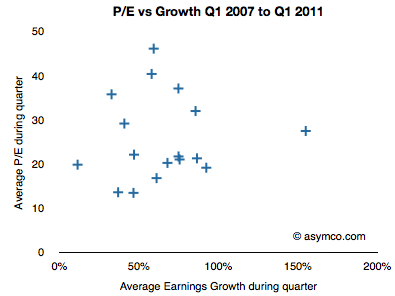
    If we look at the P/E vs. earnings growth for Apple, the picture is not encouraging.

    P/E and Growth don't seem at all correlated. In fact, if we drop two outliers it almost seems that P/E is insensitive to growth.

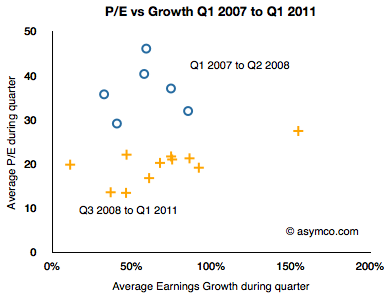
    I took the data a step further and separated it into two clusters: pre-recession and post-recession.

    The blue circles are Q1 '07 to Q2 '08 and the orange plus signs are Q3 '08 to Q1 '11. As the share price chart implies, there is a clustering of averages where during the 2007 and early 2008 period P/Es were in the 35 range while growth was in the 50s and P/Es below 20s with similar or higher growth ranges.

    As the following scorecard shows, the company's growth is exceptional. That does not seem to be something that is being valued by investors.


  11. Is Android responsible for Apple's deep market discount?

    Research · 96 comments

    At last night's closing price Apple was trading at a P/E of 16.3. Excluding cash that ratio was at 13. On a conservative forward basis (my estimates) the stock is priced at less than 10 times next twelve months' earnings.

    These figures show a remarkable pessimism that has persisted around Apple for years. It was slightly, but not much, worse during the great recession. It persisted whether the company was growing at 30% of, as now, 95%.

    There are many hypotheses about why Apple's earnings and growth are considered worthless. They come and go with the whims of the age: recession, elitist, luxury branding, health issues, macro "headwinds", earthquakes, phantom competition.

    Lately it's become fashionable to blame Android. That's a curious thing to me, because Android has been discussed at length here and it has been shown to be, for the time being, benign. Apple has not "lost sales" to Android as it has been selling all it can produce. In some ways it's been a boon as a co-belligerent against non-consumption.

    The argument that the discount is in effect because of the future of Android has one first strike against it: the fact that the market does not often discount the distant future. Capital markets are notoriously incompetent in spotting disruptions and often reward those who are failing right up until the bitter end.

    But let's take the "Android hypothesis" (i.e. that Android is causal to Apple's share price) seriously and analyze it. How could the impact be measured?

    Since Apple is trading at a fraction of (a) historic multiple (b) multiple based on growth (c) comparable companies' multiples then we can assume that a "normal" valuation would be twice the current (i.e. a multiple of about 32). That would still be a discount to growth and history but it would begin to match some of the comparables. A doubling of the P/E would be a good start.

    But a multiple of 32 would imply a doubling of market cap, which means that the Android hypothesis is causing the evaporation of about $300 billion in future profits. So it stands to reason that it's responsible for a $300 billion destruction of Apple shareholder value.

    That's an interesting number since Google itself is only worth about $169 billion.

    The measurement then presents a remedy: If Apple bought Google (it already has a third of its value in cash) and it shut down Android, it could create $300 billion in value. If could even throw away all of Google and still walk out with a profit.

    Seems like a great bargain.