Asymco

Asymmetric Intelligence

platform

  1. 5

    Research · 60 comments

    It looks like the next iPhone will be called the iPhone 5. What's in a name? As it turns out, quite a lot.

    Every hardware product that Apple has released has had a brand and a sub-brand. Macs for example use the Mac brand and a sub-brand as follows:

    • iMac
    • Mac Pro
    • Mac mini
    • MacBook

    Thus each sub-brand imparts certain meaning to the buyer. i, Pro, mini, book are all evocative. MacBook even has its own sub-brands:

    • MacBook Pro
    • MacBook Air

    These Mac sub-sub-brands of Pro and Air are specifically designed to also distinguish and convey meaning.

    iPods as well use the iPod brand followed by a sub-brand.

    • iPod Classic
    • iPod touch
    • iPod mini
    • iPod shuffle
    • iPod nano

    Note how the mini  sub-brand was retired from the iPod line to be used exclusively in the Mac product line. That may not be specifically necessary or desirable but it is an interesting coincidence. (The Pro sub-brand is shared between different Mac lines)

    However, when we look at the iPhone and the iPad, the nomenclature has been distinctly different. Both products have been using generational naming conventions. This implies no sub-branding as the iPhone and iPad are the only identifiers of brand and hence the only meaning being imparted to the buyer. You either get an iPhone or and old iPhone.

    That changed with the iPad however. The third generation iPad became just iPad. This was deliberate (why would they want to confuse buyers?) I think there is some logic to this.

    Note the parallel to the convention of the original iPod. When the iPod launched it was just the iPod. Subsequent versions were identified by a generation, but not a specific sub-brand. After the third generation iPod (still called iPod), the mini version was launched, creating the sub-brand convention that remains in use to this day. The iPod therefore was born generational but switched to sub-branding in adolescence.

    The possibility exists, therefore, that there will be a sub-brand for the iPad. Perhaps "mini" is being reserved for a new iPad, to distinguish it from the regular iPad (no sub-brand) that is likely to remain in production. The logic is to make room for sub-brands when the core brand begins to cover a wider array of form factors, themselves proxies for separate use cases or jobs to be done.

    So what about the iPhone?

    The iPhone has remained, stubbornly, after five years, stuck with a generational naming convention vis-à-vis the sub-brand convention used in every other mature product line from Apple. (Note that software from Apple adheres strictly to a generational naming convention because there is no "room" for a sub-brand under a software brand. There can be no "iWork Pro" or "Final Cut EZ". [Update: there once was Final Cut Express])

    Prior to today I entertained the possibility that the new iPhone will follow the iPad in dropping generational naming in favor of sub-branding thus implying that the brand would develop into a portfolio of sub-brands (like the iPad seems about to.)

    Alas, that possibility now seems moot. The launch announcement seems to clearly point to "5" being the name of the new iPhone. The brand remains iPhone and there will be no sub-branding.

    This can only mean that Apple intends to preserve a single product strategy for the brand. There will be no "special" iPhone for different (e.g. low-end) markets. There will be no different form factor to accommodate different use cases. There will be no new jobs to be done for the iPhone.

    What a bummer.

    However, there may be something more curious happening. Note all the service brands being launched on the iOS platform. There's Siri, (as yet unnamed) Maps, GameCenter and PassBook. These are not Apps. These are services designed to be unique to iOS, perhaps even unique to the iPhone. The difference with the iPhone brand may not be that it spans a multitude of sub-brands in hardware but that it covers a multitude of new service brands. As brands imply meaning, the iPhone brand may imply that it's a platform in and of itself.

    Now that's an interesting development.
     

  2. American exceptionalism

    Research · 45 comments

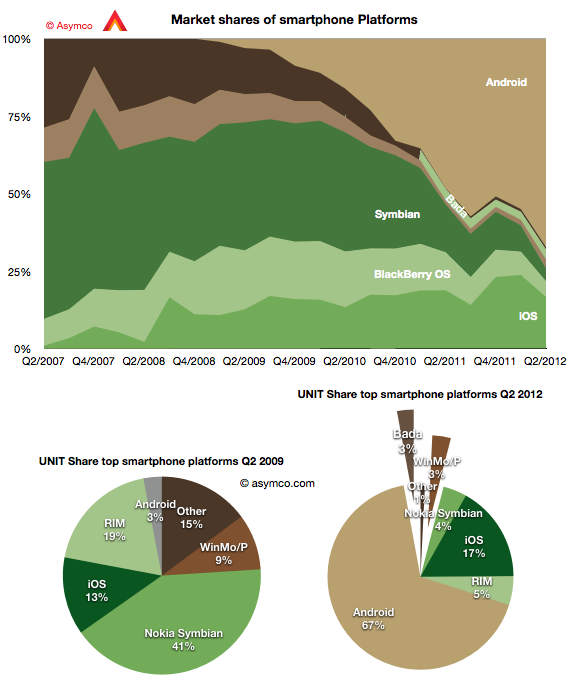
    The second quarter showed continuing growth for Android with 19 points of share growth from a year ago. Only Windows Phone showed a gain y/y in share up 1.6 points to about 3%. In the same time, Bada lost half a point, iOS lost 2.1 points, RIM lost 7.2, Symbian 11.4.

    The result is shown in the graph below:

    I also show a "before-and-after" pair of pie charts which show the difference in smartphone platform market share from the same quarter three years ago. Android went from 3% share to 67% while Symbian went from 41% to 4% and RIM went from 19% to 5%. iOS increased its share from 13% to 17%.

    If this trend continues Android could reach 50% of all phones sold in a few years. That's a run rate of 200 million per quarter. And it's likely that 100 million of those will be shipped by Chinese vendors.

    However, looking at the global picture can also miss some important trends in local markets. Had one looked at the global smartphone business in 2005, the conclusion would have been that Symbian would be the dominant platform in perpetuity.

    What affected the global market was a change in the US: the launch of iOS and thereafter of Android. The US, a smartphone backwater until then, became the most vibrant market and today it's the most penetrated and has the highest ratio of smart to non-smart of any of the major regions.

    The curious thing about this vast market is that it's still not truly open. There are technology and political reasons why some platforms are permitted to sell in one region or not. The iPhone is not available on either the largest Chinese operator or on the largest Japanese one. It's largely absent from India because of distribution (i.e. subsidy) and much of South America. Even in the US, the iPhone is still, after five years, not available on one of the top four operators and has only reached another less than a year ago.

    What intrigues me is what would the market look like if distribution were not an issue. What if there was equal choice to all buyers. We can't test this question directly but we can ask. But there is some pattern we can look at in the US data. Thanks to recent revelations at the Samsung vs. Apple trial we can see the effect of increasing distribution in the US.

    The data on smartphone market share by carrier can be blended with data from carriers about iPhone activations (which are a proxy for sales, see note below) to give a more precise figure of market share in markets where iPhone participates.

    For example, when the iPhone was only available on AT&T, one could measure iPhone market share vs. the global smartphone market, or the US smartphone market or within AT&T alone. Some assumed that the AT&T share would be reduced once the product would become available on Verizon or other US carriers. However there was no appreciable drop. Share in Q4 2010 was 63% at AT&T and it was 63% a year later after the iPhone was available for four quarters at Verizon.

    So the share of iPhone within those operators which carry it tells a story independent of distribution.

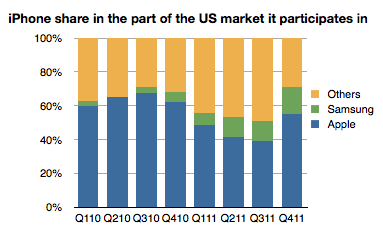
    The following graph shows the share of the iPhone vs. Samsung in the market defined by its availability. (I.e. the volumes of smartphones sold by AT&T throughout the time period, Verizon Q1 2011 to end and Sprint in Q4 '11).

    The share of iPhone thus defined shows a slight decline but it's an overall number that is remarkably resilient as distribution increases and is remarkably high overall. Note that globally, the iPhone gets only about 17% share of smartphones--a value that has not varied greatly since mid 2009.

    So at least in the US, on carriers where it's available, the iPhone is holding on to a significant share. In a global market it's expanding distribution but not yet covering the world. As a consequence it's keeping up with overall market growth and staying between 17% and 20% share.

    The big question is what will happen if and when its availability matches that of Android in terms of points of sale. Or even that of BlackBerry or Symbian. Is America a different market from the rest of the world? It was different in being isolated while Symbian roamed globally. It was different in being a launch platform for BlackBerry and then iOS and then Android. But now that iPhone is beginning to be widely available there, will it be exceptional in how it rewards Apple?

    ---

    Note:

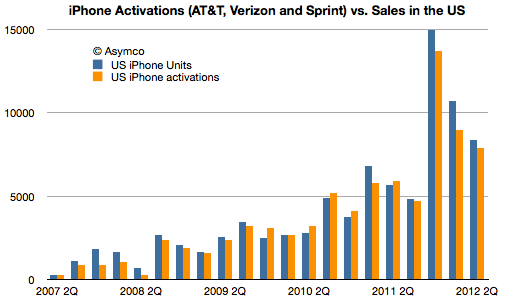
    1. Activations data can be seen next to Apple's testimony of US sales in the following graph. Note that more phones were sold by Apple than were activated in total of the life of the product. 86 million sold and 80 million activated. This implies that an analysis based on activations undercounts the iPhone. 
  3. How many smartphones did Samsung ship in Q2?

    Research · 62 comments

    50.2 million.

    That's the estimate from IDC. So why bother asking?

    Because that is an estimate. Of the 104 million Android phones shipped in the quarter (itself an estimate from another, possibly different methodology), I could only account for 7 million actually reported. That figure comes from a close reading of an investor presentation from Sony. HTC does not report their shipment numbers. It stopped some time late last year. Neither does Motorola now that it's a part of Google. Huawei is silent except for setting targets and ZTE published a press release citing IDC's estimate of its own shipments.

    But most glaring of all is the absence of any mention by Samsung of its performance. The company stopped reporting any data on either overall phone shipments or of smartphones within that total since Q3 2011. We may have been able to estimate Samsung if we had more competitor actuals, allowing us to back into a figure. But we don't.[1]

    Which leaves us with IDC's estimate[2]. But the problem is that since the industry is growing so quickly it is very sensitive to assumptions. Consider how difficult it is for consensus estimates for Apple's iPhone shipments to come near the actuals--and that's for one quarter, and knowing all the previous quarters with precision. The absence of visibility into the assumptions made by market analysts (or their methods) should lower confidence in the results.

    Consider that IDC specifies 50.2 million Samsung smartphones, implying an accuracy down to 100,000 units. Is this accuracy believable?

    There is reason for doubt.

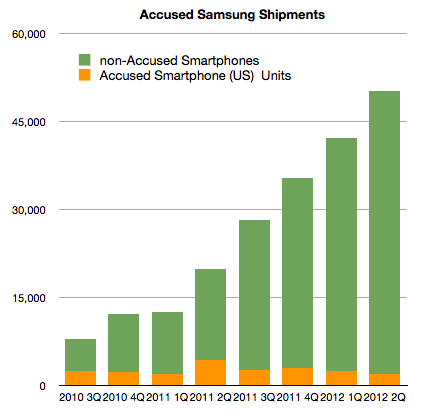
    I start with the following graph:

    It shows the estimates for Samsung global shipments (latter four quarters are estimates without the benefit of company reports.) I separated the component of shipments that Samsung reported as part of its submission to the Samsung v. Apple trial in California. Note that this (orange) segment consists of most US smartphone shipments. It's not all US Samsung shipments. It notably excludes the Note, the latest Nexus and the Galaxy SIII.

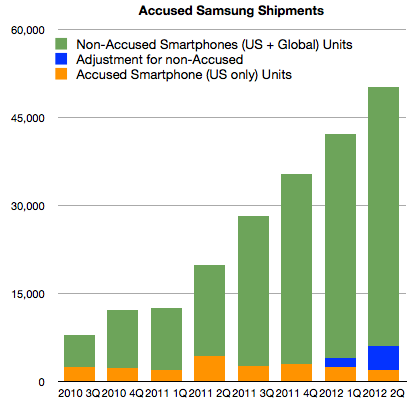
    Without these "non-accused" phones, it would appear that Samsung's US volumes dropped to 4% of global totals from a 10% average[3]. In order to return to 10%, the US totals would need to be adjusted as shown below:


    I added 1.5 million units in Q1 and 4 million units in Q2 (to account for Galaxy SIII).

    So far this seems consistent with the total estimated global shipments of 50.2 million from IDC. US units would result in 12% of global shipments.

    However, there is more data we can test against. First, we are also given pricing for the US phone portfolio, or at least we have revenue per unit sold. This allows us to get an idea of what revenues can be obtained for the smartphones in the US, and possibly world-wide[4]. Knowing prices for smartphones and knowing global sales (which Samsung reports) and finally knowing global total phone shipments allows us to price the average non-smart phone.

    Excluding the non-accused smartphones, the average revenue per smartphone in the US for Samsung in Q2 was $339. Adding in the estimated Galaxy SIII (4 million) at an average price of $470 gives a new "ASP" of $413.

    This is where the analysis goes off the rails.

    If we assume the global ASP is equal to the US ASP and knowing everything else about the mix of smartphones (54% of total) and revenues (as reported) yields a negative ASP for feature phones. Assuming the revenue figure is correct, either the number of smartphones is wrong (50.2 million) or the global ASP ($413) is wrong. The total phone number is also an analyst estimate which can be called into question.

    There are many assumptions being multiplied here so I have very low confidence in the result, but we should ask "what do you need to believe" in order for the 50.2 million figure to be real. The following scenario for example has to be true:

    1. Global Samsung phone shipments total 93 million units (which means 42.8 million feature phones sold as well as the 50.2 million smartphones).
    2. 6 million smartphones shipped into the US, equivalent to about 50% increase y/y, roughly in-line with market growth
    3. 4 million Galaxy SIII shipped (but not necessarily sold through) at an ASP of $450. This results in a US total smartphone ASP of $413
    4. The global smartphone ASP is significantly lower (at 80% of the US or $330)
    5. Global revenues of $18.14 billion is essentially all from phones
    6. Global feature phones will have an average price of $36

    If these conditions are met then it's possible that 50.2 million Samsung smartphones did ship.

    The figure for feature phone ASP is difficult to accept as it would be lower than Nokia's. Also, the low global smartphone ASP is also difficult to accept but it might be possible to find a scenario with the above variables which makes the 50.2 million figure believable.

    Unfortunately this is an unsatisfying analysis. I could propose another figure to answer the question in the title, based perhaps on more "believable" assumptions. But I have no means to defend my assumptions. The only option I have remaining is to caution that the total smartphones shipment estimate for Samsung remains precarious. The new evidence from the US trial places more doubt on it but it is not enough to disqualify it entirely.

    ---

    Notes:

    1. This cone of silence over 93% of the most popular mobile platform is somewhat puzzling in contrast to the perfect information we are used to having about iOS, BlackBerry and even Symbian. It seems that the more open a platform, the less is revealed about its market performance. This extends to the licensed Windows Phone whose shipments are only revealed through Nokia's reporting of Lumia shipments.
    2. In the PC market, vendors also selectively publish their units. The norm is, however, not to. As a result IDC et. al. are the only sources for global market data. However, the PC market can be sampled more easily than the phone market. PC retail measurement methods are more reliable compared with all the points of sale for phones.
    3. Note that Apple sells about 30% of iPhones in the US.
    4. Apple's pricing world-wide is very consistent with pricing in the US which makes sense from a channel management point of view. One would not want to create incentives for cross-border arbitrage of phones.
  4. Measuring iOS as a gaming platform

    Research · 37 comments

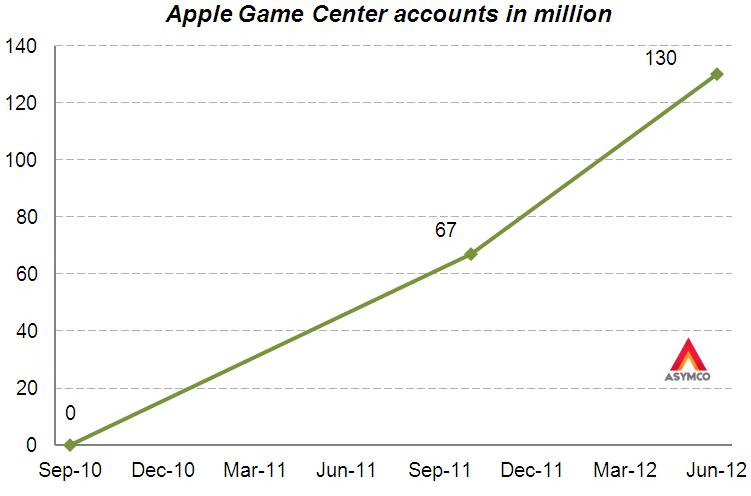
    At this year's WWDC Apple offered an update on Game Center accounts. The data we have so far is shown in the following graph.

    Before being acquired, another network, OpenFeint, announced 180 million iOS accounts in October 2011. Another figure to consider is the 40 million subscribers to Xbox Live (out of 66 million Xbox users). This subscriber base is paying for a service (about $1 billion per year) so it's not the same as the free Game Center model.

    Rather than being a revenue source, Game Center is designed to engage users and to capture usage information. It also lets us gauge gaming "consumption" on iOS devices. That itself allows us to contemplate it as a gaming platform vis-à-vis alternate platforms.

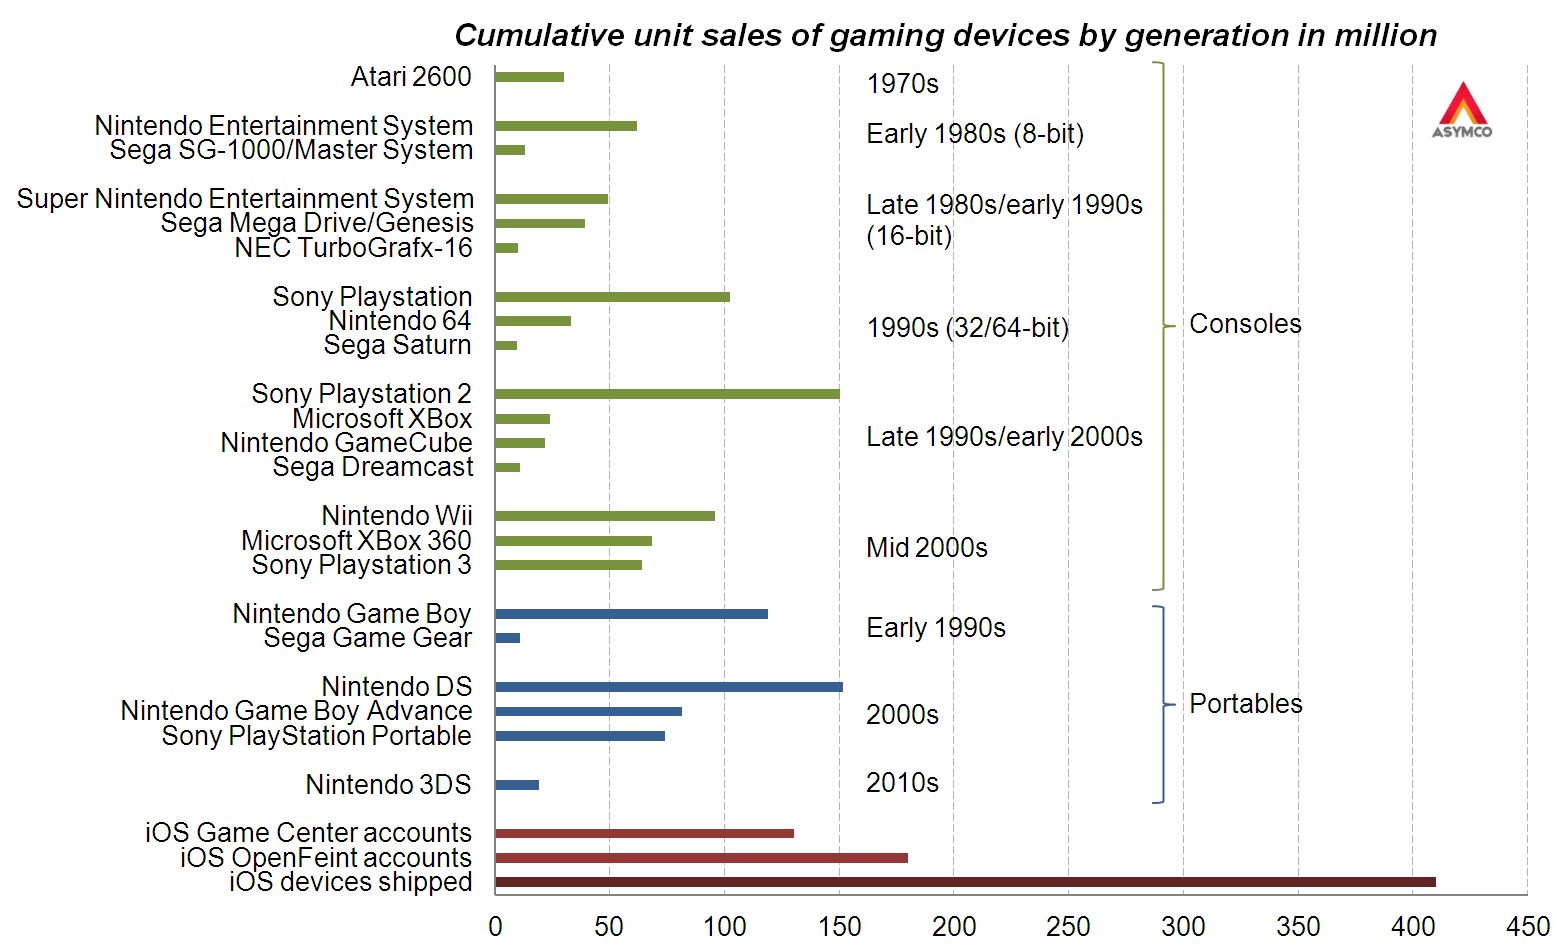
    To consider the figure as a proxy of penetration and engagement, the graphic below shows cumulative sales of gaming devices.[1]

    Here are some observations:

    • There is a pattern of turnover of market participants
    • Each console "generation" had a clear market leader
    • The best-selling gaming device was the Nintendo DS closely followed by the PlayStation 2 [2]
    • Considering the 130 million Game Center accounts, iOS is already the third largest gaming platform
    • Furthermore, considering the OpenFeint iOS figure of 180 million accounts announced in 2011, iOS has already surpassed the cumulative sales figures for the Nintendo DS
    • No gaming device has ever reached the 200 million mark
    • At the current growth rate the number of Game Center accounts will surpass 200 million before the year end

    Apple cites the number of games, downloads and payments to developers as evidence of ecosystem health and growth. The figure of Game Center accounts is yet another indicator. It shows growth in and of itself, but it also has the side effect of offering comparative measurement of performance. That measurement compares favorably with other game platforms.

    The economics are different but they always are when a disruption takes root.

    ---

    Notes:

    1. Based on reported cumulative sales (Wikipedia), excluding gaming devices with less than 10 million cumulative sales (excludes for example PlayStation Vita), excludes also “home computers” due to missing reported figures
    2. This Wikipedia article contradicts the previous.
  5. The biggest loser

    Research · 37 comments

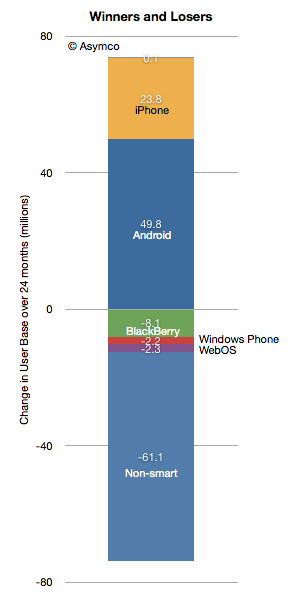
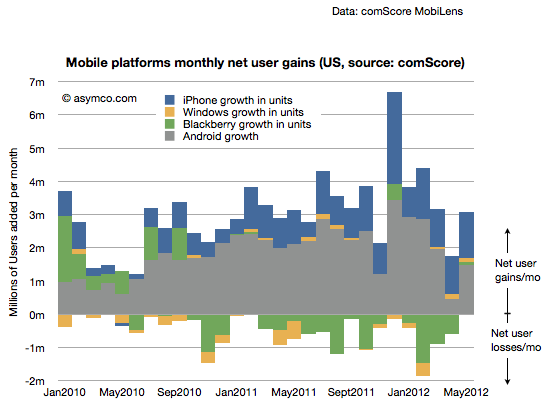
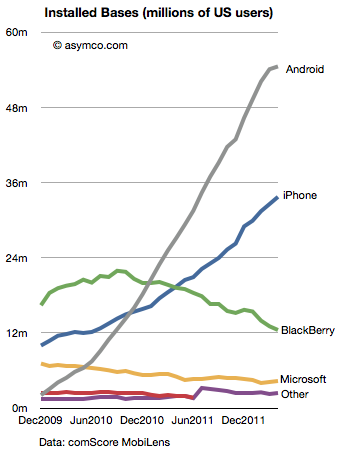
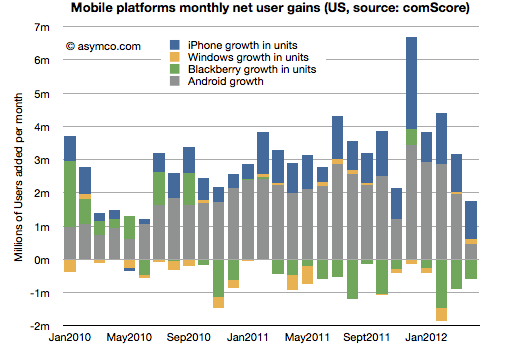
    According to data from comScore, in the past 24 months 50 million Americans became Android phone users. In the same time frame Apple added 24 million iPhone users. As I mentioned in my Asymmetric Competition post, it would be unwise to consider this data in isolation. Consider the following graph showing the net change in users in the US.

    Android and iPhone grew mostly at the expense of non-smart users. The BlackBerry lost 8.1 million users and all the others only lost about 4.5 million.

    With penetration at 50% it's still impressive that there is so little "churn" between platforms. In fact, measuring churn as the net platform user loss as a percent of all smartphone users, we get something less than 1% per month.

    The smartphone competition is still primarily with non-consumption.

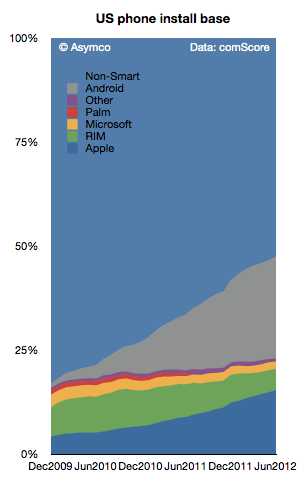
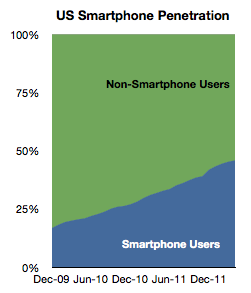
    That will change at some point when smartphone penetration (shown below) will begin to saturate. The basis of competition will have to shift from converting non-smart users to converting users of other platforms while maintaining one's own user base.

    The market has not experienced this sort of rivalry on a wide scale. The defections of BlackBerry and Symbian users are relatively rare events.

  6. Asymmetric Competition

    Research · 57 comments

    Thanks to Angel Lamuno for sending me to a dry and boring lecture by Dr. Israel Kirzner from Feburary 1988. It got me thinking again about competition and how confusing it can be.

    The lecture was in part about how the word "competition" is used by economists with directly opposing meaning from that of the layman and how that leads to confusion about the role of free markets.

    I won't dwell on that, but instead I want to explain how this word can also be contradictory in meaning when applied in everyday usage in business analysis. Nowhere is this more evident than when we argue whether Apple competes with X or Y or Z.

    Does Apple compete with Android or Google or Samsung? How could Apple compete with Google and yet cause it to be the default search engine in Safari thus enriching their competitors? How could Apple compete with Samsung and yet select their semiconductors for the heart of its most important and profitable product? And how could the people across the table from Apple agree to terms on these deals while being sued by them?

    Some have tried to characterize this situation as "coopetition" or the co-habitation of conflicting strategies for a balanced optimum. I find this characterization uncomfortable and unsatisfying. The balance sought will be very fragile and change daily and no optimization is practically possible. It seems contrived.

    Rather, I think about these situations as examples of asymmetric competition. This is competition where companies are rivals but they have different definitions of the basis of competition. In a way, they are like gladiators who have weapons which cannot be brought to bear or wielded effectively to counter the opponent's.

    Consider the following question: does the iPhone compete with the Galaxy SIII? Well, obviously it does. The products have similar attributes. If we define competition as rivalry in a market for similar products then, by default, they compete.

    But what about non-consumption? What if there aren't enough of either product to go around and people cannot actually face a purchase decision where both products are in front of them at the same time, under identical terms and conditions, waiting for a purchase to be made.

    It gets worse. What if there are network effects related to each product such as brand loyalty, platform switching costs, media and data tied to either one that make them impossible to switch? What if advertising spending is skewing the buyer's knowledge of competing products?

    If a product is unavailable, invisible or requires burdensome switching, does it really compete? When these exceptions are raised, you'll hear people say that Apple (or Samsung) don't compete with X or Y. They compete with themselves or with products outside the category. There may be many ways of rationalizing that  what appear to be similar products don't compete because of "differentiation" or "positioning".

    In fact, jobs-to-be-done theory suggests that the only successful competition is against non-consumption, especially if you're an entrant. Non-consumption is easy to beat (because the alternative is no solution to the job) while an entrenched incumbent is very difficult to beat, and it's often inefficient to even try even if you have the resources. This is what I describe in talks as the "David vs. Goliath" approach vis-à-vis the "Charge of the Light Brigade" approach.

    So the theory that competition exists on the de-facto basis of a similar feature set fails a whole series of tests in the real world. Consumers decide based on complex criteria and businesses actually conspire to make the choices as complex as possible reducing the decision to a single option.

    But I want to step back and think about the situation from the competitors' point of view. In other words, how should management think about competition? Is it possible to develop a competitive strategy or should one even bother with competitive response?

    Let's take a basic question: Does Apple think of Samsung as a competitor? When did it begin to think about it as such? What can it do to win?

    Let me answer this by asking another hypothetical question. Assume it's 2008 and Apple is in the process of planning its product roadmap. Whom would they decide to count as competitors? Android devices have not yet shipped and the gorilla in the space is the BlackBerry with Symbian still overhanging the market with a huge volume lead. Should they then build products to compete with RIM and Nokia?

    Assume further that their decision will define how developers will build apps and content makers will target your product. They have to account for the time scales that developers think about and they have to match hardware innovation to the rate of OS innovation and API innovation and toolchain innovation, etc.

    So did Apple consider Samsung a competitor in 2008? A time when Samsung did not actually make smartphones? It seems hard to believe they did. Now you may answer that things have changed since 2008 and they have. But the decisions made in 2008 regarding the platform remain in place today.

    Furthermore if you happen to look at the dozens of hardware designs that are making the rounds today (as evidence for a trial with Samsung) you'll see familiar designs first penned in 2004 or 2006. You quickly realize that the product design process is lengthy and largely isolated from the froth of main street (or mall) sales fistfights.

    Few people appreciate the disconnect between the design process and competition. This because few people have spent time in an organization building mass market consumer phones. The time scales are staggering. If your product is a platform product you make decisions six years in advance. If you are a "fast follower" you can make decisions six months in advance. This is maddening, asymmetric competition.

    One competitor sees one basis of competition and another sees it completely differently or sees a completely different basis. They are competing with each other but more as a guerrilla fighter competes with a nuclear missile.

    Which brings me to another discipline. In military circles asymmetry has been noted as a valid form of warfare for some time. At least since 1975. It was in use long before it was recognized or studied, (e.g. in the American Revolution.) But the situation now exists where it's taken for granted that modern conflicts are almost always asymmetric. Drones vs. insurgents and citizens vs. armor and, the most sinister of all, unarmed-but-tightly-integrated-through-communication protest against established regimes. The impact of this realization is affecting governments around the world.

    So it's time to elevate our thinking about business competition along the same lines. Yes, Apple competes with Samsung but it does so asymmetrically (as it does against Google and dozens of others). It's a multi-dimensional rivalry and one which requires a different form of analysis. It is something which I do instinctively but it's not something that is easily explained. Disruption theory helps. It turns out that asymmetric competition is the only form of competition that matters in a rapidly disrupting industry.

    It is also why this site is called Asymco.

  7. How many Lumia phones were sold in the US?

    Research · 159 comments

    Nielsen and comScore survey US consumers through different methodologies, however they both try to paint a picture of the smartphone patterns of ownership and consumption.

    I regularly report on comScore's data as it's published on a monthly basis. Nielsen offers updates on a quarterly basis but there is more detail.

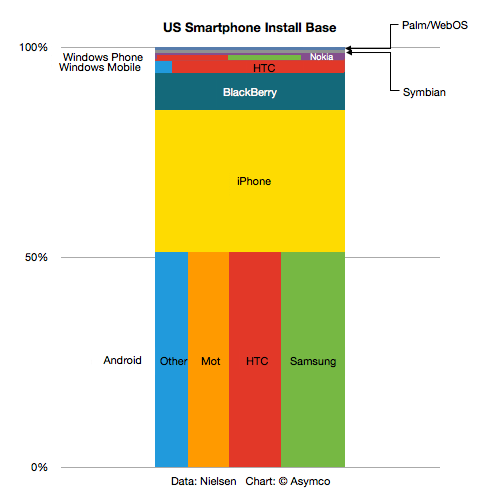
    The latest report (for Q2) shows smartphone shares by both platform and vendor. The following graph is a treemap built with the Nielsen data:


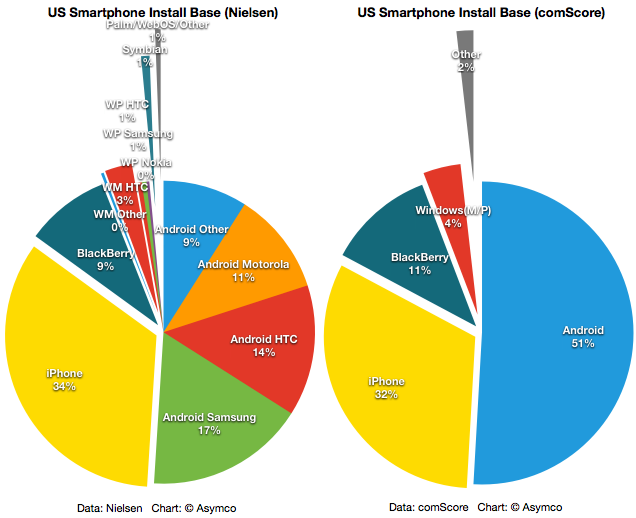
    The same data is also plotted below as a pie chart:

    I also added the latest comScore mobiLens data in the pie chart to the right.

    Note that both surveys agree in the main on the largest platforms. The difference seems to be within a reasonable margin of error. The details available in the Nielsen data are perhaps also interesting. The various Android OEM shares as well as the division between Windows Mobile base and Windows Phone (7) base could provide some insight. Nielsen's total Windows base adds up to 4.5% while comScore reckons on 4%. Within that total, Nielsen breaks out 3.2% for Windows Mobile and 1.3% for Windows Phone. Within the Windows Phone total, HTC and Samsung are shown as having 0.5% and Nokia 0.3%.

    If we then use comScore's figure for total smartphone users (110 million) then the data would suggest that there are 330k Lumias in use in the US. This would have been accummulated over a sales period of about four months.

  8. Building and dismantling the Windows advantage

    Research · 328 comments

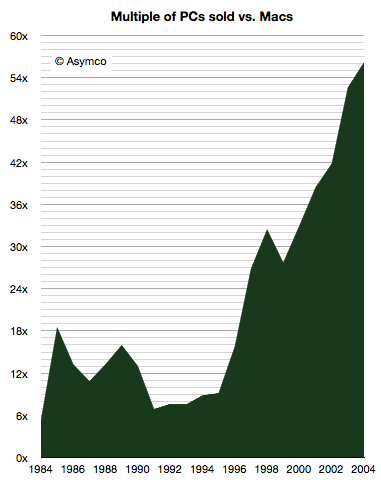
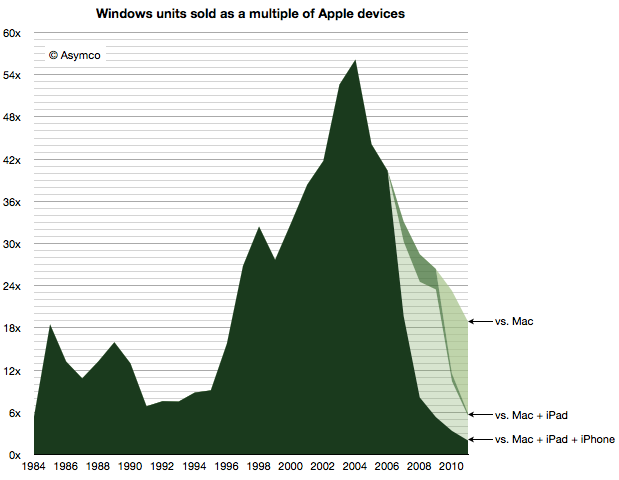
    When the Macintosh was launched in 1984, computers running the MS-DOS operating system were nearing a dominant position in the market. Having launched in 1981 as the IBM PC, they were quickly cloned and four years later "PCs" were selling at the rate of 2 million/yr.  The Mac only managed 372k units in its first year.

    In other words, PC was outselling the Mac by a factor of nearly 6. It turned out to be a high point. The ratio by which the PC outsold the Mac only increased from there.

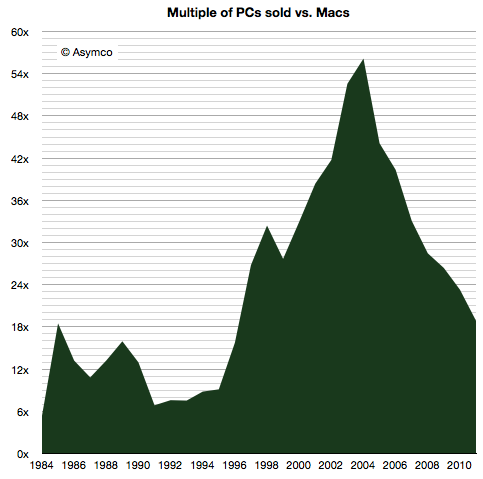
    When Windows 95 launched in 1995 it negated most of the advantages of the ease of use of the Macintosh and the PC market took off. The ratio reached 56 in 2004 when 182.5 million PCs were sold vs. 3.25 million Macs.

    During the second half of the 90s it was already clear that Windows won the PC platform war. Windows had an  advantage that seemed unsurmountable.

    I should point out that this ratio between platforms is not just an exercise in arithmetic. It's a measure of leverage. The advantage of dominance is realized in an ecosystem which creates lock-in and additional economies in marketing. Ecosystems become self-perpetuating and there is a tendency toward monopoly. The stronger you are, the stronger you get.

     Then, in 2004, something happened.

    Although PC volumes continued to grow, they did so more slowly and the Mac grew faster. What coincided with this was the emergence of portable computing. The MacBook became easily differentiable as a "better" laptop. It was not faster, did not have more storage or any key metrics being used to sell PCs. It was just better as an integrated product. The integration manifested itself through a sense of quality and robustness as well as intangibles like aesthetics and "feel". I wrote about this a few years ago.

    As a result the Mac began to whittle down the advantage Windows had. The ratio  of Windows to Mac units shipped fell to below 20, a level that was last reached before Windows 95 launched. It's as if the Mac reversed the Windows advantage. This was an amazing turnaround for the Mac.

    But the story does not end there.

    If we consider all the devices Apple sells, the whittling becomes even more significant and the multiple drops to below 2. Seen this way, Post-PC devices wiped out of leverage faster than it was originally built. They not only reversed the advantage but cancelled it altogether.

    Considering the near future, it's safe to expect a "parity" of iOS+OS X vs. Windows within one or two years. The install base may remain larger for some time longer but the sales rate of alternatives will swamp it in due course.

    The consequences are dire for Microsoft. The wiping out of any platform advantage around Windows will render it vulnerable to direct competition. This is not something it had to worry about before. Windows will have to compete not only for users, but for developer talent, investment by enterprises and the implicit goodwill it has had for more than a decade.

    It will, most importantly, have a psychological effect. Realizing that Windows is not a hegemony will unleash market forces that nobody can predict.

  9. At 50% penetration the US smartphone market is not showing signs of saturation

    Research · 61 comments

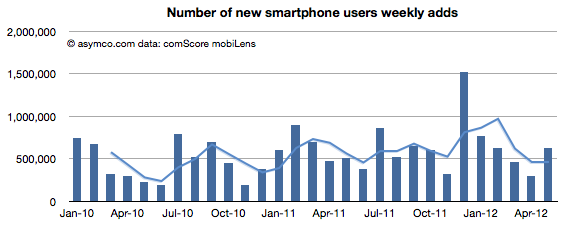
    According to comScore, as of end of May,  the ratio of consumer phone users in the US (aged more than 13) who use smartphones as their primary phone has reached 47%.

    The question is whether this is reaching saturation. My guess has been that saturation will be at levels well above 80%. The data shows that during May the rate of smartphone adoption (first time users) was 630k/week. This number is a good recovery to above the historic mean indicative that saturation is not yet in effect.

    50% penetration will happen this summer. A year ago the predicted "tipping point" date was also the same: August 2012.

    The platform shares data is also returning to a historic consistency. A month ago I asked if there was "trouble with the robot"  because Android net adds dropped to a level unseen for two years and the decline in net adds had been going on for four months.

    This last report shows a recovery in Android net adds to about 1.5 million new users.

    [Note here too that there is no sign of saturation: The net user gains are far above net user losses. Even BlackBerry showed a gain. In a market where there is saturation, net gains and losses among platforms would balance each other out.]

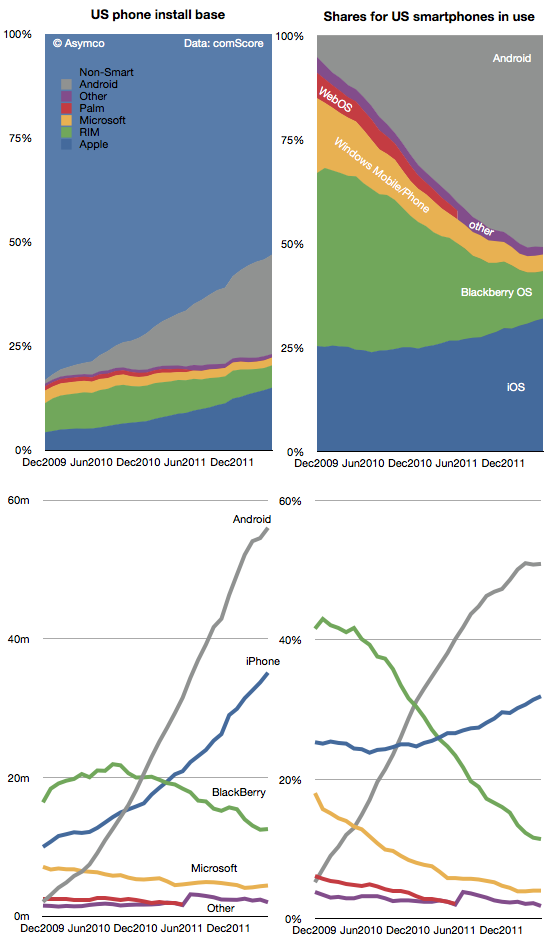
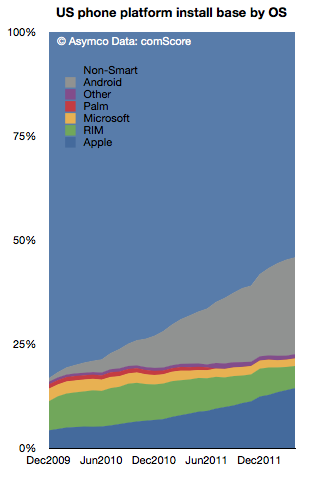
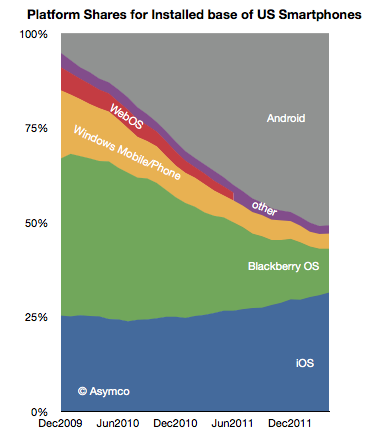
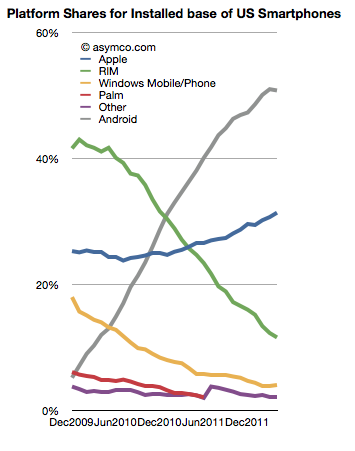
    In terms of share, Android shows two months of no growth. The following charts show the history of platforms in terms of share and actual units in area and line charts.

    I'd say the jury is still out on whether Android has "peaked" in the US. Globally, the rate of additions seems to still be increasing but in the US we might be seeing the effect of upgrades as many first time Android buyers are reaching the end of their contracts. iPhone and Android "purchase rates" are already at parity but the install base might take some time to converge.

    With half the population still not using smartphones, there is still headroom for the platforms, but the inter-platform dynamics are becoming very interesting.

  10. RIM's tailspin

    Research · 63 comments

    The number of BlackBerry phones sold fell 41% year-on-year in the last RIM fiscal quarter. Sequentially the fall was 30%. Though surprisingly poor, I note that Nokia's smartphone business fell even more dramatically last quarter (down 50% y/y and 39% sequentially). LG also saw a 44% decline in unit shipments in Q1.

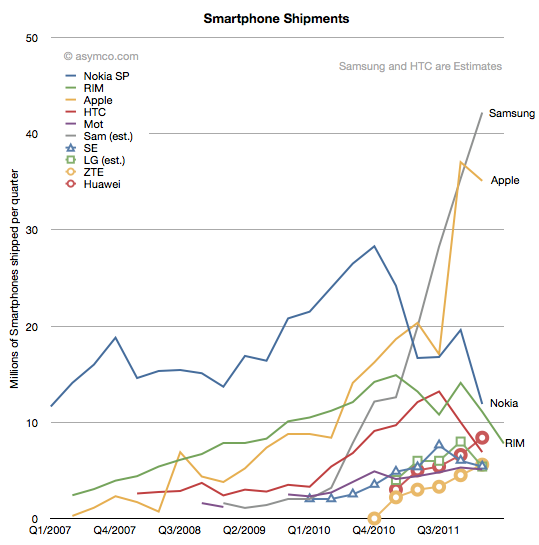
    The history of smartphone shipments for the largest vendors is shown in the following chart:

    From forecasts made by Huawei it's probable that they overtook RIM in the last quarter, dropping RIM to 5th or 6th ranked vendor in smartphone units.

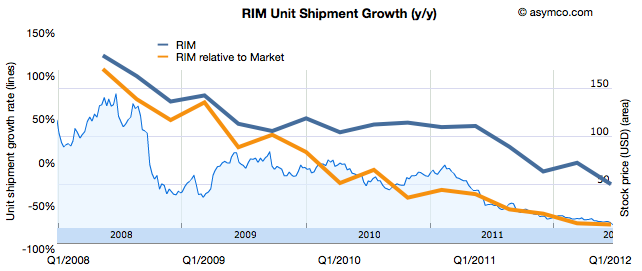
    RIM's 7.8 million units is the same level of sales as it had in early 2009. The total market was only about 250 million units per quarter then. It's around 400 million today. A quick calculation shows that RIM's smartphone market share has fallen from a peak of 22% to about 6%.

    RIM's stock performance reflects this performance relative to the market.

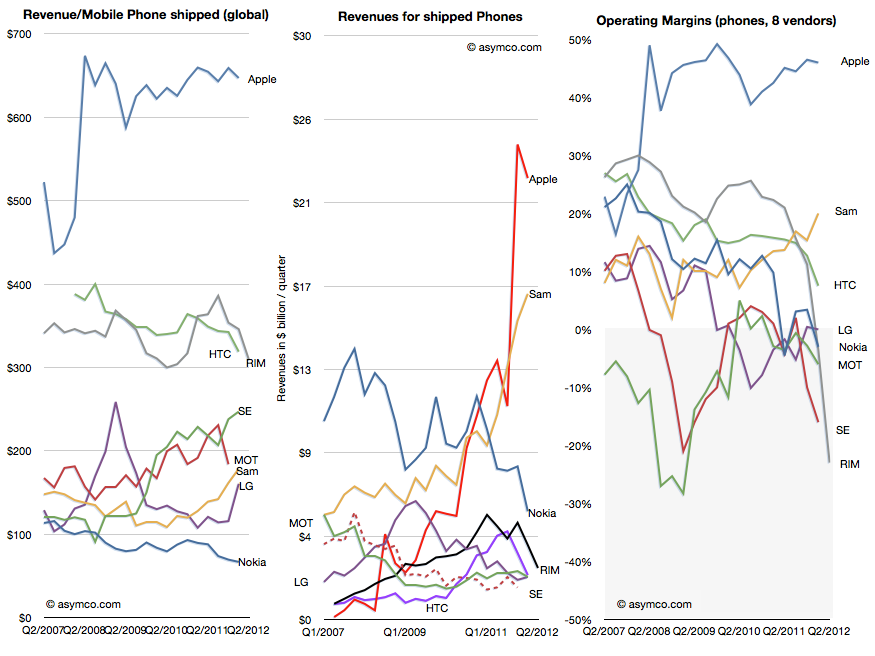
    Hardware revenues were $1.652 billion. Matt Richman calculates the average hardware revenues for the BlackBerry of $203. I include service revenues in my ASP calculations (for Nokia and Apple these are also significant values) yielding $309 per BlackBerry. The history of total revenues, revenues per phone and operating margins are shown below relative to competitors.

    Operating margin tells the most sobering story. As I've often repeated, historically no company has survived dipping into the grey zone.

    To reiterate, the logic of irrevocability in this industry is as follows:

    Success depends on three conditions being met by the vendor's products:

    • consumers trust the platform's promise
    • operator see the product as creating value to their core business
    • developers offer investment to innovate on top of the platform

    If all these factors are present, the vendor enjoys a virtuous cycle of growth. If any of these is lost, the others are also likely to be lost as well creating a vicious cycle of decline.

    Loss of operating margin is an early indicator that at least one condition is not met. Usually, a failure of consumer trust leads to a drop in purchases which leads operators and distributors and retailers to flee and then developers defect.

    It's been impossible to recover from this tailspin so far. There is a procedure which works in theory: accelerate downward by investing in a new platform. The move is counter-intuitive but essential in re-building trust, quality and relationships.

    However, the reason it does not work in practice is that this struggle is not with gravity alone. While spinning downward, the company is also subject to competitive attack. Competitors fill the void and take customers into locked-in ecosystems. There is neither the time nor the ability to defend.

    Cash runs out and customers are divided up between the survivors. Nokia and RIM face this scenario today.

  11. Trouble with the robot?

    Research · 102 comments

    The latest data from comScore showed a few surprises:

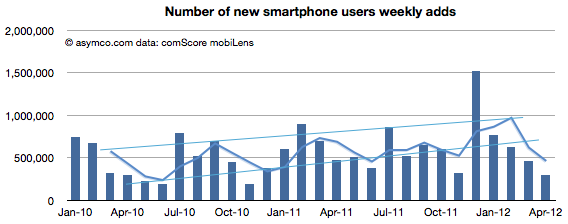
    New smartphone users dropped to a very low level, below the trend line.

    Slightly less than 300k new smartphone users abandoned their feature phones every week during the month. Compared with the 1.5 million per week in November, it's quite a slowdown.

    Penetration growth slowed as a result as well. Only 1.3 points of share were gained by smartphones.

    It's still likely that the penetration will reach 50% by the end of summer this year (as was predicted in 2010).

    When looking at the picture above broken out by platforms, we see signs that the slowing in smartphone growth seems to be attributable to a slowing in Android adoption:

    Here are the installed bases in users over time of the different platforms:

    The share of users of the platforms is shown below, first as a stacked area:

    And also as a line chart:

    This last chart shows the first time when Android share dipped sequentially. It should be watched closely as an indicator of a change in market dynamics. As we reach saturation, the basis of competition will change.

    Finally, the last chart shows net user gains for the platforms.

    Here again we see the lowest user growth for Android since 2009 (and hence since it reached mainstream distribution.)

    It's perhaps too early to suggest that we're seeing a slowdown in the US for Android. Perhaps there will be a return to growth in the fall. The concern has to be that rather than seeing the net adds growing--as they have for two years with only two contiguous months of decline--Android net adds have been falling for four months.