Asymco

Asymmetric Intelligence

profit

  1. How much do maps cost and what are they worth?

    Research · 68 comments

    How much does it cost to have the world's best maps?

    The answer may seem simple: $8.1 billion.

    That was the cost to Nokia in cash for buying Navteq in October 2007. It would seem that buying that asset (or another one like it) is a cut-and-dried solution to anyone needing a mapping "solution". But it's not an answer that is either complete or explanatory of how mapping solutions are valued.

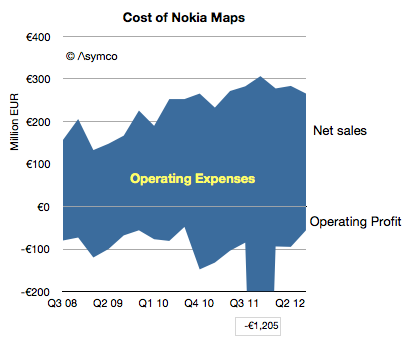
    Navteq was not priced as a database for an app. It was a business which was expected to create licensing revenues and profits[1]. The actual price for this business net of cash was $7.7 billion but the following graph shows the net sales and operating profits since Nokia began reporting its performance:
    Screen Shot 2012-12-18 at 12-18-3.13.12 PM

    The blue area represents the difference between sales and costs and hence the operating expenses--the payments needed to "keep the lights on".

    These total expenses over the 4.25 year time frame totals €6.5 billion. The total operating losses equal €2.6 billion. Therefore, as far as Nokia's shareholders are concerned, they paid $11 billion for Nokia maps, to date.

    What do they have to show for it?

    Nothing. The entire company is now worth only about $15 billion. It's hard to imagine maps being worth 73% of Nokia. What Nokia hoped to get for the product was some value in its devices. As other issues intruded, that value has not been realized. Nor has any external licensing revenue been realized. Net external licensing revenues are actually decreasing.

    The situation looks even even uglier when the maps asset can be seen as costing €1.5 billion every year. Why would anyone want to be in this business?

    I bring this up because, apparently, everyone wants to be in this business.

    Via Twitter I received a suggestion (rumor?) that Google spends about $1 billion every year for maintaining their maps. (Using a conversion from Euros to Dollars yields a Nokia maps burn rate of nearly $2 billion/yr.) Furthermore, there seems to be a burning desire for Apple to also burn this money.

    If so, then Apple might have to start spending $1 to $2 billion/yr to merely maintain a data set. That would be a minimum of an additional 7% in operating expenses.

    Why would they do that?

    If Apple cannot buy or license quality data, there may be no choice. Maps have become a hygiene factor for a platform. Not having them makes a platform repulsive but having them offers no attraction.

    Another way of looking at the maps asset is like a component in a phone. A vendor needs a certain class of processor, memory or screen or battery. Not having a minimum level of functionality makes the product uncompetitive but having it does not guarantee success.

    What's worse, the market may have been cornered—there may be no suppliers. Unlike hardware components, the maps component is not a commodity with a market of suppliers. The work needed to maintain the maps is a commodity but the aggregation and consolidation of the data is valuable and those who have gained control over the data and they are not likely to license it to any competitors for strategic (i.e. political) reasons.

    So we have a perverse situation of a very costly, unprofitable asset requiring duplication of maintenance effort by politically motivated actors imprisoned by their own strategic interests.

    If so then it fits perfectly with the mobile telecom industry. Like mobile networks, maps are very expensive and worth very little.

    ---

    Notes:

    1. The revenues that Navteq was obtaining during the 2008/2009 time frame included that from customers such as Verizon, Garmin, Advertising, Traffic services, Microsoft Windows Live services. For the six months ended on December 31, 2008, Europe accounted for 44% of NAVTEQ’s net sales, North America 43%, Middle East & Africa 8 %, Asia-Pacific 2 %, Latin America 2% and Greater China 1%.

    —

    If you want to learn more about how to analyze technology industries and the evolution of value chains, consider participating in Asymconf.
  2. The cost of selling Galaxies

    Research · 234 comments

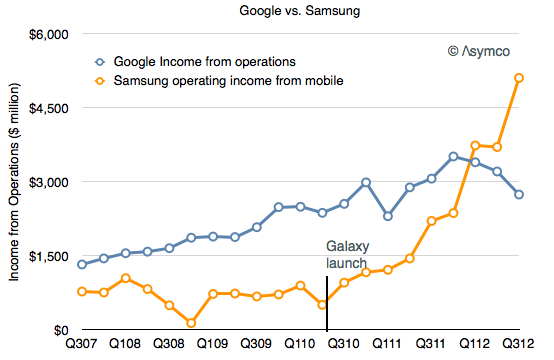
    In the post "Google vs. Samsung" I compared the profits of Google and Samsung Electronics' mobile (aka Telecoms) division. It showed how Samsung has grown its mobile business to such a degree that, if sustained, could conceivably influence the way Android is controlled.

    However, we should not analyze Samsung's mobile group in isolation of the entire company. Samsung relies on internal transfer of technology and capacities of production which are quite unique for device vendors today. In other words, Samsung is a relatively integrated enterprise. Understanding the whole is necessary before understanding the part.

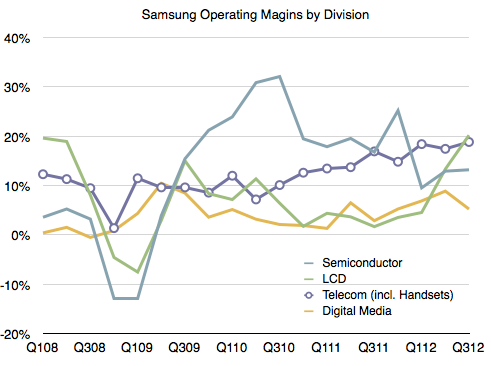
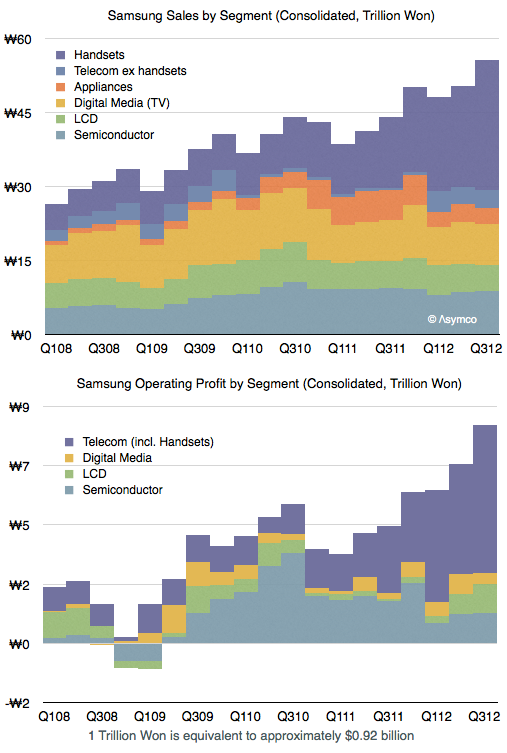
    The following graph shows the sales and operating profit for  Samsung Electronics as a composite of its divisions since early 2008.

    As one would expect, the mobile group (Telecom) is the source of both top and bottom line growth. The group has also been leading in terms of margins and increasing those margins steadily. 

    The margins averaged 11% during 2007 and 17% during the trailing four quarters. This 54% increase in margin has been matched by a 55% increase in average selling price (from $151 in 2007 to $234 in the latest quarter).

    One could argue however that a 17% operating margin from a group that is now leading in volume and price is still a bit weak. At its peak Nokia enjoyed a 25% operating margin, RIM 30% and HTC 27%. Apple's iPhone operating margin is around 45%.

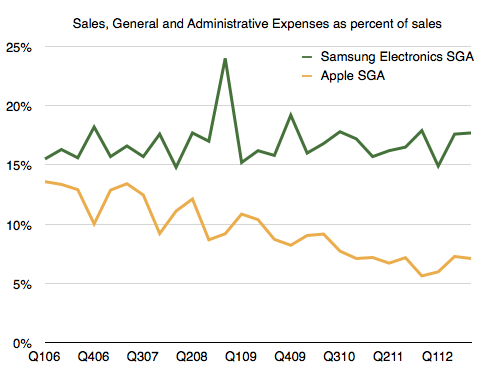
    I think a large part of the margin story is a relatively high level of spending on SG&A (Sales, General and Administrative) which includes advertising, sales promotion and commissions. In the case of Samsung Electronics, as sales has grown these expenses have grown in proportion. As a percent of sales SG&A have held relatively steady at around 17%.

    Note that as Apple's sales have grown its SG&A has grown less rapidly resulting in a smaller percent over time. We might see Apple's SG&A drop to 5% during the present quarter, an all-time low.

    So one of the more remarkable aspects of Samsung's success has been their willingness to increase promotional spending. Considering that their other divisions don't require as much "marketing expense" (semiconductors, LCD certainly, and TVs and Appliances to a lesser degree due to a smaller sales growth) we can imagine that the vast majority of this promotional spending has been in support of their mobile brands, Galaxy in particular.

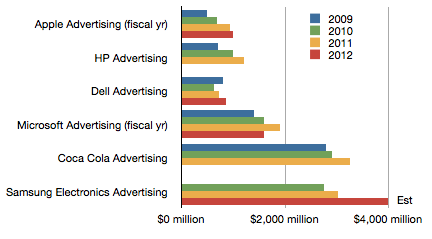
    In fact, we can obtain advertising spend data from annual reports.

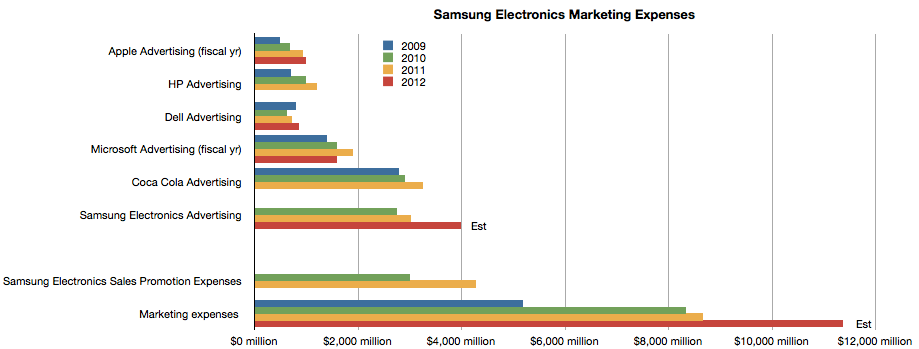
    The chart above shows comparable ad spending from a cohort of technology companies as well as Coca Cola and Samsung Electronics.

    It might be surprising to note that Samsung spends considerably more than Apple and Microsoft. But it also spends more than Coca Cola, a company whose primary cost of sales is advertising.

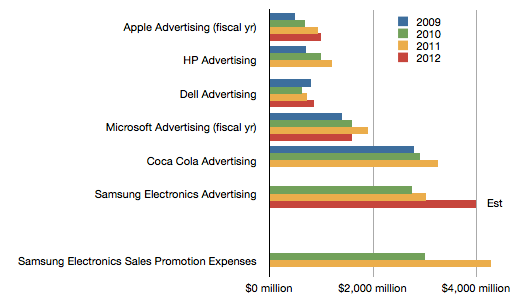
    However, advertising is not the only form of promotional spending. Samsung also pays commissions and "sales promotion". The following chart shows the value of these sales promotions relative to the ad spending budgets above.


    We don't have data on the current year since that is released after year's end, but it's interesting to note that promotions cost more than ads, which themselves are substantial relative to other companies.

    The company also reports "Marketing Expenses" every quarter[1]. These figures appear to be the sum of Ad spending, Sales Promotions, Public Relations and a portion of "other" expenses as a part of SG&A.

    When considering all marketing expenses, Samsung Electronics' sales efforts begin to look quite astonishing.

    ---

    Notes:

    1. The data used in the latter three charts are available as a Google spreadsheet here.
  3. Google vs. Samsung

    Research · 283 comments

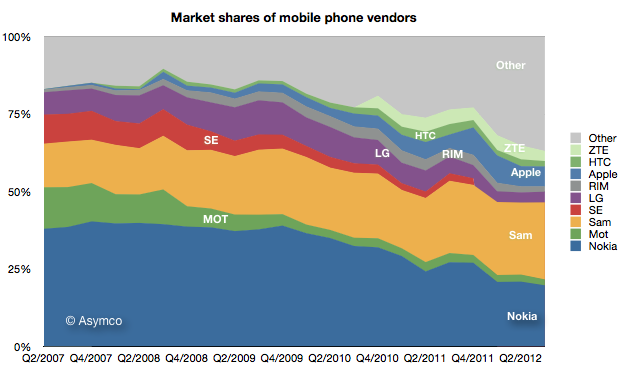
    Samsung's recent success in mobile phones has been spectacular. It overtook Nokia for the top spot in overall unit sales. 

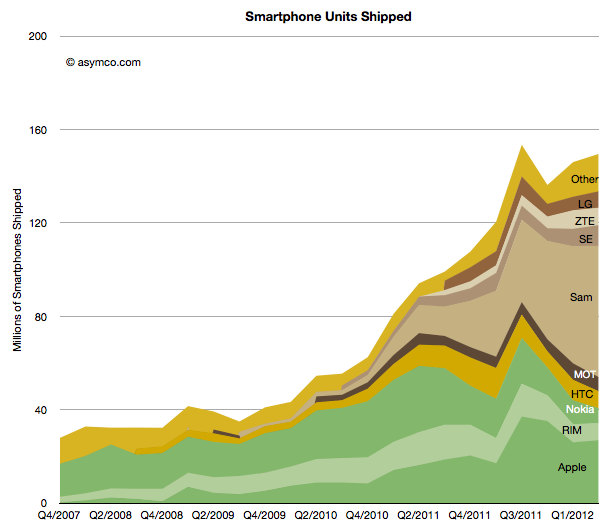
    It went from having almost no smartphone sales to selling over 50 million units per quarter in a matter of two years.

    It now accounts for nearly 40% of all industry profits.

    A key decision which made this success possible was to shift its portfolio to smartphones and to offer a large variety of such phones.

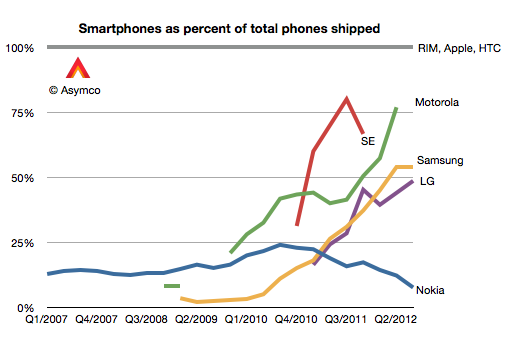
    In Q1 2010 only 3% of the phones Samsung sold were smartphones. In the latest quarter the ratio was 54%. 

    As a result the average selling price more than doubled, from $115 to $234.

    Profit margins also soared in proportion: from 12% to 21%.

    All this plus an overall growth in volumes from 64 million to over 100 million per quarter has meant that the company is raking in enormous profits. Not only did it overtake Nokia, the market share leader for 14 years, but is making more profits than Nokia ever did.

    So much profit in fact that it has overtaken Google's decisively.

    The reason I point this out is that Samsung's success is dependent on having ridden on the back of Android. Samsung's ascent can be precisely timed to their adoption of Android. The groundbreaking Samsung Galaxy launch was the Galaxy S which shipped in June 2010.

    Meanwhile, indications are that "mobile" is causing a contraction in Google's margins.

    If nothing else, Android has created a very interesting industry. There are many questions of course: Is Samsung's trajectory sustainable? Why aren't there other vendors successful with Android? Why isn't Google successful with Android? Why isn't Google's Motorola successful with Android? What would happen if Samsung soaks up so much profit from mobile that it's in a position to acquire Google and control the trajectory of their enabling platform?

  4. The omnivorous app

    Research · 67 comments

    Marc Andreessen famously coined the phrase "software is eating the world." It's an apt observation. If you look back on the history of computing you're likely to measure computers sold or devices sold or users harvested or productivity gained. These things are measured because they can be measured. But the greatest cause of value created and captured has been the development of software. An ephemeral product whose value is often ignored in analytical discourse.

    Software is not easily measured and it's not easily valued due to its intractable nature. Firstly, because businesses that make software tend to have weird cost structures--absurdly high fixed costs and operating margins: They operate without income for years and then suddenly are massively profitable with a minimal set of resources. They have a non-linear, "big bang" trajectory.

    Secondly, software companies tend to capture revenues from something other than the direct sale of the good. Software is rarely sold. Services sometimes are sold on the basis of software but more likely audiences for services are sold to a set of bidders, or revenue is obtained in even more circuitous ways.

    Thirdly, because there are curious multi-sided markets for software platforms. Charlie Kindel hints strongly at how difficult it is to understand the dynamics of software platforms. There is the prospect of lock-in of users and data. There are relationships to nurture with developers and there's the principle of an ecosystem that creates network effects. The virtuous/vicious cycles are non-linear and unpredictable even for the experts who have been at it for decades (e.g. Microsoft).

    Given these difficulties, software is seldom seen as the core value proposition for a particular business. But make no mistake about it, Apple, Google, Microsoft, Facebook and Amazon are all software companies. They "monetize" or integrate software differently but software is causal to their profits. Their use of software has also made them all disruptive. Software enabled the disruption of consumer electronics, retail, computers, advertising and broadcast media.

    But we have not seen anything yet. There is another class of software that is poised to lay waste to a new set of industries. The lowly app coupled with cloud-based services[1] is the termite that is set to eat the foundations of the largest of the industries still standing.

    Consider the following:

    • Games. A software industry in itself, the app versions are attracting non-consumers and eventually will get good enough to absorb all  usage and profits. Games merged with "entertainment" concepts will lead to new models of user recreation leading to new global brands that could challenge even Disney.
    • TV. As apps come to the big screen TV will never be the same. Not only will show creators build directly for an audience but advertisers that currently sponsor shows will produce them instead and package the result as an app.
    • Shopping/dining/entertainment/hospitality are changing with location services and with novel "bits to bricks" purchase options (e.g. PassBook). Increasingly services will exploit handheld devices to enable product discovery--the main job retailers are tasked with.
    • Communications. The observation that "phone" is just an app and that messaging can be done in dozens of ways depending on message, relationship, context or even custom is possible because apps conform to the user's needs rather than the user conforming to the tools they get from the network service provider.

    Although these are enormous opportunities in themselves, this is in addition to several industries that are already crumbling (photography, book publishing, to name two).

    I don't need to rely on prose alone to make the point. A graph can also lend a hand.

    Consider that Apple's App Store and Google Play together have had over 50 billion installs in less than four years and that the number of users of apps is at least 750 million. Furthermore, consider that apps have moved from a smartphone phenomenon to tablets and even PCs using OS X or Windows. Within one year these software capsules are going to be in use by one fourth of the global population.

    Nothing has this kind of reach or engagement, not even browsers. What makes the app disruptive, even ahead of a browser-based service, is that it includes incentives for developers (or, more precisely, app producers) to get paid and to have a relationship with the buyer. These two value propositions, in isolation or in combination, are available to millions and consumable by billions. The most democratized market that can be imagined. An unbounded set of producers and an unbounded set of consumers and a persistent connection after the purchase with nothing in between them except a payment mechanism

    The world has never seen such an opportunity.

    The consequences are unforeseeable. Apps are a form of software that goes beyond its ancestral "application" as a product and as a business model. It's the software that will take in and assimilate everything in sight.

    ---

    Notes:

    1. I have a simple rule to distinguish between an app and a service. If you have to supply a username and password to an app, it's a service.
  5. How many Kindle Fires were sold?

    Research · 71 comments

    Last September I argued against the potential of the Kindle Fire acting as a low end disruption in the tablet market.

    Now that the first version of the product has reached is end of life, it's time to review the discussion.

    The first problem is finding out how well the product did. Amazon just released a statement that the Fire accounted for 22% of tablet sales in the US in the nine months it was available. The challenge becomes knowing how many total tablets were sold in the US during this time frame.

    Fortunately we know the vast bulk of that total based on the Samsung v. Apple trial. Both Apple and Samsung submitted as evidence sales of the iPad and the Tab product lines in the US. The iPad added up to 16.14 million units (Q4'11 through Q2'12) and the Tab was 540k units. That makes the iPad and the Tab add up to about 16.7 million units. Assuming an additional 1 million units for the other (non-Kindle) total yields an estimate of 22.7 million tablet devices sold in the nine months ending June.

    Applying the 22% claim to that total gives a Kindle sales total of 4.987 million. That's awfully close to a round number of 5 million.

    Since Amazon admitted that they ended production prior to launching a replacement (and presumably did so quite early in order to drain inventory,) then we can safely assume that the original production order was 5 million units.

    Five million Kindle Fire units becomes the first reliable estimate of Kindle sales (based on Apple, Samsung and Amazon supplied information rather than guesses from analysts.)

    So the question now is whether this is consistent with the hypothesis that the Fire is disrupting the tablet business.

    Bearing in mind that this 5 million total was reached with prominent placement on Amazon.com and a loss-leading pricing, I would conclude that this is not an auspicious start for a disruptive product.

    As I argued nearly a year ago, the business model for the Kindle is limited to the footprint of the Amazon franchise, which is small internationally. Amazon itself implicitly admitted that the product was a US-only phenomenon. Further worry comes from the way the company approached production. It was not planning it as a maximization of reach into the market. What they did was order a batch production and then wait for it to be sold through.

    Perhaps Amazon is being patient for growth, but I don't see a hunger for profit in this strategy. We know that Kindle probably lost money at the price charged. Perhaps it's on the order of $40 per unit. Five million units would imply a charge against the business of $200 million. Did Amazon earn a profit on content sales of $40 on each of those five million units? The margins on content sold through Amazon are so low that I have a hard time imagining that Fire users are that ravenous in their consumption.

  6. Are Apple stores overstaffed?

    Research · 45 comments

    ifoAppleStore's Gary Allen alleges that John Browett, head of Apple Retail, felt the stores were "too bloated". He cites "numerous tipsters" that Browett ordered a reduction in the number of employees. As the information on employees and visitors is public, we can quickly test the assumption.

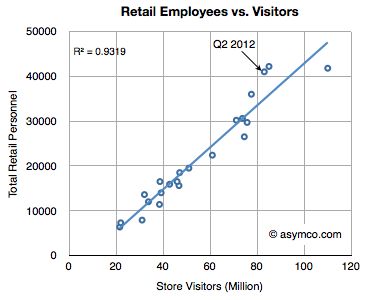
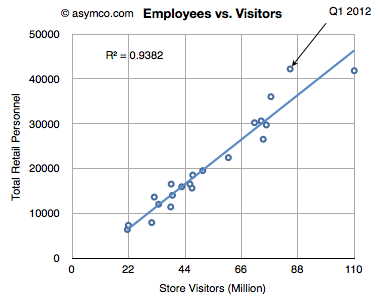
    The following graph shows the relationship between Retail employees and Visitors on a global basis.

    The total figure for the last quarter was 41,000 employees for 83 million visitors. This is above the expected ratio as shown by the line shown in the graph. Reversion to that line would imply that about 35,000 employees should have sufficed during that quarter.

    However, Apple's business is cyclical and employment is not--or at least not on the same frequency of cycle.

    During a slow, transition quarter, there will be over-employment and during a rush holiday period there would be under-employment. Consider the right-most point in the chart. It represents Q4 2011 when there were 110 million visitors and only 800 more personnel than during the last quarter.

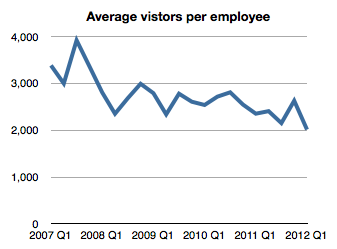
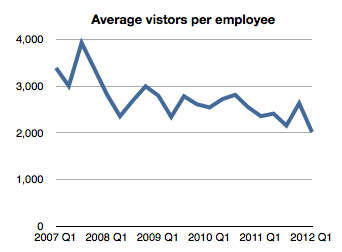
    Overall, this ratio of visitors per employee has been relatively steady, though declining.

    Perhaps the company should check this decline. Perhaps the company has not been able to match demand with supply as well during the last six months. Perhaps they are overstaffed. However, I doubt that there has been a decision to reduce the overall level of service offered. Or that service is not paramount.

    The accusation that employment is being sacrificed for the sake of profits seems disingenuous. The stores were never designed as a profit center. They have to be profitable in the sense that they have to justify themselves. But we need to recognize that they rely on a brand and product mix that is unique to that store. In return, they are designed to sustain that brand and offer a service rather than merely a sales channel.

    For the head of the division to misidentify this fundamental purpose for the operation would be catastrophic and I would expect a lot more evidence to support such an extraordinary claim.

  7. Apple Store Operational Economics

    Research · 18 comments

    In a footnote to my last post on Apple Retail (The face and the brand) I used data on operating performance from Apple and an assumption about employee salaries (which turned out to be low) to estimate that about 7% of Apple store sales are spent on "cost of service" or the operational expenses, which consist of mostly employee salaries.

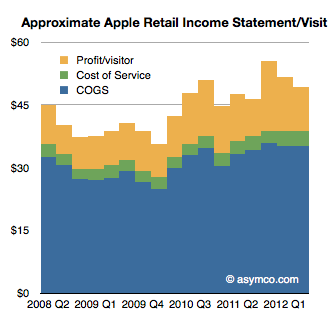
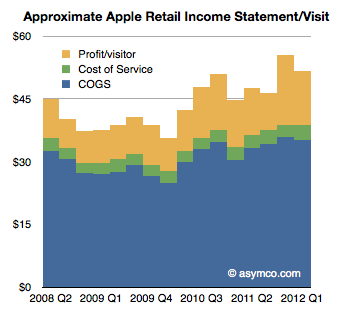
    An updated view of this store income statement (on a per-visitor basis) is shown below:

    To summarize the logic, during the last quarter Apple received $49.2 in store revenues per visitor. Knowing the retail profit ($10.46/visitor) and knowing the time spent per visitor (14 minutes, itself derived from the number of full time equivalent employees--41,000 or 112 per store) and assuming the cost of that time in employee salaries ($15/hr including benefits), gives us an estimate of the service cost ($3.55/visitor) and therefore the cost of goods sold ($35.2/visitor).

    Now I want to focus on this ratio of service cost/sales which turns out to be about 7%[1] and ask whether this is significant or revealing.

    In order to do this we have to understand that most stores, especially electronic goods retailers, don't spend this much on salaries. They do spend quite a bit on commissions however. From a post on the subject, I gathered the following commission rates for various retailers:

    • Phone stores: $25 for activations, 10% of accessory sales
    • Beauty/handbags at department store counters: 3% to 5%
    • Shoes, appliances, electronics: 8 to 10%
    • Furniture: 2% to 6% (low rate includes salary)
    • Real estate: 2.5% to 3% (no salary)
    • Car salesmen: 30% after dealer costs

    Now 7% to 10% that Apple spends on salaries starts to make some sense, economically. It's roughly equivalent to what another retailer might spend out of their sales on the help.

    The difference is that Apple does not pay commissions and that cost is spread over a far larger headcount of staff. Roughly speaking it implies that Apple hires five times as many employees (consider how many people you might see in an Apple store where the average is 112 and in a similarly sized Polo Ralph Lauren outlet) as would be needed to "just sell stuff."

    The trade-off seems to be that Apple will pay a modest wage to a hundred employees rather than a commission to a handful. The trade-off is pretty even since the profits would be the same.

    But they wouldn't be.

    The difference is that what the customer buys is different. Or, put another way, a store bursting with staff is hired by the customer to do a different job than a store filled with a handful of "salesmen".

    Even though the economic ratios are similar, the result is that visitors at an Apple store are made to feel they're getting a service rather than being sold a product.

    And that's the key to there being very many visitors. And, incidentally, they happen to buy more things. And also incidentally they come to value the brand more.

    It also leads to a virtuous cycle. More visitors means more visibility for the store and that leads to more visitors still, and that leads to more employees.

    So a simple decision to hire in proportion of a level of service rather than a level of sales leads to completely different bottom line results.

    That's not to say that this model is transplantable. The entire system depends on having the right goods to sell and the right brand image. But if Apple had all those things and imposed a commission structure in its stores, one can be fairly certain that sales would not be as spectacular and growth itself would suffer.

    ---

    Note:

    1. Again, this is probably quite an under-estimate and the actual cost of service might range up to 10%.
  8. The face and the brand

    Research · 72 comments

    In the five years since the iPhone launched, Apple created a total of 35,852 retail jobs.

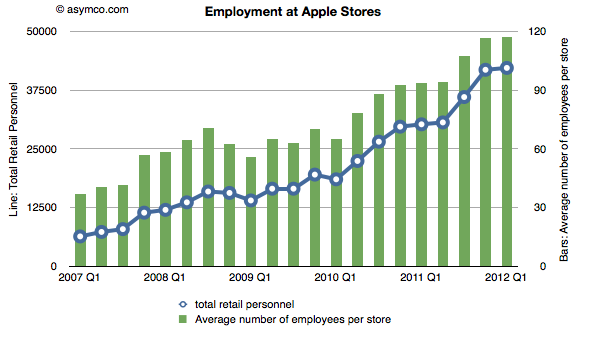
    Some of those jobs came from new store openings. The total store count went from 172 to 361, more than doubling. But the growth in employment was faster: from about 6400 to 42,200, more than quintupling. This is reflected in the total number of employees per store which increased from 37 in Q1 2007 to 117 in Q1 2012.

    Which brings up an obvious question:  Why did Apple triple employment at each store? One could answer that many of the newer stores are bigger, so-called flagship stores. But the vast majority of stores are in mall locations which are of limited size. Flagship stores alone cannot account for the increase. One could also suggest that perhaps the stores are open longer and there is a need for more shifts. Again, the vast majority of stores are constrained by the opening hours of malls which, as far as I know, have been steady. Anecdotally, it's also evident that there are more employees in a store at a given time. There are many more of those colored T-shirts at first glance.

    One hint is in the design changes in the stores. Apple has removed shelving, registers and almost all non-Apple merchandise. It has replaced the visible stock with tables on which rest products that can be used. If there weren't any people in the store, the store would look almost completely empty, just an open space.

    But that's the whole point. The stores are designed to be filled with people. The stores have an open layout because it allows more people to be inside the store at the same time. And the more people the more employees.

    We have the data to prove this: The visitors per store per quarter increased from 125k in Q1 2007 to 235.5k last quarter. Nearly double the number of visitors in five years. It's this increased traffic that is closest tied to the increase in employment. This is illustrated by the following chart:

    Employment is very closely correlated with total visitors. In fact, employment has risen faster even than visitors. By dividing the number of visitors by the number of employees we see how the number has declined.

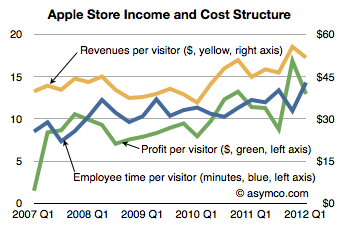
    [If we consider the time an employee spends working we can even guess that the average visit was served by about 14 minutes of employee interaction--this is up from 9 minutes five years ago.]

    If we assume this relationship as causal, then it might be that the stores are "tuned" to ensure a reasonable if not pleasurable experience for the visitor. In other words, the proxy for a "quality" experience is the assistance of an Apple retail employee.

    Taking this a step further, we can perhaps hypothesize that Apple is treating its retail stores as hired to provide a human touch to its products--not just as a service but as a way to listen and help in the most basic way. Steve Jobs once said that Apple no longer had to be present at trade shows because they have millions of conversations with their customers every day through their stores. These conversations happen with the retail staff.

    Through their Apple retail staff, Apple might even be said to be putting a face on their brand. You can see it in the advertising.

    The corollary to this would be that the job of the store is not primarily to sell things. This is confirmed by the fact that store employees are not on commission and there is no sales pressure on visitors. Indeed, the sheer number of employees in a store of modest size (117 employees on an average of about 8k sq. ft.) implies a brazen disregard for the economic orthodoxy of retail efficiency and incentives to sell.

    And yet the stores are astonishingly efficient at selling things. The statistics are off the charts in terms of sales per square foot and overall profitability. Even though this employee time has a cost, revenues and profits have all risen in unison.[1]

    Of course, the products have a lot to do with this performance. Apple stores sell desirable, popular products which are premium priced. But taking these desired products and coupling them with a "human touch" job to be done strengthens the brand as well as expands its volume of sales. It may be that Apple's retail approach could not work with a brand that was less desired. I.e. regardless of a large head count, a Sony store may not see the return on retail investment that Apple gets. Conversely, by not putting a face on Apple's brand the products may not sell quite as briskly. Ron Johnson said on the launch of the iPad that the stores were almost designed for it. Discovery and hands-on time create demand.

    It's as if Apple retail has an inter-dependence with Apple, the brand. One cannot live without the other.

    This is, as far as I know, a unique relationship for a technology company. If anything, most technology companies have sought the exact opposite: to put others' faces in front of customers--to break the messy process of sales and support down into pieces to be outsourced to "value adding" resellers.

    A pity then that this humanizing touch takes such a long time to build.

    ---

    Note:

    1. If we take a visitor-centric point of view, the analysis of the retail business simplifies considerably.  We can even derive an "income statement per visitor". Revenues are measured per visitor (currently about $52/visit). Costs are measured in terms of employee time. A $15/hr average wage and 15 min interaction time per visit puts the service cost at $3.75/visit. Profit per visit is also measurable and it's currently at $13/visit. Therefore the employee "FaceTime" costs 7% of sales, while other costs, including the cost of goods sold, add up to 66% of sales.
  9. Who will be Microsoft's Tim Cook?

    Research · 88 comments

    As previously noted, Apple has overtaken Microsoft (and Google) in operating margin percentage. This is an astonishing statistic as Apple is still largely perceived to be a "hardware company" while Microsoft is a "software company" and Google is a "services company."

    To suggest that "hardware" could be more operationally profitable than either software or services is akin to heresy in technology analysis. This reversal is newsworthy indeed. However, even the most casual observer would note that Apple does not derive its market power from hardware alone. It is, in fact, an integrated hardware, software and services company (with a few more roles besides.)

    So the emergent successful business architecture in this technologically transitional period is of integration and completeness of solutions.

    This shift explains at least at a conceptual level Microsoft's tectonic Surface shift.

    But what about another point of view? What does integration mean for Microsoft's income, cost and profit structure? Is integration self-disruptive to Microsoft?

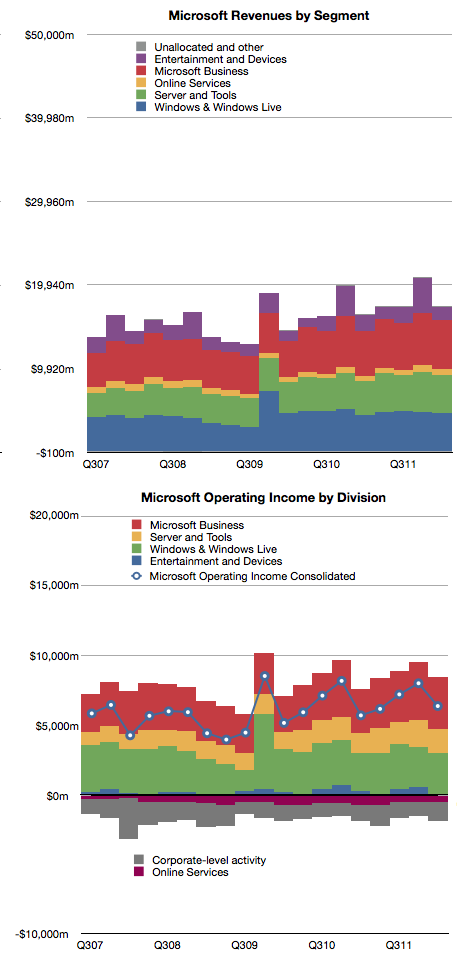
    Here's a reminder of Microsoft's revenues and operating income by division:

    The challenge of devices for Microsoft is that the licensing of software for devices is very difficult to sell.

    In 2011 Microsoft received about $18.7 billion in Windows revenues and $23 billion in Office revenues. The chart shows that this is a fairly steady growth business. According to Gartner, in 2011 there were about 336 million Windows PCs sold and that this too is a fairly stable and mature business.

    If we simply divide revenues by PCs sold we get about $55 Windows revenues per PC and $68 of Office revenues per PC sold [1]. The total income for Microsoft per PC sold is therefore about $123. If we divide operating income by PCs as well we get $35 per Windows license and $43 per Office license. That's a total of $78 of operating profit per PC.

    Now let's think about a post-PC future exemplified by the iPad. Apple sells the iPad with a nearly 33% margin but at a higher average price than Microsoft's software bundle. Apple gives away the software (and apps are very cheap) but it still gains $195 in operating profit per iPad sold.

    Fine, you say, but Microsoft make up for it in volume. Well, that's a problem. The tablet volumes are expanding very quickly and are on track to overtake traditional PCs while traditional PCs are likely to be disrupted and decline.

    So Microsoft faces a dilemma. Their business model of expensive software on cheap hardware is not sustainable. The future is nearly free software integrated into moderately priced hardware.

    For Microsoft to maintain their profitability, they have to find a way of obtaining $80 of profit per device. Under the current structure, device makers will not pay $55 per Windows license per device and users will not spend $68 per Office bundle per tablet. Price competition with Android tablets which have no software licensing costs and with iPad which has very cheap software means that a $300 tablet with a $68 software bill will not be competitive or profitable.

    However, if Microsoft can sell a $400 (on average) device bundled with its software, and is able to get 20% margins then Microsoft is back to its $80 profit per device sold. This, I believe, is a large part of the practical motivation behind the Surface product.

    The challenge for Microsoft therefore becomes to build hundreds of millions of these devices. Every year. Sounds like they need a Tim Cook to run it.

    ---

    Notes:

    1. Microsoft accounts for revenues using deferrals due to Software Assurance pre-payment models for many corporate customers so this figure is not a precise value for each license sold.


  10. Beneath contempt: The Apple TV business model

    Research · 98 comments

    Last year we sold ... 2.8 million Apple TVs. This year, just in the first six months of our year we've sold 2.7.

    Tim Cook at D10 1:45.

    I note the "our" in "our year". This implies fiscal year (that and the fact that he spoke in the past tense before six months had passed in the calendar year.)

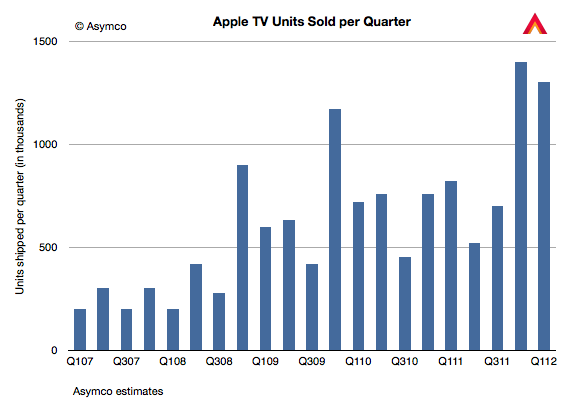
    Given the public information we have so far, it's now possible to estimate with some confidence the sales history of Apple TV. The following chart is my estimate. It includes all the known data so far with some interpolations to fill in the gaps.

    Assuming average revenues per device of $100, we can get an estimate of about $344 million in Apple TV hardware revenues for calendar 2011. This is not a large amount relative to Apple's other lines of business. It is, for example, only 14% of the overall Peripherals revenues and only 5% of the iPod.

    However hardware revenues are not the whole story. The business model for the device is in many ways the polar opposite of the business model of the iPhone. Whereas the iPhone employs "break-even" iTunes App Store (and the Music and Video and Book stores) in order to sustain its high hardware margins, the Apple TV business has low hardware margins that sustain content.

    The complete picture therefore has to include an assessment of the content attach rates and the agency fees that Apple gets for that content.

    Let's assume that each Apple TV is used to generate $10/month in content sales. This is not a lot. It's equivalent to 5 TV shows or one movie purchased or two movie rentals per month. The model I have shows that the installed base of Apple TVs was about 10 million by the end of 2011. That means that the run rate is $1.2 billion in content sales for the Apple TVs in use.

    Now Apple does not book all that. They book only about 30% as revenues as their agency fee. That means that Apple TV could be generating revenues at a run rate of $360 million (to Apple.)

    If we add that to the $344 million in hardware revenues we get about $704 million for 2011. This is still not a huge business. It is about equal to the revenue from iPad Smart Covers[1]

    Looking forward, if Apple TV units sell at double the rate of last year and we increase the footprint accordingly, we could see a revenue rate of $1.2 billion for 2012.

    Now this is not a high margin business. The margin on the content may be less than 50%--depending on transaction costs and hosting/traffic fees. The margin on the hardware is also likely to be below 40%. So the business is not wildly profitable. But it probably is profitable. Which means it makes sense to keep it running while waiting for other pieces to fall into place.

    As Tim Cook repeated, they are very interested in this space. However, any discussion of the future must include an analysis of the business model and the sustainability in terms of profit that keeps long term development focused on getting the product to be good enough for the right jobs to be done.

    What we should think about however is this "polar opposite" business model. Apple is running this as a "hobby" or as an internal experiment. Sales are (relatively) tiny but it generates some profit. Volumes are small but they are growing. It's taking a heck of a long time. It's asymmetric to the prevailing model the company relies upon. It's beneath contempt from all observers. Sounds familiar?

    ---

    Notes:

    1. In 2011 there were about 40.5 million iPads sold. If we assume half of those purchases also resulted in a Smart Cover purchase and if the average revenue per Smart Cover was $35 then total Smart Cover revenues were $709 million.
  11. Calculating Google's contribution to iPhone profitability

    Research · 16 comments

    In the iPhone cost structure analysis I showed how revenues and costs for iPhone are probably allocated. The revenue per iPhone was shown to include $29 for revenue items "above" the price of the phone to the channel. This total includes Apple's own iPhone accessory sales plus revenue from licensing the "Made for iPhone" trademark to third party accessory makers. Apple also receives some revenues from cloud services. But, pertinent to our recent discussions on the Android business model, Apple also receives revenues from Google.

    Wouldn't it be nice to know how much? Here's a way we can estimate it.

    I've read an estimate that 50% to 60% of ad revenues from Google search initiated via iOS are paid to Apple. This is believable because the TAC for Google overall is about 40% and Apple probably drove a hard bargain to get a premium for its, presumably, premium traffic.

    So if we knew the revenue run rate for Android search on a per device basis we could perhaps guess how much of each phone's revenue comes from Google. What we've heard last year in Congressional testimony is that two thirds of its mobile revenues come from iOS devices. This would imply that the run rate for iOS would be 2x the run rate for Android.

    Having a model of Android revenues helps at this point. Assuming Google obtains $4.4 from Android (excluding AdMob and App sales) and assuming negligible other mobile revenues from other platforms gives a possible Google revenue per iOS device per year of nearly $9.

    Taking the lower bound of the revenue share estimate above means that half of Google's revenue goes to Apple or $4.4/iOS device/year or $9 over the two year life of the device.

    That would put revenue from Google at about 1.4% of iPhone revenues (see average revenue per iPhone here). And that revenue comes without any costs and so flows straight to the bottom line. That, in turn, would imply that 3% of Apple's operating margin is provided by Google. Not a bad deal considering that some phone vendors can't get that for their entire product line.

    The interesting factors at work here are that this contribution by Google to Apple is higher than the contribution by Android to Google. In yesterday's post, I calculated that in 2011 Android contributed about $590 million to Google's operating margin (5% of total).

    If we consider that Google pays Apple $9[1] for every iOS device and since Apple sold 156 million iOS devices in 2011 then Apple received $1.4 billion from Google, all of which went to the bottom line.

    $1.4 billion from Google to Apple vs. $600 million from Android to Google. Three percent contribution of Google to iPhone profits vs. 5% contribution of Android to Google's profits.

    This sets up all kinds of game theorizing which will undoubtedly entertain and enrich us all.

    ---

    Notes:

    1. Perhaps this $9 value is not valid for all devices. Perhaps iPod touch does not get a lot of traffic and is less valuable. Perhaps iPads get more traffic and are worth more. On average, this may be plausible.