Asymco

Asymmetric Intelligence

profit

  1. The phone market in 2012: a tale of two disruptions

    Research · 96 comments

    During the first quarter this year HTC, RIM and Nokia all surprised investors with bad news. The effect is evident in the share price of these companies which, in the case of RIM and Nokia is around book value, and in the case of HTC, neared 12 month lows and a 70% drop from peak.

    These "misses" in earnings and expectations are on top of the already woeful news from Sony Ericsson and Motorola, which have not had profits for years and LG, which has been borderline since late 2009.

    In combination, this seems to imply a dearth of profits in an industry that is, by all measures, booming. Units are up 7% with smartphones up 47%. Revenues are up 20% and overall profits are up 52%. This are exceptionally strong numbers. Few industries can measure growth in double digits.

    So if the industry is booming but the majority of participants in the industry are loss making (and surprisingly so) then what is going on? There are two answers: new market disruption and low end disruption.

    The new market disruption is the migration of a large number of demanding customers away from phones-as-voice-products to phones-as-computing-products. The low-end disruption is the migration of a large number of less demanding customers from branded phones to unbranded, commodity phones.

    The New Market Disruption

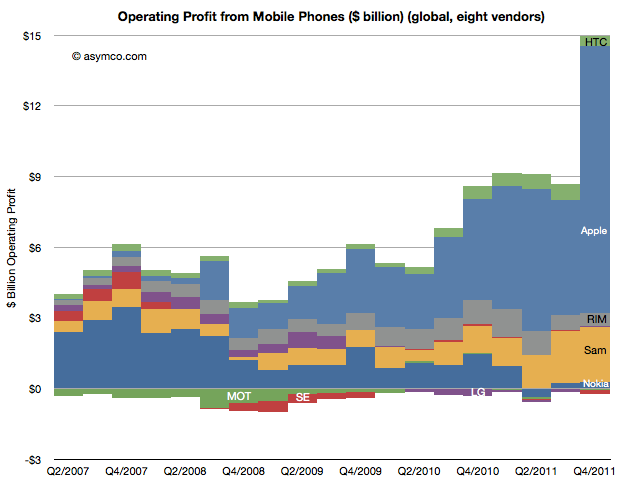
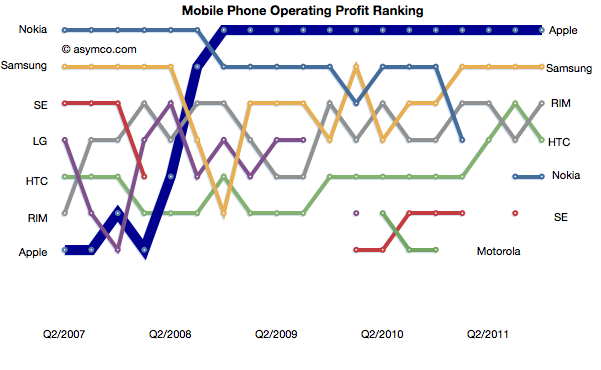
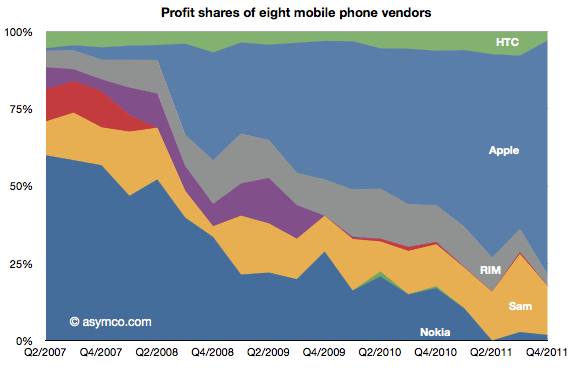
    The new market disruption is evidenced by the shift of fortunes to Apple and Samsung and away from every other device maker. Here is the profit picture:
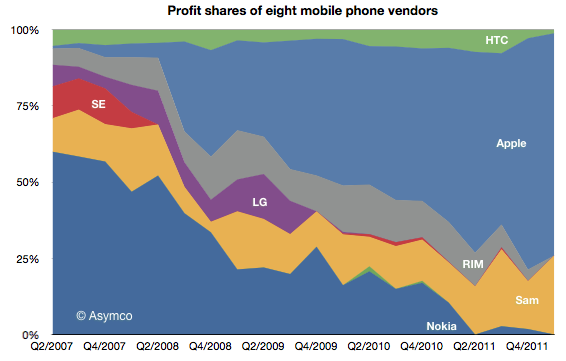
    Of the vendors tracked (public companies who report mobile phone divisional performance), Apple obtained 73% of operating profits, Samsung 26% and HTC 1% [1][2].

    The "share of profit" picture is potentially misleading because it could imply that the profits available are a constant. They're not. The absolute profits picture below shows how the industry actually expanded available profits by quite a lot. Two years ago the vendors generated profits of $5.3 billion in the first quarter  and last quarter they generated $14.4 billion.
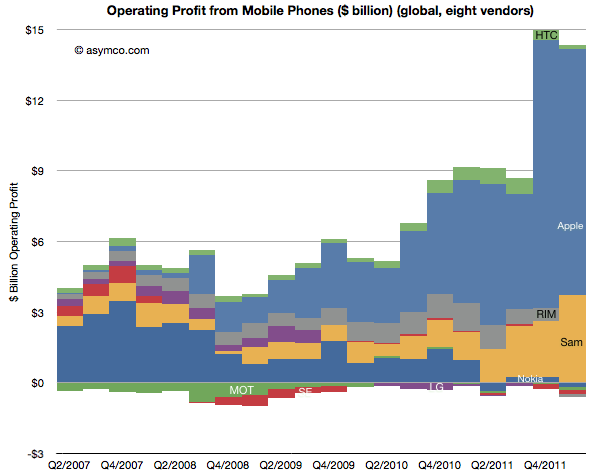
    Seen this way, the story isn't so much that Apple "took the profits from the incumbents". Rather, it's that Apple created a vast new pool of profits. And one need not look far to find out where they came from: operators. These profits were mostly carrier premiums for the iPhone 4S.

    Before shedding tears for operators, consider that although this does amount to a current transfer of profits from carriers, the decision is a popular one. Hundreds of operators have made it. It's unlikely that they all colluded to be robbed. Indeed, they willingly hand over these premiums because the iPhone ensures a competitive advantage or preserves their customer base from churning. The calculations that go into a decision to range the iPhone are compelling enough that 250 operators made the decision (though, crucially, there are still 250 who have not).

    Following this value proposition to its logical conclusion would suggest that the industry is rewarding those who can supply computers-as-phones which preserve the cash flows of what is essentially a trillion dollar data services business. Vendors which cannot offer this solution saw their businesses implode. At least on the high end.

    The low end disruption

    Simultaneous with this shift of the high end to smartphones-as-app-and-service-platforms came an explosion of growth in unbranded phones. As Apple led and most brands followed the new market, the old market of voice-oriented phones was abandoned to new entrants offering cheap "good enough" phones. Nokia tried to preserve its volumes and margins there but it's becoming increasingly difficult.

    The following chart shows how the "Other" vendors have come to make up about 44% of the market.
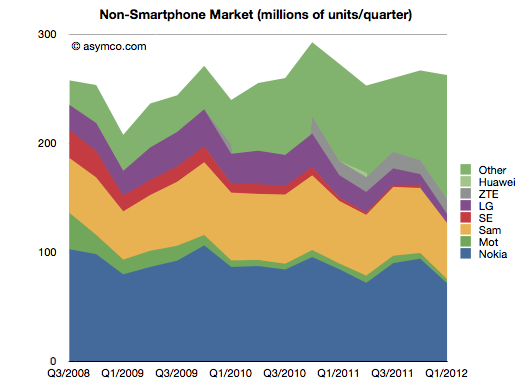
    Note that although this "feature phone" segment is not growing, it is still a large market (250 million units a quarter). The entrants in this market are numerous (perhaps in the thousands) and they are offering white label and unlicensed knock-off products. They are also offering unregulated (i.e. without IMEI numbers) products which are technically illegal and sold mainly in underdeveloped countries which have no incentives to enforce regulations.

    This is a consequence of feature phones reaching the point of being "good enough". The feature set and quality are adequate for voice, text, games and even media playback and are priced at $30 or less.

    This commoditization of the low end is pressuring what would normally be the fallback cushion under an underperforming smartphone business. The crisis for the incumbents comes from not only being unable to shift to the new market as fast as needed but also from not having cash flows from a low end that was thought to be sustaining.

    This combination of two disruptions is why we see an explosively large and growing market failing to reward all but two of the participants.[3]

    ---

    Notes:

    1. You can download, view and interact with a motion chart for the industry data here. All data is sourced from company filings except for some estimates where data is missing.
    2. Operating profits are sales minus cost of sales minus operational expenses attributed to the business. When not available, opex is estimated as a percent of total in proportion to sales. Note that operational income excludes taxes, depreciation and other capitalized costs.
    3. We cannot say that the thousands of low end entrants are unprofitable. They are probably enough profits to sustain them and even to attract more entrants, but we have to also recognize that there are likely to be very low margins.
  2. What is disruption and how can it be harnessed?[1]

    Research · 50 comments

    The phenomenon we call business disruption could benefit from a different name. Although it signifies a disturbance or an interruption in an industry, it's much more than that.

    The nominal definition I work with is that disruption is the "transfer of wealth in an industry from dominant incumbents to disadvantaged entrants." It's a convenient definition because it's brief, it puts the emphasis on economic value and because it alludes to a reversal of fortune and the implied extraordinariness.

    However, there are several nuances lost and contradictions ignored in this definition. I want to enumerate them here and now:

    1. Although in a disruption there is a transfer of wealth, that wealth is not necessarily conserved. An industry that undergoes a disruption often emerges larger, more productive or more influential. Disruption typically creates net growth.
    2. Although extraordinary and spectacular it is also very commonplace. Disruption is not rare. In fact, it rarely fails to happen. One could even say that if it does fail to happen, it's a symptom of an industry in crisis.
    3. Being so common, it can be seen as a regular occurrence. But if the regularity of disruption can be considered to have a clock cycle, its frequency is increasing.
    4. Disruption in the literal sense implies discomfort, displacement and even destruction. But it's necessary to the health of any economy. The analogy to biology is that death is the most important thing in life.
    5. Although only recently characterized and studied in cases set in the past century, the pattern is evident throughout history.

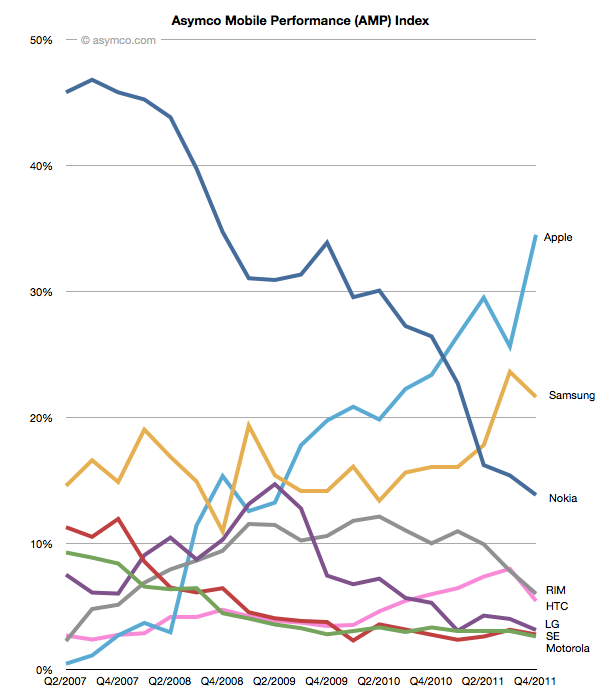
    I've offered examples of these consequences or side-effects of disruption but I'll emphasize once more the example I'm most familiar with. To illustrate the primary definition, the AMP index is a measure of the success of one company relative to a set of peers in the mobile phone industry. It's the average of four market shares: mobile phone units, smartphone units, revenues and operating profits.

    This chart shows the shift in AMP index values for the competitors whose data is public and which make up the vast majority of units sold:

    The reversal of fortunes, though not complete, is clearly evident. Motorola and Sony-Ericsson, two of the brands that were a significant part of the mobile phone landscape for more than a decade, have ceased to exist as independent companies. A third, LG, is likely to follow. Nokia, the most successful phone vendor for the decade of the 2000's is in severe distress at this time, valued barely above book. RIM, a pioneer, is priced below book value and HTC, another pioneer is also looking for a way to remain relevant.

    But we have to appreciate that as these valuations evaporated, the market grew both in value and in volume. The overall spending on phones has never been higher. The total profits captured is also growing. By any standard, smartphones are a booming business. Queues form for the latest versions, there are supply constraints and media coverage is almost universal.

    We also have to appreciate that the Nokia that is faltering today was itself disruptive when it gained its prominence. In the 1990s the mobile phone market was dominated by Motorola, then by Ericsson. Nokia was a relative latecomer and succeeded by being better in some regards (e.g. the ease of use of text messaging on its phones) but also by being asymmetric. Using logistics and a portfolio approach to the market allowed it to build scale while maintaining margins. Process innovation led to component shortages for competitors and allowed Nokia to build massive distribution. It also allowed it to invest in software which gave it a unique selling point for several years.
    Looking into the even more distant past, the mobile phone market has seen several waves of disruption. Going from analog to digital was such a turnover. The companies which were successful with analog (mainly Motorola which supplied not just handsets but infrastructure) were sidelined when global digital standards took root. Integrated European vendors dominated a period when 2G GSM was becoming predominant. Isolated pockets of integrated innovation like iMode in Japan also had mini-booms but were swamped by standardization and the Galapagos syndrome.

    And let's not forget that mobile itself has been disruptive to fixed line telephony. Looking at all telecom, the transitions from fixed to mobile, analog to digital and most recently feature-based to computing-based platforms have all been disruptive, bringing a new set of companies to lead while incumbents fretted.

    It should also be noted that these changes are happening more rapidly. The chart above has a five year period. The change from analog to digital took longer. Over 10 years since its inception analog was still dominant. If we look how long it took for mobile to take consumption away from fixed, that process is still ongoing, several decades later. The speed is so slow that some countries have skipped over fixed networks altogether.

    With software-defined devices and cloud-based distributed computing the changes will become even more rapid. Even though the user base is expanding to cover nearly the entire global population, the replacement rate of devices means that change in the tools and services people use are limited by supply rather than demand. Supply-based innovation or "the new manufacturing" will probably be the dominance-defining asymmetry of the next decade.

    The disruption of mobile phones that Apple has foisted on the world through iOS has caused it to reach a point where it dwarves the values of other companies, not just in the sectors it competes, but in all sectors. Some suggest that Apple is an anomaly and does not reflect the economy. To truly understand the state of the economy, they say, means to subtract Apple from it. But I feel this is exactly wrong. Apple is, through the iPhone and iOS ecosystems, defining this era. Just like Microsoft defined an era of increased productivity through the creation of the "knowledge worker", or like GM re-defined transportation and the notion of the brand in the 50's, or like IBM re-defined business process efficiency with automation in the 60's and 70's, these companies were not anomalies of their era. They were the eras. They were the locomotives of growth that taught other companies how to operate and the contemporary managers how to manage.

    Companies that study Apple today will benefit by understanding how it re-wrote the rules. The anomaly is the norm. The exception is the rule. The times they are indeed a-changin'.

    Finally, to put disruption in a historical perspective. I wrote a retrospective on the history of the telegraph as a parable of how disruption could be interpreted to have happened even a century ago. What I hope to do now is to show how, given this set of spectacles, we can see how the fate of nations was determined, in part at least, by the ability of leadership to accommodate disruption.

    The case of growth or limits to that growth, the question of integration vs. modularity and the evolution of value chains all have application for regulators, policy makers and political leaders.

    The dialogue on this topic will begin in Amsterdam on April 13th 2012, at Asymconf. I look forward to seeing you there.

    ---

    Notes:

    1. This is the material accompanying the first case discussion at Asymconf. Participants are encouraged to read it before the show.
  3. Why total net profits are not conserved

    Research · 28 comments

    When cellular phones emerged in the 1980’s wireline phone service was excellent. Penetration was at 99 percent in the United States and prices had never been cheaper. The industry was deregulated and phone companies were competing fiercely over long distance calling plans. In contrast, the new cellular phones were not “good enough” on the basis of what was considered necessary for making critically important phone calls.

    Sound quality was poor, coverage was spotty and battery life measured in minutes. But they allowed a whole new consumption model of communication to emerge. They allowed a caller to call a person not just a place. Over time, this simple value proposition caused a powerful profit formula to emerge. That formula led to extremely rapid improvement in the quality of the network and devices that connected to it.

    It caused such a cataclysmic change that twenty years hence it became possible (even natural) for consumers to “cut the cord” and abandon wireline communications altogether. The “excellent quality” wireline industry was dead to be replaced by the "good enough" wireless industry.

    One consequence of mobile telephony was increased consumption. Voice call minutes increased dramatically because calling could happen anytime from any place. While overall consumption increased, landline use decreased. Then came messaging of various types. Forms of communication enabled by cellular networks that simply did not exist before with landlines.

    As a result there were vast pools of profits available to telcos that seemed to appear out of nowhere. SMS and data plan income was beyond anyone's ability to forecast in the 1980s.

    The same phenomenon is happening with smartphones. Consider a proxy measure: operating profits from mobile phones since the iPhone launched, illustrated below.

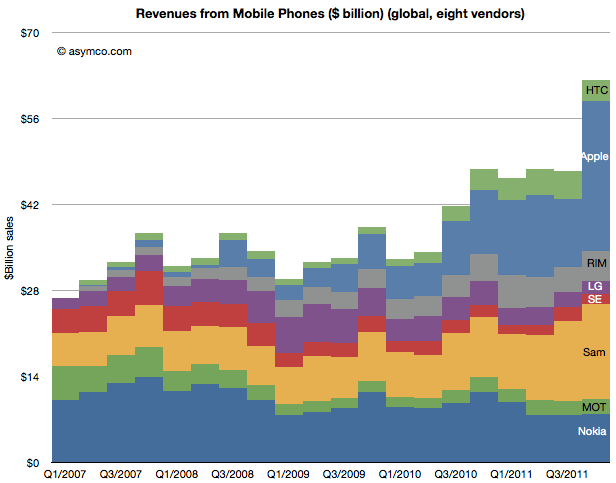
    Although Apple went on to capture 75% of the profits, it did so from a vastly expanded profit pool. A similar picture emerges from an illustration of revenues:

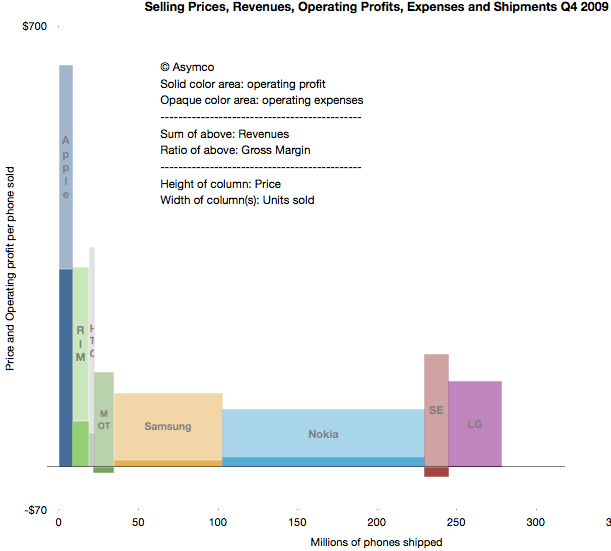
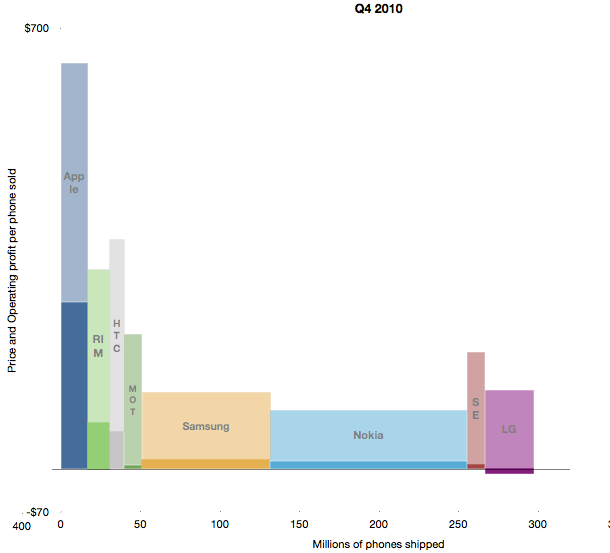
    Another way to visualize the evolution of the market is to look at the combined price, profit margin and volume areas for the fourth quarters of 2009, 2010 and 2011.

    Scanning from top to bottom, you can see how volumes grew, revenues grew and profits both grew and were re-allocated among participants (each colored pixel in the charts above is equal to about $1 million.)

    These charts illustrate that there is no "law of conservation of profits" in any market as long as there is sufficient innovation. This is because the there is no "law of conservation of value created". If value is presented, buyers will gladly trade cash for it. Conversely, if there is no value-generating innovation, growth stops and competition reduces to a zero-sum game.

    One of the most exciting aspects of disruptive growth is that although it tends to transfer profits from incumbents to entrants, it also grows the size of the overall market. Sometimes the growth is significant.

  4. The value of the OS X monopoly

    Research · 40 comments

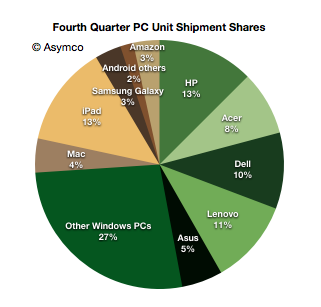
    In January I noted that there were more iPads sold by Apple than PCs from HP, the largest PC vendor in the fourth quarter. Including all tablets, this is the distribution of market shares by units shipped.

    Note the different color palettes for Windows and non-Windows.

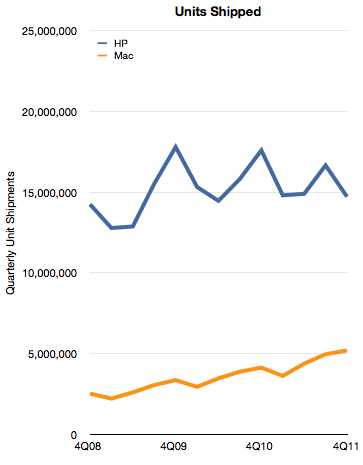
    By the metric of tablets+PC's Apple appears to be the leading vendor. However, if we consider only the Mac, Apple is still well behind. The historic unit volumes of the two is shown below:

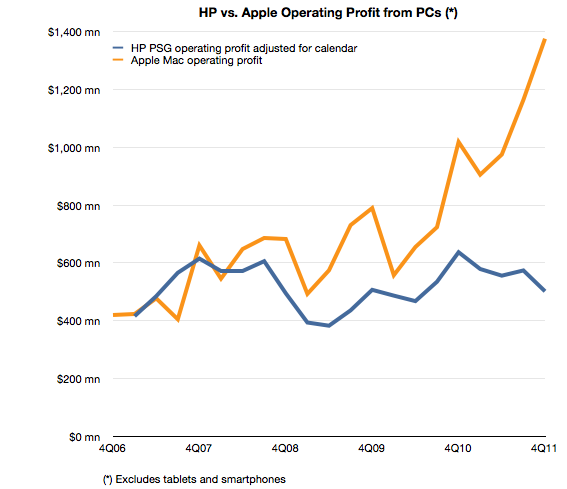
    Although Apple has nearly doubled its shipment volumes since 2008, it's still only one third that of HP. In addition to comparing volumes, we can also measure profitability. In this case HP's PSG (Personal Systems Group) reports operating profits and we can estimate the same from Apple based on a gross margin estimate and an operating expense estimate (as percent of sales).

    The comparison looks like this:

    The operating profit for Apple is 2.7 times higher from a third the units. This gap is a result of a vast difference in profitability. HP's operating margin for PCs is 5% while Apple's is 21%.

    A few days ago I highlighted that Apple's iPhone yields disproportionate profits because of the way it performs the jobs its hired to do by consumers and operators.

    With the Mac the story is that Apple's OS X is primarily responsible for delivering quadruple hardware margins vis-a-vis the most successful PC vendor.

    Both iPhones and Macs are sold as hardware products and the entire econometric analysis of Apple depends on hardware cost structures. This is because hardware lends itself to easy measurement. However, a casual observer would be stumped by a comparison with competitors which cannot come near the profitability Apple enjoys. How can the same bundle of components (admittedly mostly off-the-shelf) be sold at triple the margins?

    It comes down to software. Apple has a monopoly on iOS and OS X and charges for it through its hardware. That's a very valuable monopoly. It's worth at least $1 billion per quarter.

  5. First: Apple's rank in mobile phone profitability and revenues

    Research · 82 comments

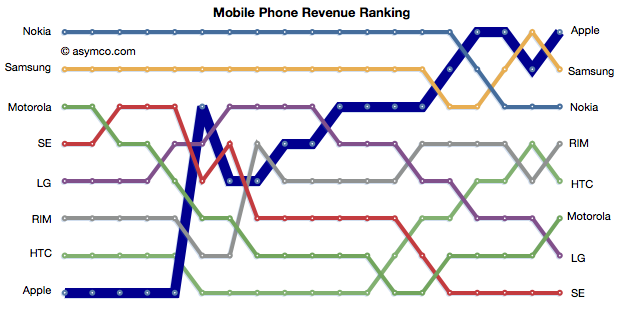
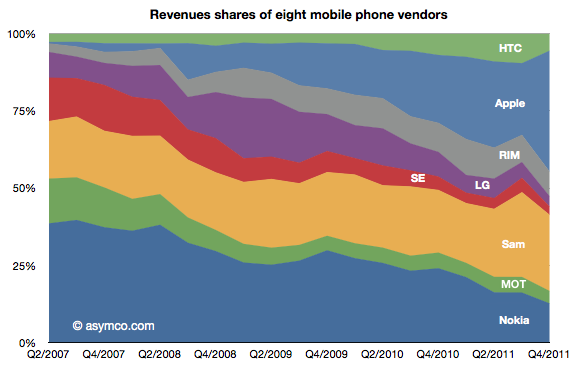
    Apple retained its top rank in profitability and regained the top spot in mobile phone revenues.

    The relative shares of revenues and profits are shown below:

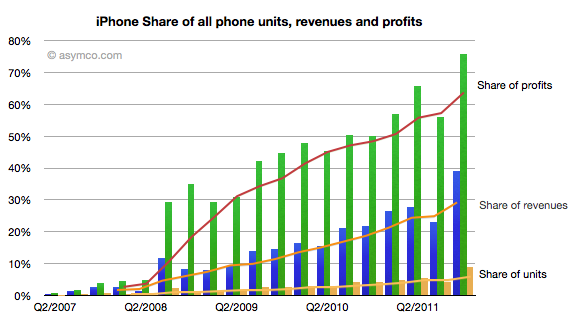
    Individually, Apple's share of units, revenues and profits is chronicled below:

    Apple reached 75% of profit share, nearly 40% of revenue share and 9% of units share.

    Apple and Samsung combined for about 91% of profits with RIM third at 3.7%, HTC fourth at 3.0% and Nokia last at 1.8% of a $15 billion total for the quarter.

    In terms of revenues, Apple had 39% to Samsung's 25%. Third was Nokia with 12.6% and fourth RIM at 8%. HTC only managed 5.5%, Motorola 4%, LG 3.3% and Sony Ericsson 2.7%.


  6. Apple could buy the mobile phone industry | Updated

    Research · 84 comments

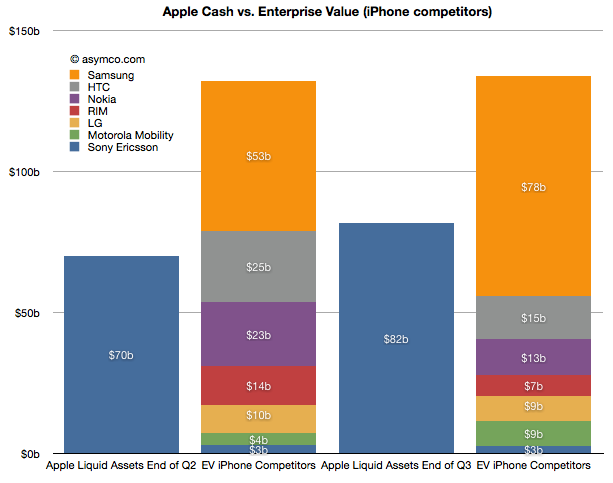
    The last time I did this comparison (Apple could buy the mobile phone industry | asymco) was in June after the end of the second quarter. The following chart is an updated look.


    Here is a discussion of the changes since the last analysis:

    • Sony Ericsson was valued through its acquisition by Sony. We did not have a way to value the enterprise before as it was not traded independently. Last June I estimated a 14x multiple on its trailing twelve months' profits and got $3.0 billion. Since then half the company changed hands for about €1.05 thus yielding a total company value of $2.8 billion. The enterprise value should be therefore slightly lower but I'll stick with the current transaction value as the EV.
    • Motorola Mobility has entered into an agreement to be acquired by Google for $12.5 billion by Google. The company's enterprise value jumped as a result to about $8.6 billion.
    • RIM's share price collapsed and it's now also trading at an EV of about 7.3 billion (Yahoo finance).
    • Nokia's price has also dropped and it now has an EV of about $13 billion (Yahoo finance).
    • HTC recently dropped significantly in price and is now worth about $15 billion EV. (Note that pricing of its equities is subject to suspended trading due to drop limits).
    • LG's phone business is still losing money and it's still difficult to value. In November it was revealed that the company was seeking to raise $890 million in capital to fund new initiatives including smartphones. The share price fell by 14%. In June I suggested a nominal value for the phone business of $10 billion. I think that's very generous and with recent events I would place that value at $9 billion today.
    • Samsung's fortunes have increased. In June I applied a 14x multiple to their trailing 12 months' operating earnings. Given overall discounting of the sector I applied a multiple of 13 today. That yields a business value of $78 billion. Interestingly, that is larger than the value of all other competitors apart from Apple. That also makes it six times more valuable than Nokia.
    • Apple's cash and cash equivalents and investments grew by about $12 billion and were worth about $82 billion as of October.

    In summary, in June Apple's cash was about 53% of the sum of competing phone vendor enterprise values. Today it's about 61%. Excluding Samsung, Apple could buy the industry and still have $25 billion left over. This makes the claim that "Apple could buy the industry" even more believable.

    This analysis is mainly academic. It does not imply that any such transaction will take place. As the purchase of Motorola shows, control has a premium and individual buyers may be less "rational" than markets. What it does show however is that the entire industry is in a state of crisis. Valuations for phone companies are collapsing and two major brands (Motorola and Sony Ericsson) are being absorbed and could disappear.

    At the same time entrants are arriving with completely different business models. Amazon, Facebook, Baidu, Alibaba are intent on selling phones or platforms to be valued as enablers for asymmetric business models rather than as phones. One could argue that what Apple itself sells is more than hardware and that its value-add "on top" of hardware is increasing. This is a sign of commoditization. Certainly the voice business is well beyond that point but it now appears that even the smartphone business is already in an advanced state of value compression.

    All the while the overall market is growing. I had separately looked at the profit pool and concluded that the brands are suffering. Summing up the votes from stock markets, the sentiment is even worse. 2012 is looking more and more as a year of inevitable and dramatic industry change.

  7. The AMP Index for Q3

    Research · 48 comments

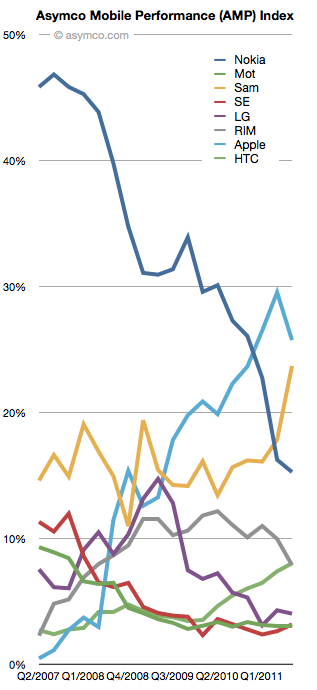
    The Asymco Mobile Performance (AMP) index is an unweighted average of:

    1. Share of all handset units sold (global)
    2. Share of smartphones
    3. Share of value (revenues)
    4. Share of profits

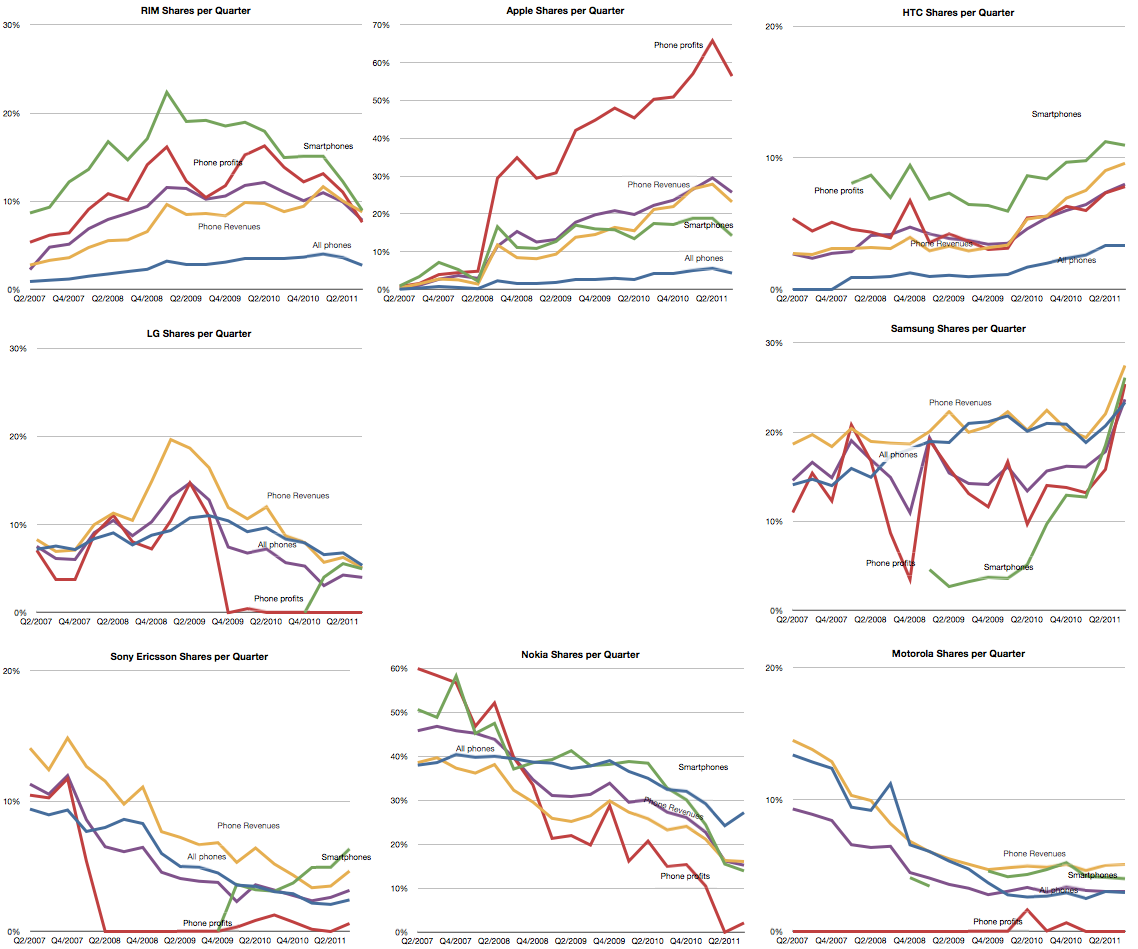
    For major phone vendors. The raw data for each share is shown in the following charts (note change of vertical scale: each gridline represents 10%).

    Note that the vendors are arranged in a particular way: top row are entrants, bottom row are incumbents with late incumbents from Korea arranged in the middle.

    Taking the average of each of the lines above, the unweighted share index (Units, Smartphones, Value and Profit) is shown below:

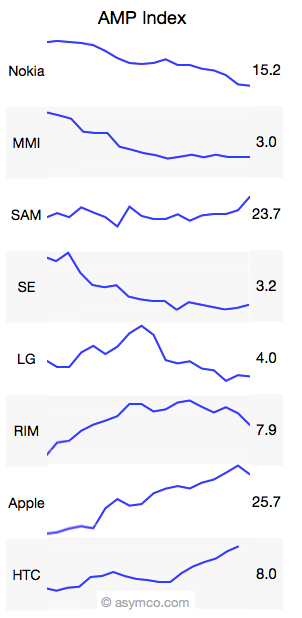
    And here it is in sparklines:

    Like many indices, this is a generalization that measures a section of reality. The value is in its use as a benchmark and trend analysis.

  8. Where is Microsoft's growth going to come from?

    Research · 128 comments

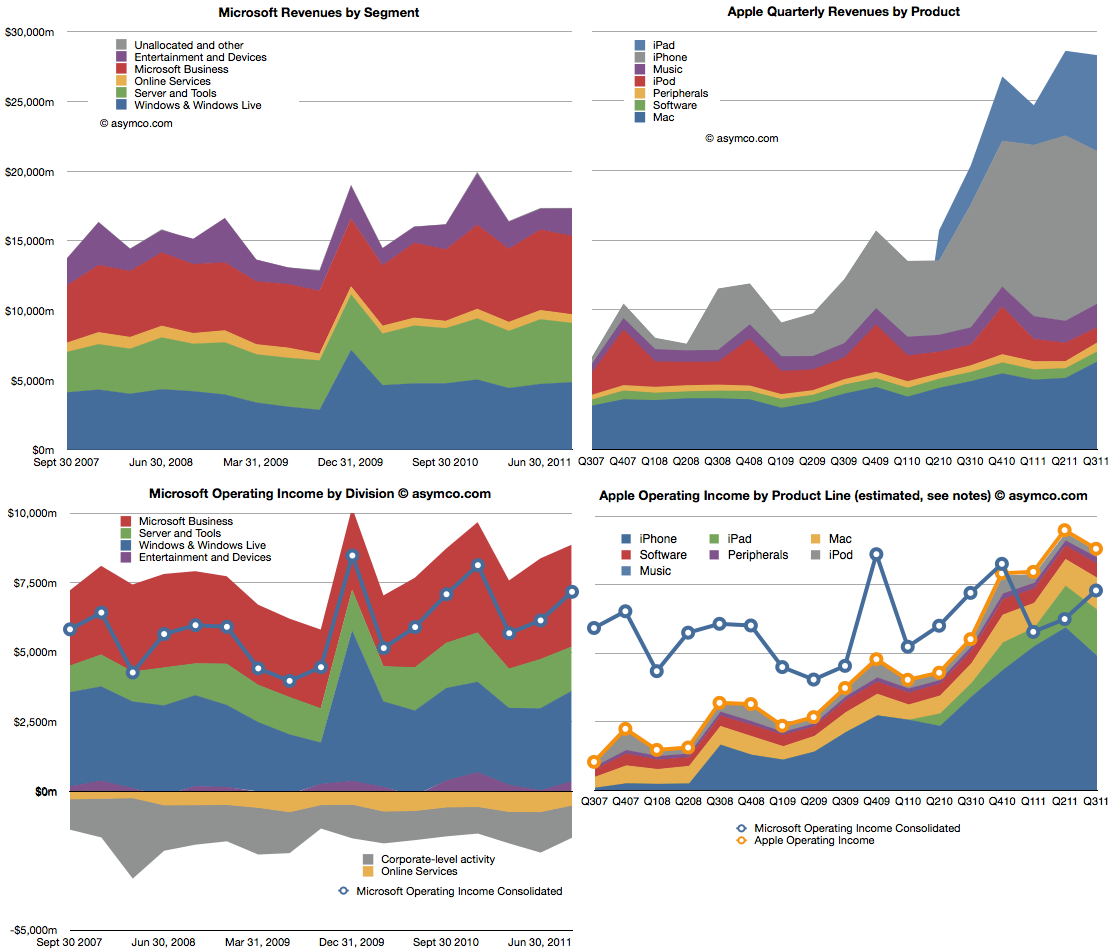
    Microsoft is a stable business. Apple isn't. The following charts compare the two. The two charts on top show revenues, subdivided into product lines. Microsoft is on the left and Apple on the right. Note that the vertical scales are the same (zero to $30 billion/quarter).

    The lower two charts show operating income by division/product line. The left is again Microsoft with the line showing the consolidated income (net of losses). The right chart shows the stacked areas of profit from Apple's product lines with the yellow line shooing consolidated income. I copied the blue line from the Microsoft chart for a more direct comparison.

    Apple continues for the third quarter to have higher operating income and for the fifth quarter maintaining higher revenues.

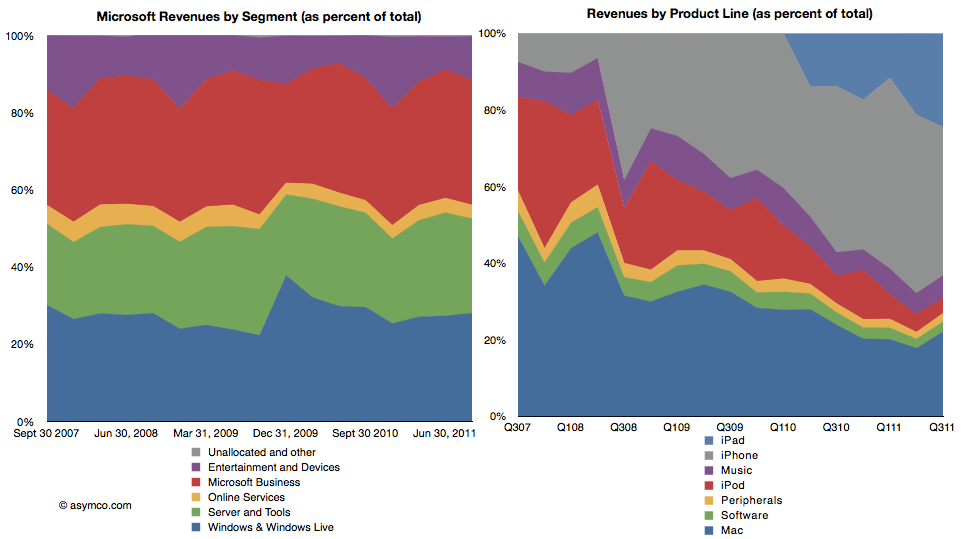
    The following two charts are also another way to view the two companies. As percent of total, how do the product/divisions stack up? The first is Microsoft revenues as percent of total and the second shows the equivalent for Apple.

    This comparison I think is most evocative. The stability of Microsoft is contrasted with the dramatic change that Apple is experiencing in the same time frame.

    There is a dramatic shift of focus from traditional computers (Mac) to devices. If profit is an indicator of where resources are being allocated, then there is no clearer visualization of the difference between the two companies' strategies.

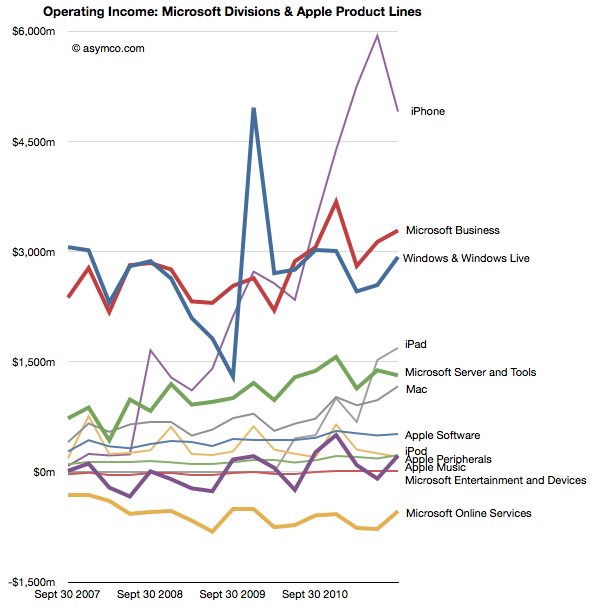
    The following is a mix of all products/divisions operating income in one dense line chart (thicker lines are Microsoft divisions, thin lines are Apple products).

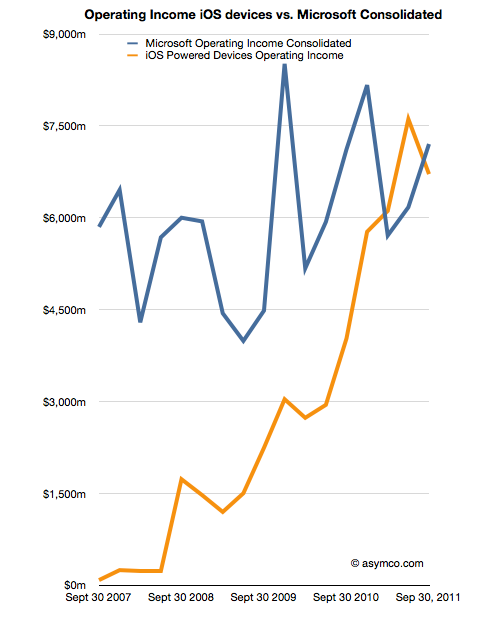
    Finally, the comparison of operating income of iOS devices vs. consolidated operating income from all of Microsoft's businesses.

    As iOS shifts into its fifth iteration my guess is that Apple will continue its growth trajectory. As Microsoft continues to adapt or protect its businesses from tablets and mobiles, will they grow? If so, how? Microsoft has shown consistency, but that is becoming less and less desirable.

  9. The end of the dedicated portable device

    Research · 67 comments

    On October 27th, Nintendo published half year results for the fiscal year ending in March 2012. Management stated that the company lost over $900 million with a negative outlook. Nintendo cited weaker than expected sales of Nintendo DS hardware and 3DS software and Yen appreciation as the main reasons for the miss. Is this the end of Nintendo?

    Before we look more closely, here is a quick summary: The company is exclusively involved in selling game hardware and software. Their console platform is the Nintendo Wii, which will be followed by the Wii U late in 2012. The Nintendo DS and Nintendo 3DS are the company’s portable game consoles. The Wii and the DS are nearing the end of their product cycles. On the software side, the company is known for gaming titles such as Super Mario and Zelda. Nintendo also pioneered the licensing model to allow third-party developers to produce games for its hardware products.

    A closer look

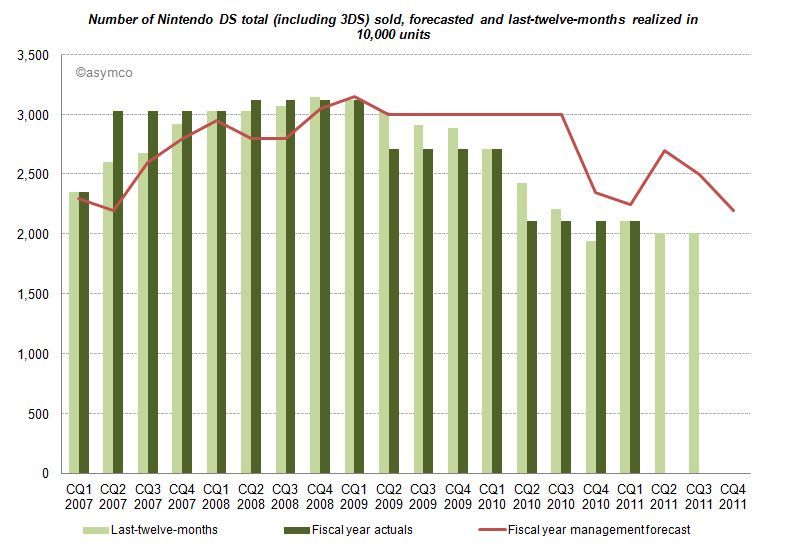
    The good news for analysts is that Nintendo publishes their estimates for hardware and software unit sales. This allows us to measure management predictive accuracy. The red line (management forecast) should be as close as possible to the dark green pillars (realized unit sales in the fiscal year).

    Until CQ1 2009 devices sales grew in excess of forecasts. A similar pattern can be found for consoles and game titles. After Q1 2009 forecasts have been always higher than results, and more worryingly, the deviation between forecast and sales is widening. Management missed and lowered forecasts for two consecutive years. Management's hope for an increase on the back of initial 3DS sales in the launch quarter (CQ1 2011) did not come to pass and they subsequently lowered forecasts again in the following two quarters.

    Looking at all categories, management lowered forecasts almost continuously. The deviation remains the largest in the portable hardware business segment indicating that management was largely surprised about the development.

    What caused this reversal of fortune?

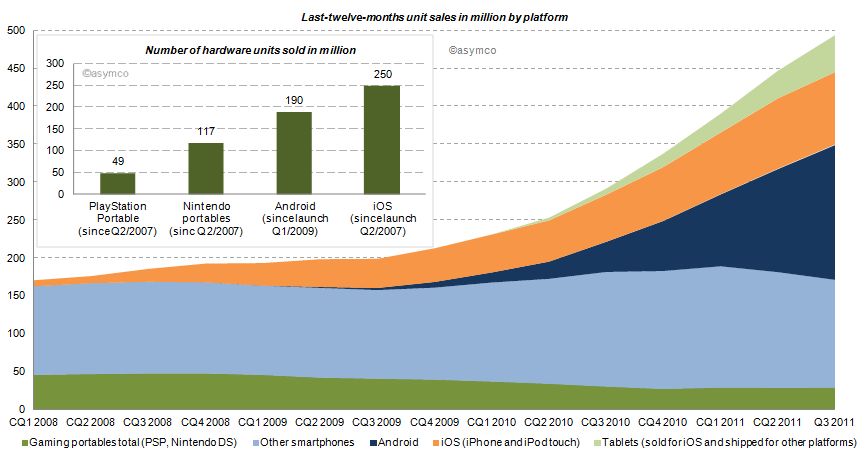
    Two years earlier the iPhone had launched and by CQ1 2009 iOS reached an installed base of about 38 million, half the number of Nintendo portables in the same period. Furthermore, in CQ1 2009 Android phones came to the market. Smartphones (light blue area of the chart below) sold before (and after) the debut of iOS, but the iPhone redefined the category and an avalanche of smarter phones running iOS and Android followed (blue and orange area). Portable gaming devices from Nintendo and Sony declined ever since: 17% in 2009, 31% in 2010 and already 16% in the last twelve months.

    How do the game players stack up?

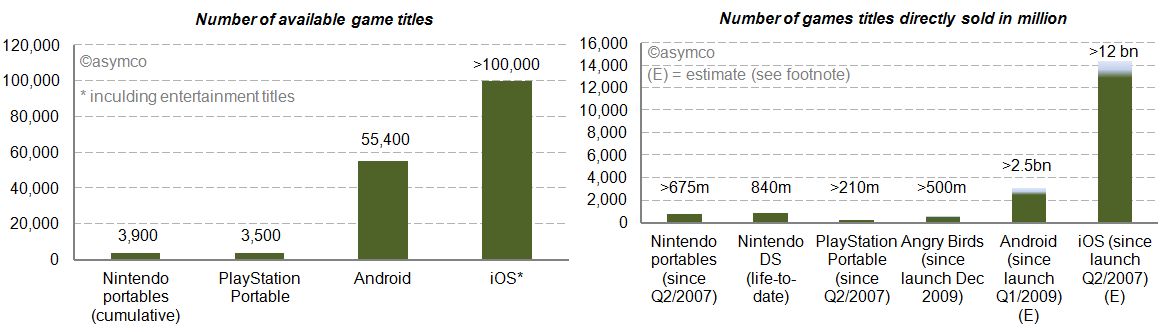
    We already looked at the installed base in the chart above. iOS and Android have outsold Nintendo portable units by a factor of 2.1x and 1.6x. Furthermore, we can see (in the charts below) that the two main mobile platforms have 14 to 26 times more game (and entertainment) titles available. Nintendo and Sony also publish unit sales of directly sold software titles. For Android and iOS we know the cumulative app download statistics. By taking the share of Septembers’ paid and free app downloads as a proxy, we can conclude that also by this measure Android and iOS dwarf Nintendo and Sony [1]. The reach of iOS and Android is further underlined by the more than 500 million downloads of Angry Bird game titles - first released only two years ago - for any platform having sold more than twice the amount of Sony’s cumulative portable game titles and almost as many as Nintendo’s cumulative games titles since Q2/2007.


    Who else has skin in the game?

    Besides Nintendo, Sony, Apple and Google, who else is making a push into mobile gaming? Before investigating, let’s first have a closer look at Sony. Sony, just like Nintendo, is also active in stationary gaming segment with the PlayStation franchise. The Sony group also has access to entertainment most notable through Sony Pictures Entertainment and Sony Music Entertainment. Furthermore, Sony recently decided to buy Ericsson’s stake in the mobile phone joint-venture Sony Ericsson and is making a push with Android to bring its gaming titles as a differentiator for its own products to the platform. And the other major suspects? Microsoft, also active in the stationary gaming segment with its Xbox franchise, is pushing to bring the Xbox experience to mobile phones with Windows Phone. Amazon has retailed software and games for years and has started to distribute software and games via direct download on its own Kindle devices but also for the Mac. On the Kindle, Amazon is relying on a forked Android version on which it leverages its eBook and other entertainment assets. And then there is Facebook, a social network that wants to be on any platform or device. Out of 800 million users, 350 million access Facebook via a mobile device. Around 50% of Facebook members play games on the desktop. With Project Spartan, Facebook is aiming to bring the desktop experience to the mobile device including a stronger focus on gaming and video.

    The competition between Apple and Google is already asymmetrical. Including the other contestants in the competitive landscape reveals Nintendo’s key weaknesses in the portable gaming market: attraction as a platform for developers in terms of ease and reach, pricing of hardware competing with operator-subsidized mobile phones and the jobs-to-be-done or value preposition. The new generation of mobile devices is standing against Nintendo’s dedicated approach. Although slowly adding features such as a browser and “app store” to its portables, Nintendo devices fall short in the variety of jobs-to-be-done compared to smartphones, let alone making a call.

    Average selling prices and financial impact

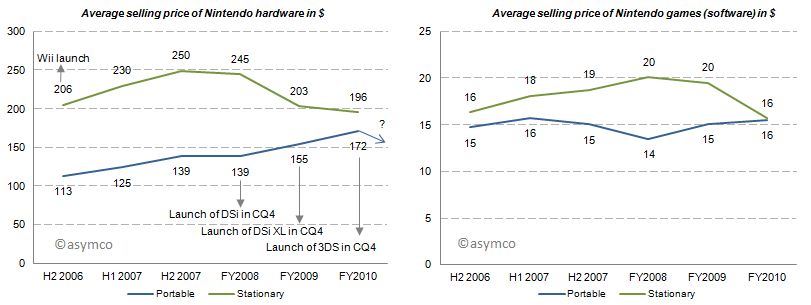
    With this market pressure one would imagine that average selling prices decreased for Nintendo portables. But for the last three fiscal years average selling prices for portables have increased, all things equal, mainly due to new product launches. Game title’s average selling prices have remained relatively flat. Note that these are wholesales prices for hardware and a mix of retail and wholesale prices for games. In 2011, for which we do not have data yet, the price of the newest portable, Nintendo 3DS, was lowered from its U.S. debut of 320 250$ in February to 170$ in July which will have a negative impact on ASP going forward.

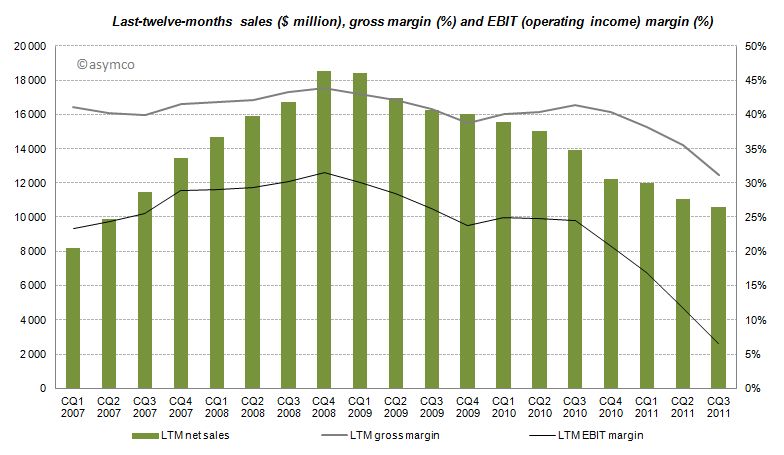
    The effects of Nintendo’s rigid strategy and the fast changing competitive landscape are manifested in the devastating financial performance over the recent quarters with LTM sales, gross margins and EBIT margins declining starting from CQ4 2008 and even accelerating to decline after CQ3 2010.

    Furthermore, even though the company has recognized its own difficulties, Nintendo has no intention of adjusting its strategy:

    CEO Iwata on the question of whether Nintendo plans to bring its game library to other platforms:

    This is absolutely not under consideration. If we did this, Nintendo would cease to be Nintendo. Having a hardware development team in-house is a major strength. It’s the duty of management to make use of those strengths. It’s probably the correct decision in the sense that the moment we started to release games on smartphones we’d make profits. However, I believe my responsibility is not to short term profits, but to Nintendo’s mid and long term competitive strength.

    Although realized and obvious, the disruption’s invisibility is often manifested in the paralysis of the incumbent.

    Conclusion

    According to Isaacson, Steve Jobs apparently always worried who could eat Apple's lunch. The lunch of the iPod, he concluded, was ripe for mobile phones. Subsequently, Apple entered the mobile phone space. Google followed. Since then more powerful mobile phones have eaten the lunch of the dedicated gaming device. The jobs-to-be-done and their priorities in people’s life have not changed, but the tools people use to get them done have. Permanently.

    ---

    Notes:

    1. Estimated by multiplying total cumulative app downloads with September’s share of game downloads: For iOS ranging from 72-80% based on Top 150 free and paid app downloads, for Android ranging  from 38-47% respectively. This is a very crude estimation, but the gist of it is that 4% for iOS and 11% for Android game downloads as percentage of cumulative app downloads would outsell Nintendo.
  10. Pac-Man

    Research · 51 comments

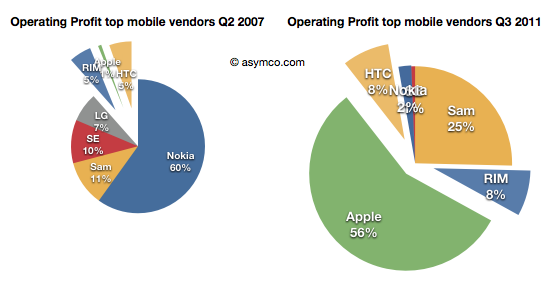
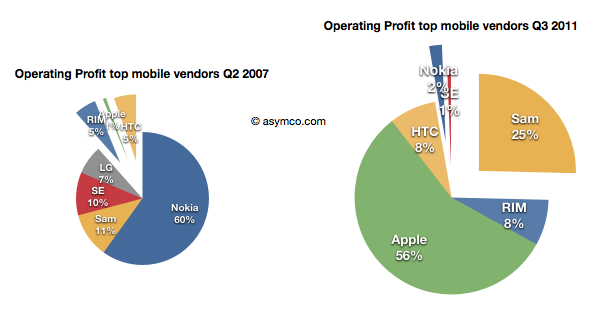
    I recently posted a comparison between the profit capture of phone vendors in 2007 and the most recent quarter:

    The idea was to show what a disruption looks like. A phenomenon where an entrant with none of the advantages of incumbency takes the profits away from companies privileged with ideal market access and knowledge.

    The view of profit shift is the ideal view since it shows the "bottom line" impact and thus the denouement rather than more nuanced sub-plot. However, we don't always have access to profitability data. Sometimes we only have access to revenue estimates.

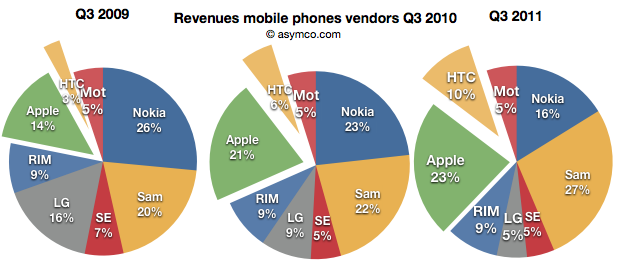
    Fortunately revenues have a similar story and are often a good proxy. Consider how the evolution of revenue shares occurred in the same market:

    Revenues for Apple and HTC combined doubled from 17% to 33% for the third quarter over three years.

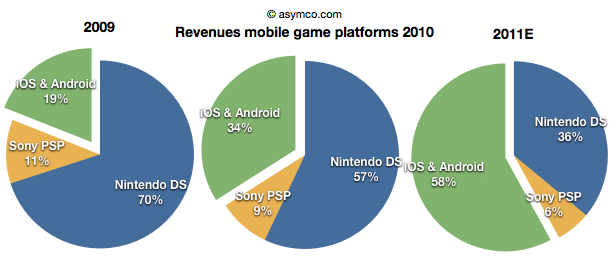
    Note the similarity between this evolution and that in the mobile games market (data courtesy of Flurry):

    The increase of revenues fro iOS and Android games nearly tripled over a two year period. Although we cannot say the same for profitability as the profits are not comparable since they allocated differently between platform and developer depending on platform, we can say that iOS is certainly driving vastly more value than Nintendo.

    Sony and Nintendo may take some comfort from their console businesses which have not felt the same impact from mobility, but one wonders how long those franchises will last. Using an iPad with screen mirroring to a large screen TV already shows promise.


  11. The end of the independent phone brand

    Research · 103 comments

    As shown in the yesterday's post, in the third quarter, overall mobile phone profitability declined. The eight vendors I use as a proxy showed a total net profit of $8.51 billion, down slightly from $8.57 billion and a drop of $9.01 billion in the first quarter.

    Overall, the industry dropped by 1% sequentially but is still up 30% over last year and has a 20% compounded growth rate over a three year period.

    • Nokia returned to profitability, though at $180 million it's only about 2% of the top eight.
    • Motorola remained in the red with a small loss of $20 million, an improvement over the $90 million loss of the previous quarter. Motorola is being acquired by Google after an accumulated mobile operating loss of $4.69 billion since the beginning of 2007. It's unlikely we'll receive any updates on performance thereafter.
    • Samsung had a great quarter with a sequential increase of 19% and year-on-year growth of 130%. The total profit amounted to 25% of the peer group.
    • Sony Ericsson broke even with about $50 million in operating profit. Like Motorola its performance was barely break-even during the last four years and its also disappearing from our list of independent vendors as it becomes part of Sony.
    • LG had its sixth consecutive quarterly loss and is now appealing to investors for more capital to continue operating as a smartphone vendor. Raising dilutive capital seems a radical approach and not one that inspires confidence.
    • RIM had a sequential reduction in profit of 35% and y/y reduction of 30%. The company is exhibiting clear signs of decay and the stock market is valuing the company below book value.
    • Apple profit dropped by 19% but grew 43% y/y during a transitional quarter. The growth remains 43% compounded over three years.
    • HTC has a 1% sequential increase but a 78% y/y growth.

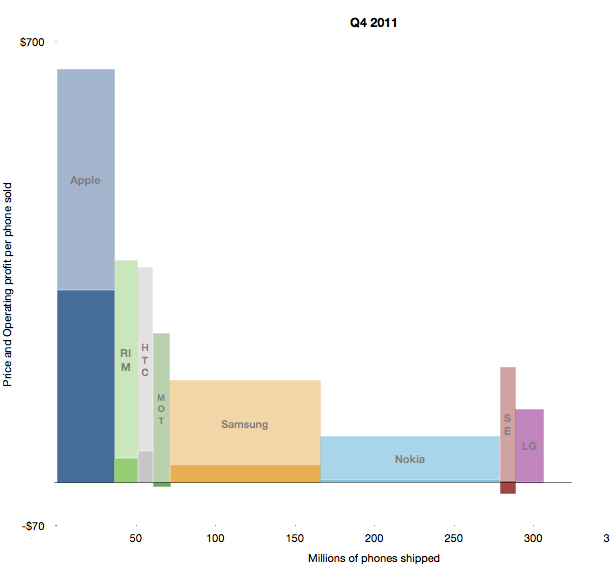
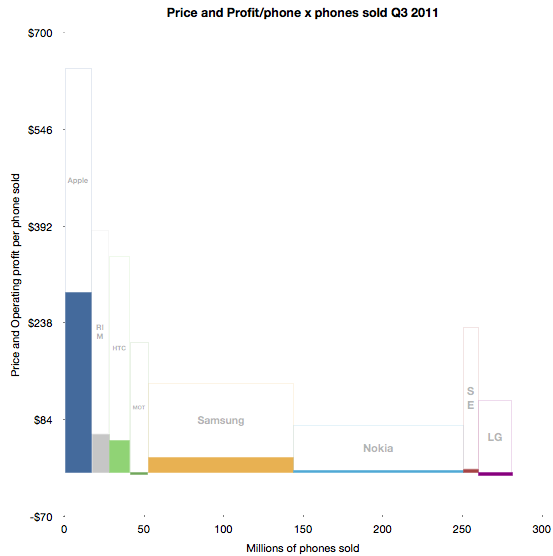
    To illustrate the performance in terms of profit, pricing, volumes and margins, I developed the following chart. 

    The solid areas representing profit are operating profit/phone in the vertical axis and volumes shipped in the horizontal. The blank areas above are the cost of goods sold per phone and the combined solid and blank represent the average revenue per phone.

    Some of the areas are over-represented due to the lack of resolution available.

    Using before-and-after pie charts for positive profits, we can see how the entrants (RIM, Apple and HTC) went from 6% of profits to over 73% four and a half years later.

    I feel that this is somehow the end of an era. I've written before about the brutality of this market, listing 13 companies which were either merged or acquired or disappeared in the last decade. Now both Motorola and Sony Ericsson will soon be added to the list. On average, it's as if one phone vendor has disappeared every year for fifteen years.

    And it's still not over. RIM is also becoming a going concern issue, and LG has a big question mark above it.

    Of course, ZTE and Huawei and Lenovo are joining the list of competitors but I note that they are not focused on mobile phones. They are opportunistic phone vendors, depending on other businesses to compensate for the risks inherent in phone sales. It's interesting to note that neither Apple nor Samsung are pure phone plays.

    In fact, of all the phone brands only RIM and HTC are exclusively phone-only companies. It may indicate something profound is happening. The notion that the development and marketing of phones as an activity independent of other business models may be coming to an end.