Asymco

Asymmetric Intelligence

profit

  1. Revolutionary User Interfaces

    Research · 226 comments

    A few years ago, around the middle of the last decade, the mobile phone market was characterized by the rivalry between a few established vendors. These were Nokia, Samsung, LG, Motorola and Sony Ericsson. These incumbent companies had a broad portfolio of devices including smartphones and feature phones and basic phones. Many also sold networking equipment and were deeply engaged with their customers, network operators.

    There was also a set of entrants who offered only smartphones.  They were quirky. HTC was a a prominent "ODM" or original design manufacturer who built phones for companies who added their brands and sold and supported the product. HTC made phones and PDAs for operator brands and for some large PC companies. It also began to sell phones under its own brand. RIM was also offering products that had evolved from pagers into email appliances with added voice capabilities. But RIM's products were not very good as phones. Voice was so poorly integrated that many people carried both a BlackBerry and a voice phone. Then there was Palm with something called a Treo which promised many things but did not quite deliver.

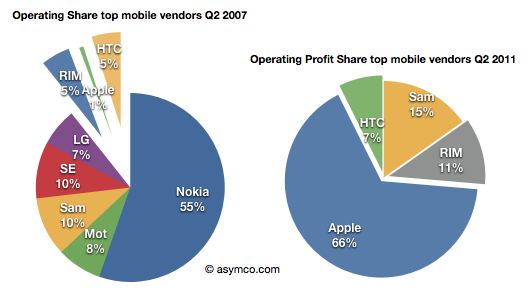
    In 2007 something happened which changed the industry. It took a few years to even realize it was happening but by the time it was obvious, it had changed to such a degree that huge companies found themselves in financial distress. This chart illustrates the effect.
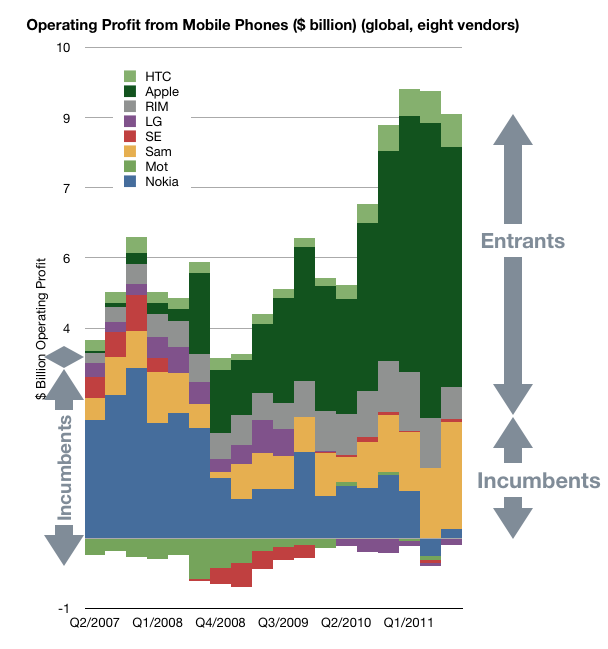
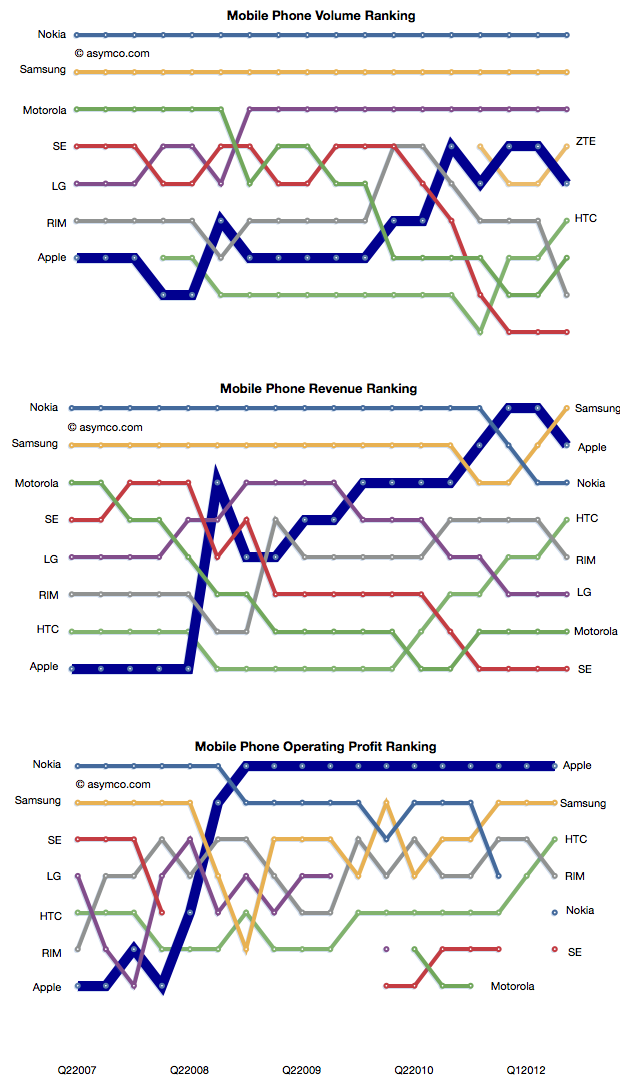
    In a few short years the rivalry between incumbent handset makers has evolved into a rivalry between mobile platforms where the incumbents were caught in an increasingly unprofitable role of hardware integrators. Motorola is now being absorbed by a search company. Sony Ericsson is being absorbed into a consumer electronics company. Nokia is going through a potentially existential crisis and even abandoned its platform. Acquisition talk surrounds LG's phone efforts. Samsung is prosperous but sill at the mercy of its software suppliers. Even the entrants are starting to feel beleaguered. RIM, the oldest pure play smartphone company is trading below book value and has regressed in value to 2004 levels. Palm evaporated. A view into the changes is the rankings of the companies in terms of volumes, sales and profit as shown below.
    How did large, powerful, smart companies let this happen?

    It happened despite having a clear, front row view of the transition of the industry from mobile voice to mobile computing. The shift in the basis of competition from "connecting people" to "connecting people to data" ended up being a classic disruptive trap. Many will argue that it was the failing of individual managers. Perhaps, but how did they conspire to fail simultaneously?

    When you see disruption happening, it's natural to seek out a cause, a pivotal magical "force" or event that enabled the weak to humble the strong--the proverbial sling that enabled David to defeat Goliath.

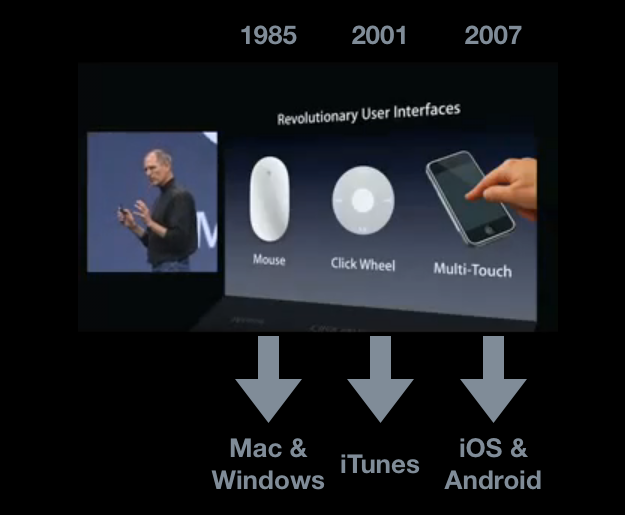
    My hypothesis is that The Primary Cause for the shift of profits from Incumbents to Entrants has been the disruptive impact of a new input method. I illustrated this with the help of the January 2007 slide presented by Steve Jobs at the launch of iPhone.
    Screen-Shot-2011-11-03-at-11-3-10.45.20-AM

    Each new input method led to not just a disruption but new platforms and new business models. Each new "sling" victimized a set of historic companies. Mainframe and minicomputers, consumer electronics giants and now telecoms.

    Just like David's sling, these technologies are not powerful in and of themselves, but rather, the way they are used makes them unpredictably sinister. The context of using capacitive touch on a handheld device rather than on a table-top makes it disruptive. Coupling it with high-speed mobile networks and powerful but efficient microprocessors made it into a force.

    That is now ancient history. The consequences and repercussions are still being felt and weighed, but the smart money should be focusing on the next shift. From the time frame in the diagram above, it's clear that the cycle time between "Revolutionary User Interfaces" is shrinking. It's been five years since multi-touch. Is the next "RUI" already here? Is Siri the next RUI?

    There are many things going for it:

    1. It's not good enough
    2. There are many smart people who are disappointed by it
    3. Competitors are dismissive
    4. It does not need a traditional, expensive smartphone to run but it uses a combination of local and cloud computing to solve the user's problem.
    5. It is, in a word, asymmetric.

    My disruptive hypothesis for Siri is that it shifts the competition from platforms positioned on a device to a "coupled" super-platform dependent on broadband and infrastructural computing.

    Just after collecting enough data and observing patterns in it that give us clarity, It looks like things are about to change all over again.
     

  2. Estimating Samsung's smartphone mix

    Research · 57 comments

    Samsung no longer reports mobile phone shipments. The company's phone market performance reporting is limited to the following:

    Shipment : High-20%↑YoY (low-20%↑QoQ)

    ASP : Slight increase QoQ

    As the company did not report volumes or ASP last quarter either, the QoQ (Quarter on Quarter) growth estimates are almost useless. The only fragment that might be useful is the "High-20% YoY" given that they did publish units for Q3 2010: 71.4 million. This leaves the question of what "High-20%" means. Here are some ranges and what the result would be:

    • 92.1 million assuming 29% YoY growth
    • 91.4 million assuming 28%
    • 90.1 million assuming 27%

    The "best guess" might be 91.4 million.

    As the company also provides revenue for its mobile division (14.42 trillion Won) we can therefore estimate the average selling price: $142. Is this a slight increase? By a similar approach, last quarter's ASP was $139, and assuming exchange rates did not vary widely, this increase is small enough to be called "slight".

    We also have a figure for the operating margin for the entire Telecom group (16.9%) which gives an operating profit of $2.2 billion.

    The last piece of the puzzle is the number of smartphones Samsung shipped. Samsung said smartphones grew "more than 300%" year over year. That would imply 31.4 million. One estimate is from Strategy Analytics that suggests 27.8 but it's coupled to an overall volume estimate of 88 million (well below the 91.4 million estimated above). The Wall Street Journal published an estimate of 28 million.

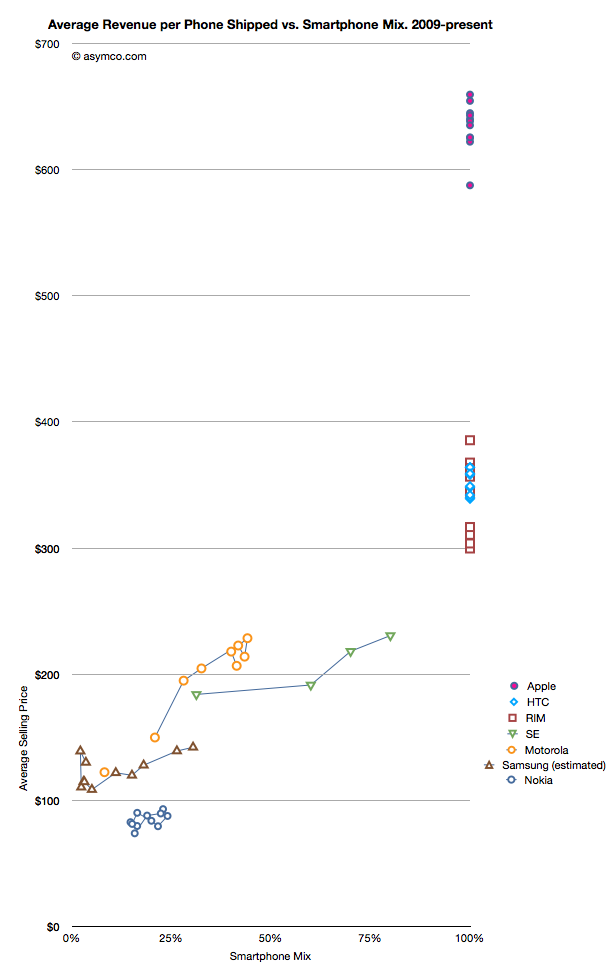
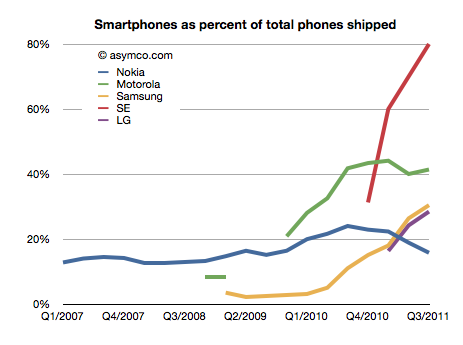
    I have no idea how to narrow down this estimate, but if we go with the one that claims the highest precision (27.8 million) we get an estimate of about 30.4% of Samsung's volumes being smartphones (what I call the "smartphone mix"). That is an interesting basis for comparing Samsung's smartphone business to other companies' smartphones. I prepared a graph showing how pricing is affected by the increasing mix of smartphones in vendor portfolios.

    What the graph shows is the movement of prices as companies have increased their smartphone mix since Q1 2009. For example Sony Ericsson moved from 31% smartphones to 80% smartphones in about a year. Their ASP increased from $184 to $231. Some companies have not changed their mix. Apple, HTC and RIM have maintained 100% smartphones in their portfolios so their pricing has been consistently high ($650, $354 and $357 over last 12 months, respectively). Conversely, Nokia has struggled with its smartphone portfolio and as a result its pricing has remained stubbornly clustered below $100.

    But the most interesting companies to watch are Samsung, Sony Ericsson and Motorola. You can see how their "vectors" or price migration point toward the sweet spot where HTC and RIM reside. Ideally, they would be very much better off with pricing in the $300 range.

    Samsung is moving quite rapidly toward the sweet spot but the slope is not as steep as the others. That's may be because SE and Motorola have much smaller volumes but it's still an open question why, with an estimated 30% mix of smartphones, the pricing remains $60 lower than when Motorola was at the same mix or $40 lower than Se.

    Some of the answer might be due to the number of "low end" smartphones (Bada?) that Samsung is selling or maybe their non-smartphone pricing is trending down a lot more rapidly.

    Keep in mind that if we change the assumption of the number of smartphones to a lower number (i.e. below 27 million) then the trajectory of the Samsung line in the graph would increase and may match more closely the slope of the other two vendors.

    I don't have any reason to believe that it's lower than 27 million but I don't have any reason to believe that it's above 27 million either. It's an estimate.

    If we believe it then we have to say that with a near tripling of smartphone mix (from 11% to 30.4%), the company grew its overall units by 28% and its revenue by 39% and pricing by 17%. Profits also grew by 130%.

    It would follow then that switching to a 100% smartphone mix would make a lot of sense.

  3. Quantifying the phobia of owning Apple shares

    Research · 51 comments

    As the market continues to exhibit signs of instability, an interesting paper[1] identified a correlation between the U.S. stock market and an index of the U.S. Financial Conditions. This index measures the assessment of the probability of a crisis.

    The conclusion is that an imminent crisis mentality pervades equities markets today and implies that pricing is largely disconnected from fundamentals. On this blog we've discussed the topic of fundamentals and marveled at how pricing seems to be largely exclusive of it.

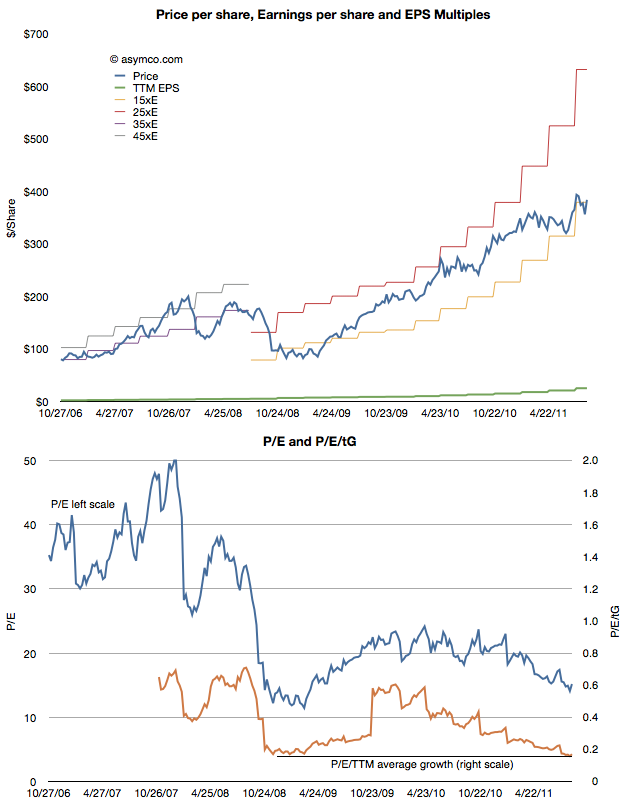
    The case is made by the following chart:


    The first chart shows the share price (blue) and the earnings per share (EPS in green) as well as several multiples of EPS. During the period of 2006 through 2008 the stock ranged between a P/E of 35 and 45. beginning with the collapse in confidence due to the banking crisis, the share price fell to within a range of 15 and 25. Now, with Apple's growth accelerating above 100%, the stock price seems to be sliding below the 15 P/E bottom.

    In the second chart I show the P/E in blue and the P/E/trailing Growth. Adjusted for earnings growth the equity is cheaper now than at the bottom of the last recession. You can also observe the trend or slope of the decline in the P/E/tG. It might be alarming to see the decline but it also might be comforting to know that the P/E/tG cannot go to zero. Either Price has to go to zero or earnings or growth have to go to infinity. The closer P/E/tG goes to zero however (it's at 0.17) the more undervalued Apple appears to be.

    Naturally these metrics of P/E are arbitrary and the price is simply what the buyers are willing to pay for the equity. But the value of any metric is the trend. The value can be compared to a different time or to a different equity. The trend here is that Apple, at least, is being discounted at a time when it's growing more robustly than ever.

    Which is why finding an explanation is so important. This is where the paper sheds some potential clues. The author concludes that there is a pervasive crisis phobia which affects multiples. Paulsen writes:

    If cultural mentalities were less crisis-phobic today, what would the PE multiple be on the stock market coming off a 12.8 percent profit quarter with a 2.2 percent Treasury yield and only about a 1.6 percent core consumer price inflation rate? Certainly, much higher than 12 times earnings! 16 times earnings? 17 times? This simply illustrates just how much the crisis-centric mindset is depressing investment potential and it also suggest how much opportunity there is to increase stock valuations just by improving the cultural mindset. Long term, the real investment opportunity is not a dramatic improvement in economic or profit growth (although either or both could occur), but rather is just a slow but steady decay in “crisis-fears” similar to what we experienced during the last recovery.

    ----

    Reference:

    1. A Crisis Phobic Investment Culture, James W. Paulsen, Ph.D. Wells Capital Management.
  4. The Mobile Marshalling Yard

    Research · 16 comments

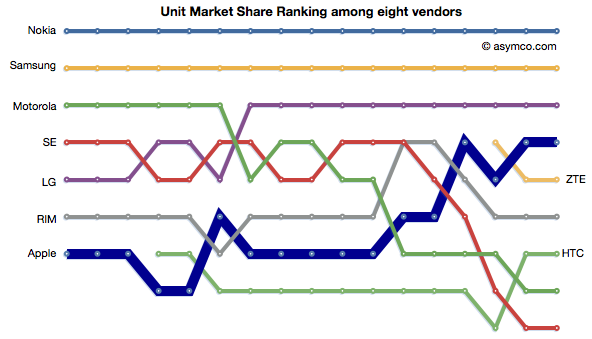
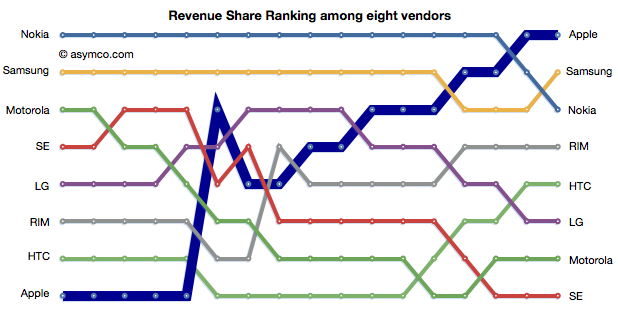
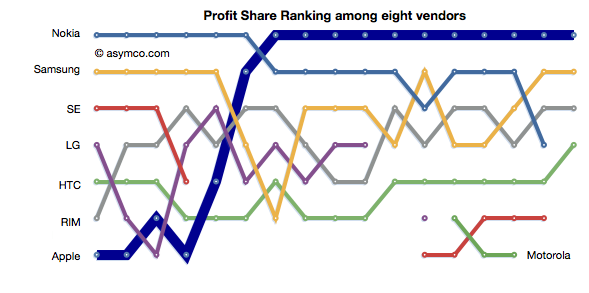
    The phone vendors' ranking relative to each other on three measures of share (Unit or Volume, Revenues and Operating Profit) is shown below:


    Although not much changed in the unit rankings since last quarter, revenues did see Samsung and Nokia trade places. In the case of Profitability, the chart shows a sparseness that is quite unprecedented. Only positive profit figures are charted.


  5. The fate of mobile phone brands

    Research · 99 comments

    The violence with which new platforms have displaced incumbent mobile vendor fortunes continues to surprise.

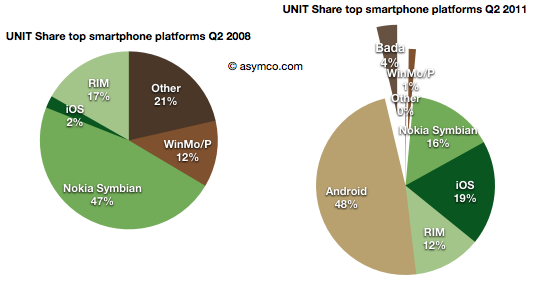
    • Nokia's Symbian platform has gone from 47% share to 16% in three years
    • Microsoft's phone platforms have gone from 12% to 1%
    • Other platforms have gone from 21% to zero
    • Although far less dramatic, RIM's decline from 17% to 12%  is causing acute pain and anxiety

    This while entrants have grown share in spectacular fashion:

    • Android from zero to 48% (A two year period)
    • iOS from 2% to 19%
    • Bada from zero to 4% (two quarters only)


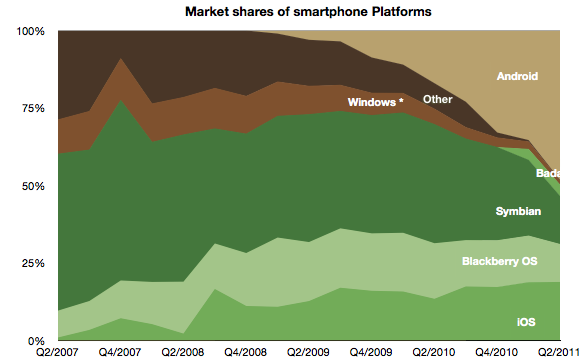
    The picture of platform share over time looks like this:


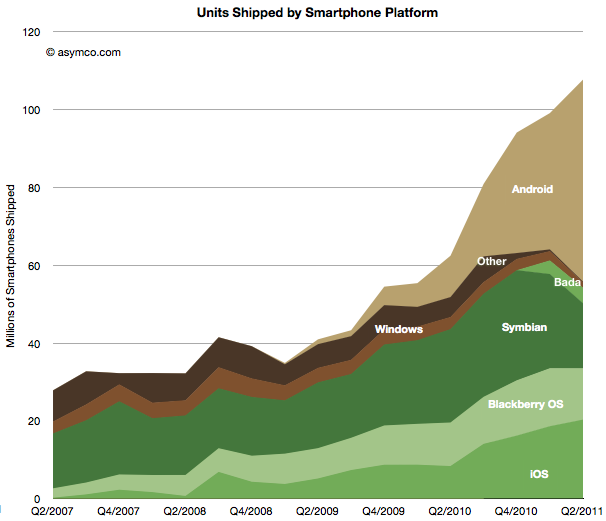
    The platform volume growth is shown in the following graph:

    Shocking

    Or is it?

    The surprising thing is that it should not be surprising. When the iPhone re-defined the basis of competition (at the beginning of the time frame of these charts) it unleashed forces which are still spinning the industry into a new configuration.

    In that context, Android is a natural consequence. As iPhone created a threat, the response from all other vendors (other than Nokia and RIM) was to seek something that would sustain their business. Android was salvation.

    It enabled the pursuit of better margins and hence better returns. So much so that Android offers the escape up-market they have always sought. It enables vendors to abandon the profit-free feature phones to low-end entrants like ZTE and Huawei.

    LG, Samsung, Motorola and Sony Ericsson all took the bait. They are racing as quickly as possible to turn their feature phone portfolios into Android portfolios. This is certainly something that Google also wants to see happen and has been planning all along.

    However one of the consequences of the modular (aka "open") approach is that the low end disruptors gobbling up low-end share are also motivated to move into the Android business as soon as it comes within reach.  The only reliably predictable consequence of Android will be the postponement of displacement of the existing brands by the low-end entrants.

    Is this fate unavoidable for all brands?

    Clearly some vendors see the trap. For all its apparent failings, Nokia saw this outcome and chose to attempt a "Hail Mary Pass" with Microsoft. The strategic point being that because they no longer had faith in their ability to execute on an independent platform, they would pick a platform that gave them at least some control or leverage. There are serious risks and problems with this approach--something which has been covered here already--but the bet being made is a clear rejection of the slippery Android slope.

    RIM is trying to resist with QNX which is a similar approach but timing may also be the undoing of this strategy. HP's approach with WebOS and Samsung's Bada are also hedges to avoid this fate.

    And what about Apple?

    Apple is always skating in a different direction. iOS needs to be seen as not so much a phone platform but a computing platform. Given what we know, iOS was always conceived as the future of computing. Voice, after all, is just an app on iOS. So my expectation is that Apple's iOS will continue its attack on the mobile computing market, skimming (or carving as the case may be) profits from the phone business to sustain its ultimate target of reclaiming the computing universe.

    By this thinking iOS lives only by improving more rapidly than anything else in dimensions that redefine the basis of performance. In other words, doing more of what the iPhone did in the first place to set off this disruption.

  6. A new view into the phone market

    Research · 54 comments

    The profitability (aka Profit/Phone x Phones Sold, aka Rawr) chart is a great way to see the "shape" of the industry at a glance, with attention to volume and profitability.

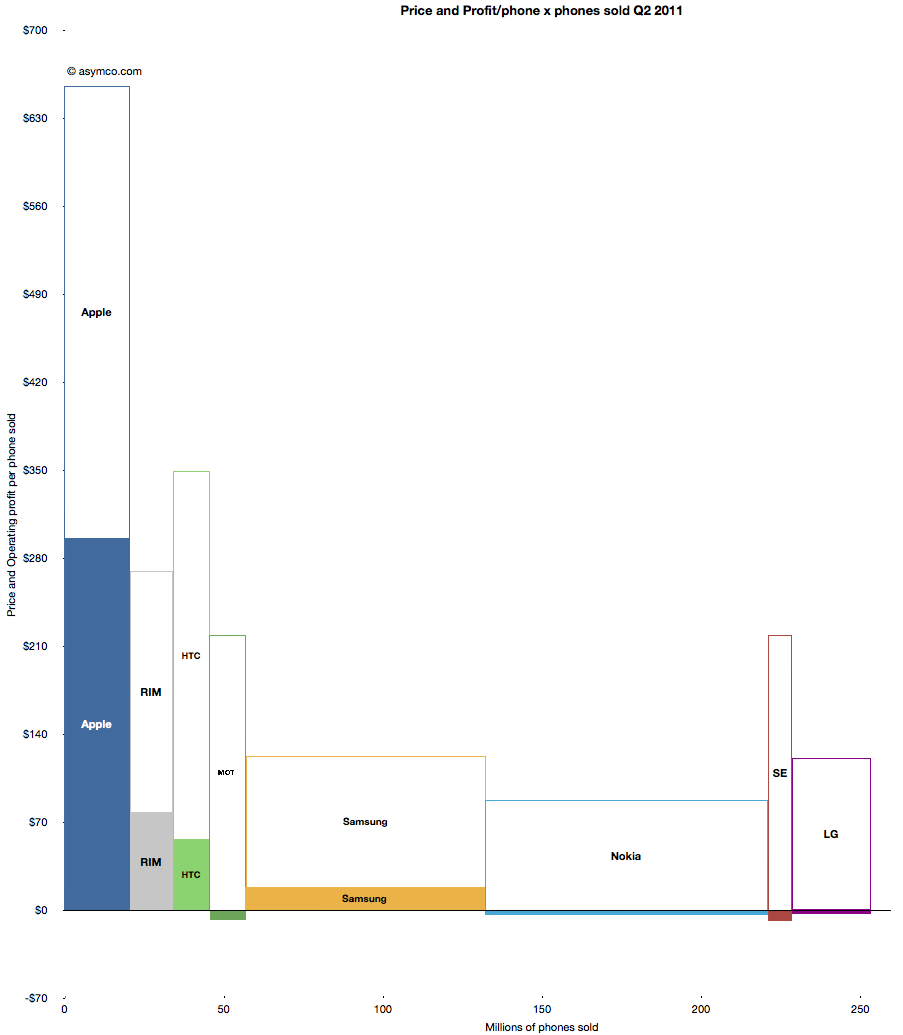
    What is missing however is a perception of the sales level and the pricing of the products. To help in that regard, I prepared an extension to the profitability chart which covers the price and sales for each participant.

    You can interpret this graph as an extension of the profitability chart where the "empty" or white areas above each profit area are payments to suppliers and operating expenses. Thus the sum of empty and filled areas (above zero) are equivalent to revenues. If the sum of the empty and filled areas are greater then revenues (i.e. they extend below zero) then the difference is operating losses.

    The top of both empty and filled rectangles are set at the average selling price per phone (and the top of each filled rectangle is the operating profit per phone). The width of both rectangles is the volume of phones shipped.

    The things you can read into this chart are:

    • Margins at a glance (ratio of filled area to total area)
    • Sales as well as profit relative to peers (top of each box relative to others)
    • Pricing power (overall top relative to competitors)
    • Any combination of the above

    Finally, the sum of all the areas are the overall market revenues for the quarter. Sum of white areas are expenses and sum of solid areas are profits & losses.

    A natural evolution of this chart would be to animate it across multiple quarters/years.

  7. The Profit/Phone x Phones Sold Chart

    Research · 28 comments

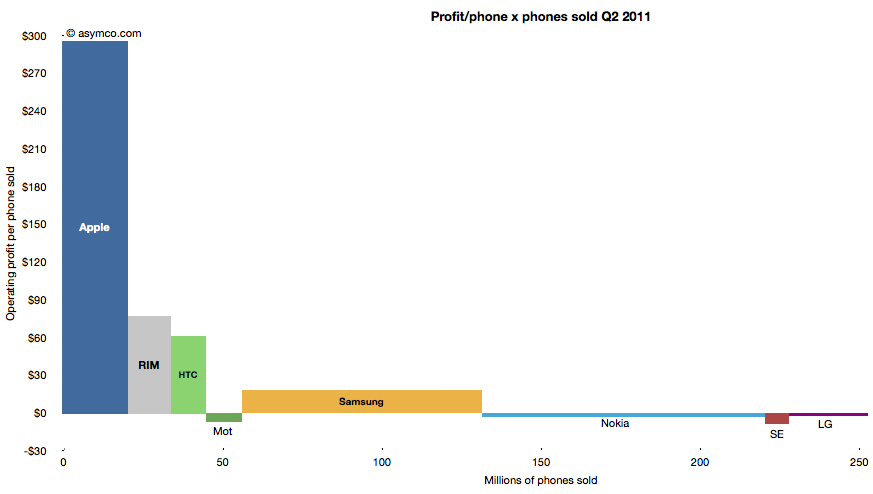
    The following chart shows the current profit distribution between phone vendors with an eye toward identifying volume dependencies. The vertical axis represents operating profit per phone and the horizontal axis the number of phones sold.

    The area of each vendor bar is therefore the total operating profit that vendor captured. A vertical (portrait) orientation implies high profitability with relative low volume while a horizontal (landscape) orientation implies a high volume/low profitability focus.

    The other important observation is that bars can also be negative. Those vendors' names are listed below the bars rather than within them.

    You can also compare the chart with the one from last quarter:

    The Rawr Chart | asymco

  8. Apple captured two thirds of available mobile phone profits in Q2

    Research · 81 comments

    The major publicly traded phone vendors have all reported results for the second quarter. Based on the data available so far we can begin putting together a picture of the market.

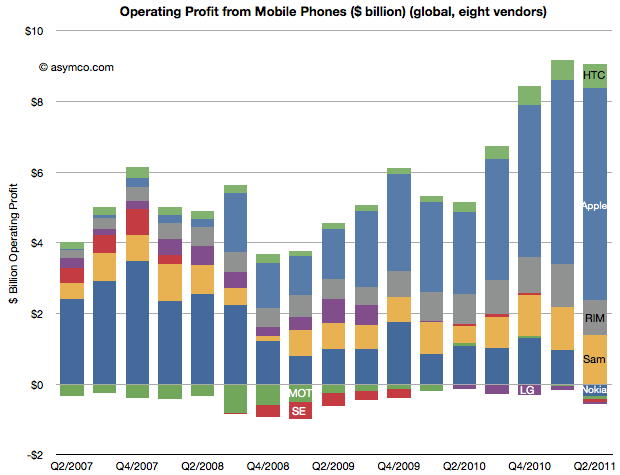
    The first picture I'll draw is usually the last: profitability. The following chart shows operating profit from the sale of mobile phones among the eight vendors I follow (Nokia, Samsung, LG, Sony-Ericsson, Motorola, HTC, Apple, RIM).

    This quarter saw a slight sequential decline in overall profit for the sector, but four vendors did not manage a profit from selling phones. Nokia, Motorola, Sony-Ericsson and LG all saw losses. The other vendors split the slightly decreased pie with Apple getting two thirds of it (66.3%)

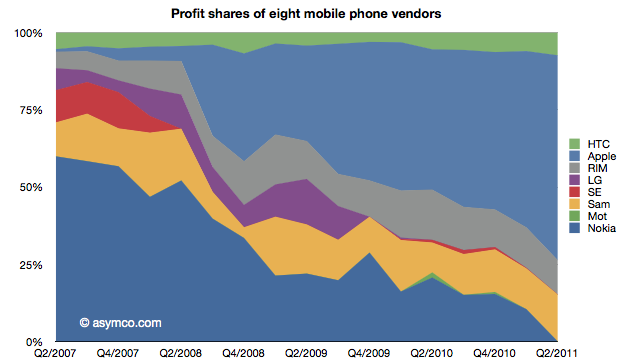
    This share is up from 57% in Q1 and 50% in Q3 and Q4. Samsung's share went to 15%, though that's not a peak level historically. In Q1 2008 the company was at 21%. RIM was at 11%, a level in a range that has been unchanged for three years. Finally, HTC captured 7.4%, a new high and an increase from 6% since last quarter.  The profit share chart follows:

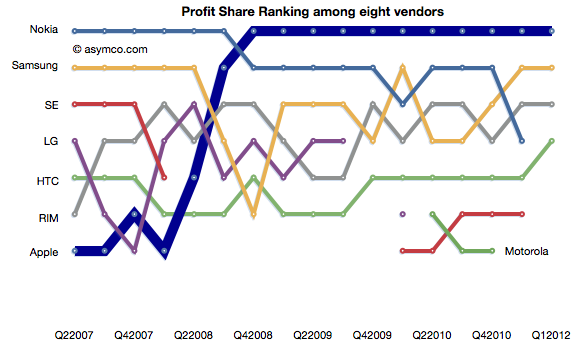
    The ranking chart for profitability follows:

    Finally, the "before-and-after" view of profit capture showing the change in profit share over a four year period.


    The story remains largely unchanged from last quarter: Three companies which captured 11% of the profits before the modern smartphone era started (four years ago!) now capture 84% of the profits. Only one global brand phone vendor selling non-smart voice-oriented feature phones is still profitable however, as we shall see later, the only reason profits still exist for any vendor is due to the strength of their smartphone portfolio.

  9. Apple has moved on

    Research · 36 comments

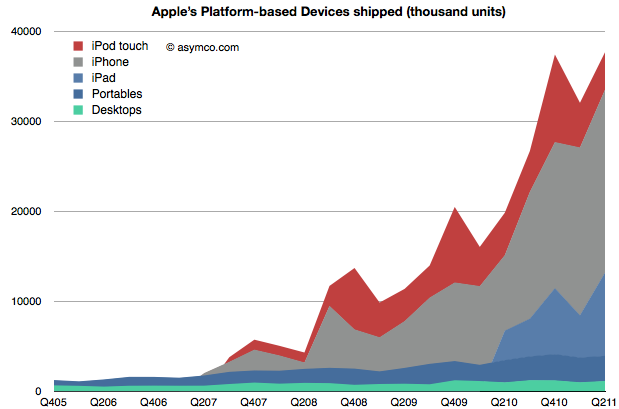
    When Apple changed its name from Apple Computer to Apple Inc. they signaled that their business has moved on. We can say it's to devices or to mobile computing or to the Post-PC era. To understand that this is not a shift driven only by wishful thinking we can plot the change in volumes for the platform-based devices Apple sells.

    The stack of products is shown in an increasing level of mobility. At the bottom is the non-portable desktop Mac, above are Mac portables (laptops) followed by the iPad, iPhone and iPod touch. The mobile computers Apple sells are explosively more popular (and important).

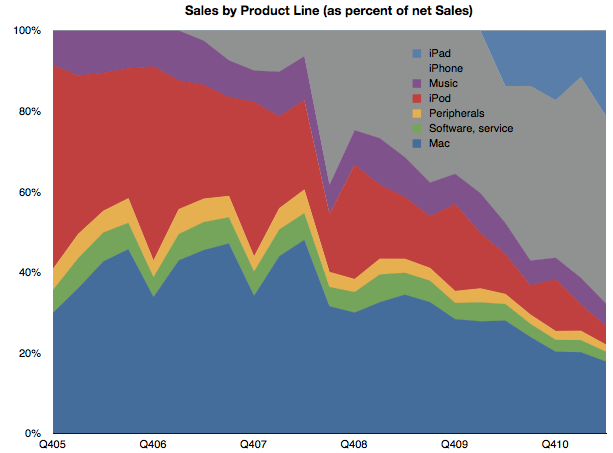
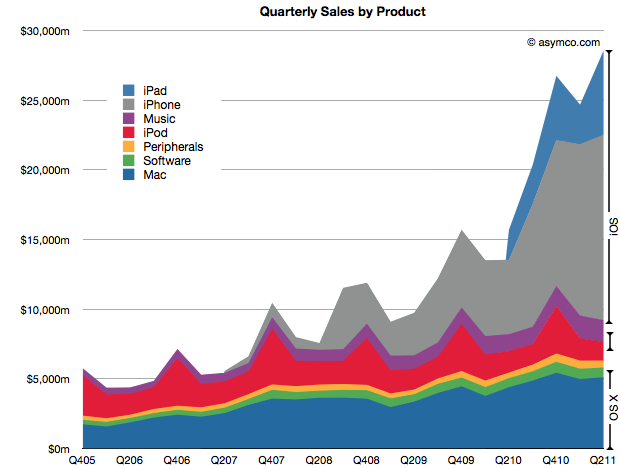
    To gauge importance consider the following chart which shows the unit values above multiplied by the average price they are able to obtain for a picture of the sales mix.

    (I also added Peripherals, Music and Software sales as well as iPod (non-touch) for a complete split of revenues).

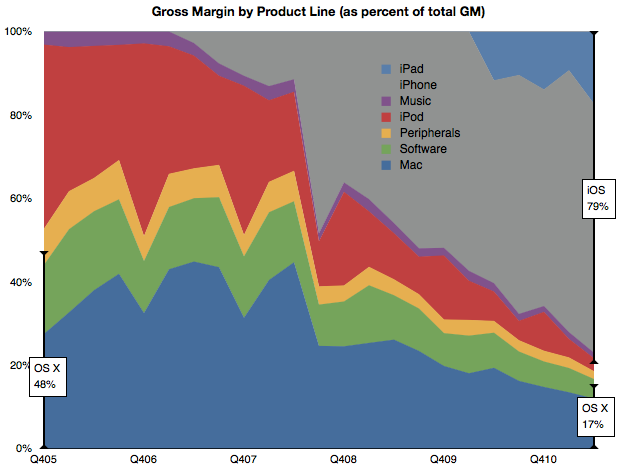
    Mobile computers are now well above half the revenue base for Apple. Finally, if we consider the contribution to profitability of each product line, we can see how iOS-enabled products (as a proxy for mobile computing) have become the vast bulk of profit creation for Apple.

    By this metric, we can see that mobile computing (as opposed to portable or immobile computing) is driving 80% of Apple's profitability. This 80/20 mix of mobile/non-mobile should put aside any doubts that Apple has moved on to be a business oriented around mobility rather than traditional computing.

    This cannot be said for many of Apple's contemporaries. Microsoft derives negligible revenues from mobility. Neither does Intel, nor Dell or HP and even Google's revenue lines don't make mention of mobile income.

    In fact, the only companies which do have mobile revenues as 80% of their income are those dedicated to telecom markets. Namely, Nokia, Motorola, Sony Ericsson, RIM et. al. But, as we shall see in the quarterly mobile market overview, few of Apple's mobile-focused competitors are doing well.

    So Apple is a unique company that has made the transition from one industry to another and, in so doing, captured the bulk of the profits. In passing, I should also mention that the traditional Mac business is still doing well and, by some measures, is capturing the bulk of the PC hardware profits.

    So the key to much of assessing Apple's value and opportunity should be based on this new market (mobile computing) rather than the traditional competitive landscape of PCs and operating systems. The company has moved on, now we wait to see how long before analysis of the company follows.

  10. Apple's growth scorecard for second quarter 2011

    Research · 83 comments

    Apple's second calendar quarter was a record breaking performance. This is surprising because it shows super-seasonal performance. For as long as I can remember the fourth calendar quarter (i.e. holiday) was always the strongest quarter, by a large margin. This quarter was higher than the last holiday quarter. A glance at the following chart shows the anomalous performance:

    iOS products make up 71% of sales (and at least 78% of profits) which makes the following growth scorecard a bit moot.

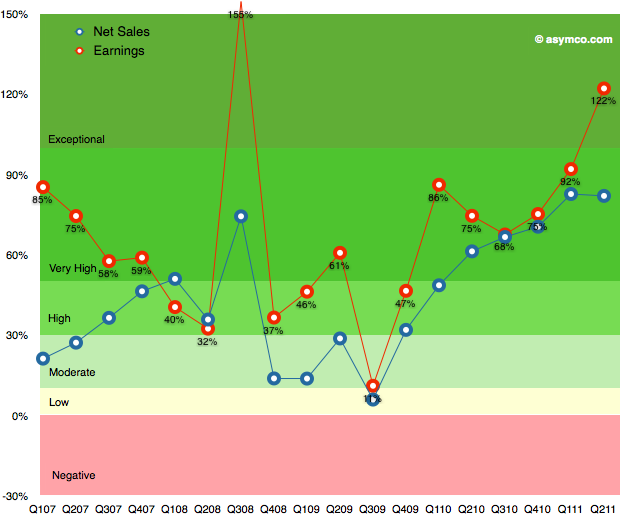
    The growth in iPhone sales of 150% is hard to understand given the previous product cycle, but more about this later. The 122% growth in profits is (nearly) unprecedented. The growth in Q3 2008 was due to the launch of the iPhone 3GS and since there was no iPhone launch this quarter the growth shatters existing assumptions about the franchise.

    The pattern in the table above is shown in the following chart:

    This performance needs to be digested and contemplated a bit longer but I will make one early conclusion: One of the most common themes during the last year was that Apple's growth rate was unsustainable. The theory cited was one of the "law of large numbers". Apple's performance shows it to be nonsense.

    Instead of decelerating, Apple's growth is accelerating.


  11. A new mobile phone market index

    Research · 90 comments

    Measurements of "share" are abundant. There is journalistic value in summarizing performance in a single figure of "share" but it usually is a very limiting view. For example in the global mobile phone market there are at least the following measurements available:

    1. Share of all handset units sold
    2. Share of installed based of handsets (penetration)
    3. Share of smartphones
    4. Share of mobile computers
    5. Share of value (revenues) captured
    6. Share of profits
    7. Share of platforms
    8. Share within a given platform
    9. Share by regions/countries/geographies/demographics

    One could go on. So performance in a market can only be measured if you know to what end is that measure applied. Are you trying to determine current performance or are you assuming that the future will be different and trying to figure out what that future will look like?

    There is no good answer. It depends. But at least we can combine more than one share value into a summary. Mark Hernandez suggested that I put forward a "composite index" to measure vendor performance. I am willing to give it a try. The first iteration can be an unweighted average of four "shares":

    1. Share of all handset units sold (global)
    2. Share of smartphones
    3. Share of value (revenues)
    4. Share of profits

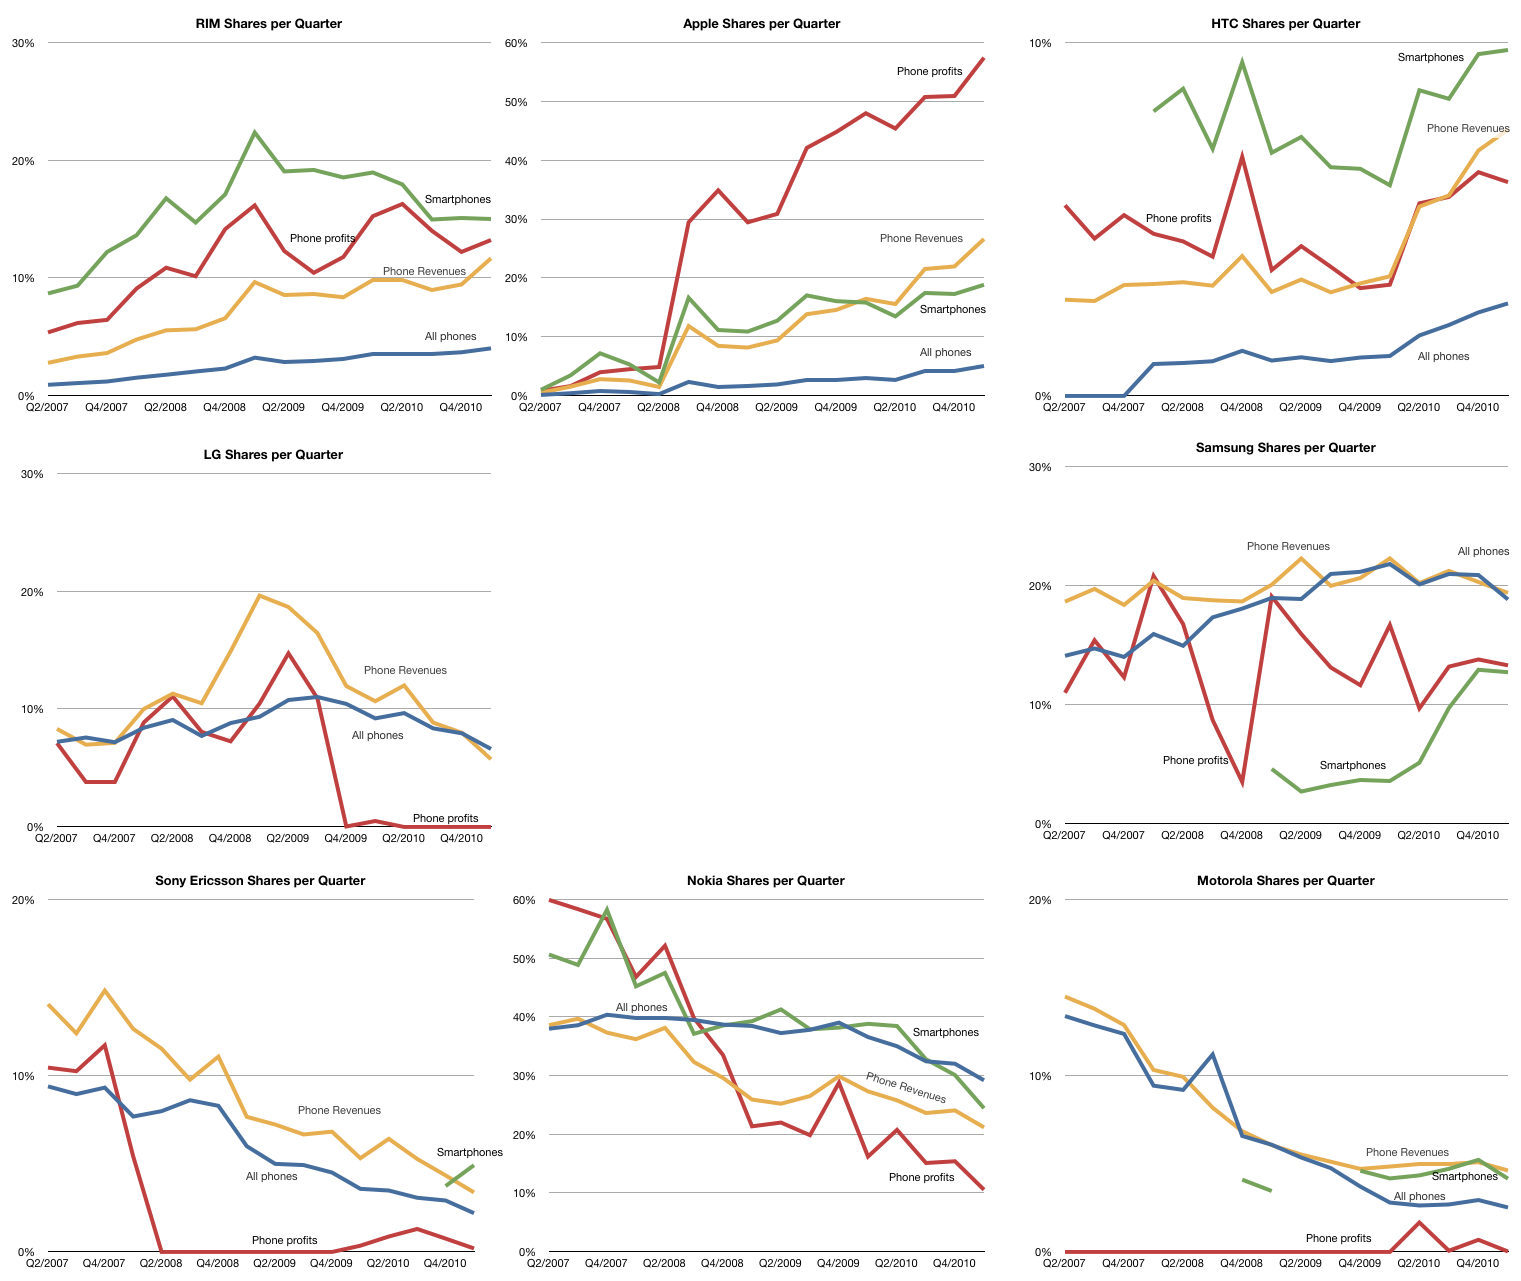
    The raw data for each share is shown in the following charts (note change of vertical scale: each gridline represents 10%).

    Note that the vendors are arranged in a particular way: top row are entrants, bottom row are incumbents with late incumbents from Korea arranged in the middle.

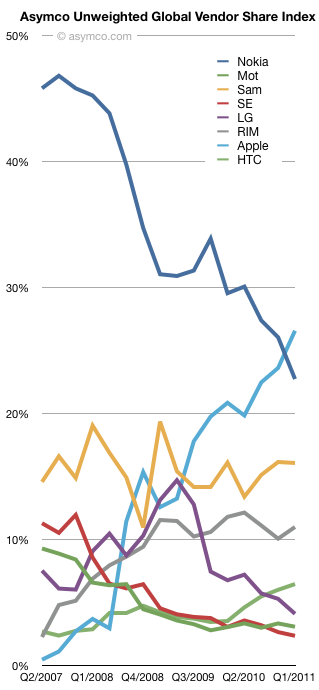
    Taking the average of each of the lines above, the unweighted share index (Units, Smartphones, Value and Profit) is shown below:

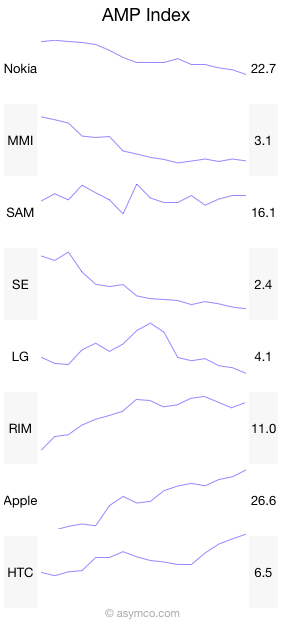
    Over the time period since Apple's entry in the market, the index shows interesting patterns:

    • Apple and Nokia trading places
    • Relative stability for Samsung
    • A leveling off for RIM
    • The Peaking for LG
    • Very tightly coupled declines for Motorola and Sony Ericsson
    • Gradual improvement in HTC

    And here it is in sparklines:

    Like many indices, this is a generalization that measures a section of reality. The value is in its use as a benchmark. If nothing else, it has journalistic value. I'm open to suggestions on how to improve it. Perhaps some form of weighting would be useful. Also, if anyone can suggest good name for it, it might be easier to communicate.