Asymco

Asymmetric Intelligence

recession

  1. Why Apple is cheap

    Research · 186 comments

    Imagine it's late 2005. Apple's fiscal year just ended and they reported their performance. You're an analyst whose job includes forecasting the company's performance for next year. This is a weighty responsibility.  Your forecast will be blended with those of your peers and used as a "consensus" average. That consensus for the next year will be used to measure the current value of the shares in a ratio called the forward PEG or Price/Earnings/annual earnings Growth. You are supplying the earnings and hence growth forecast while the market offers a price.  As a stock is meant to measure future earnings, your forecast is a crucial and frequently cited figure about whether a stock is priced fairly.

    There is some comfort in knowing that there will be many others who will offer such a forecast and your contribution is thus not the only way investors can calibrate the price. However, you should think hard about what you are predicting as it also will reflect your skill in predicting such a visible company.

    Apple just had a tremendous two years. 2004 and 2005 saw EPS grow at 274% and 337%. This is largely due to the runaway hit iPod. Given all that is known about the company, what will you put forward? While you're at it can you also forecast two years forward, namely provide a growth forecast for 2006, 2007 and 2008?

    Here is what you and your cohorts publish as a consensus:
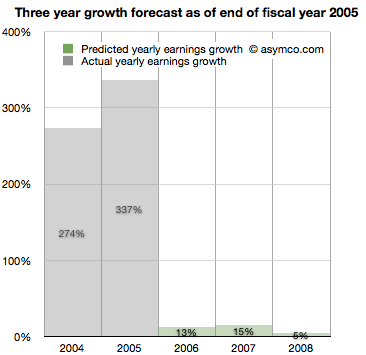
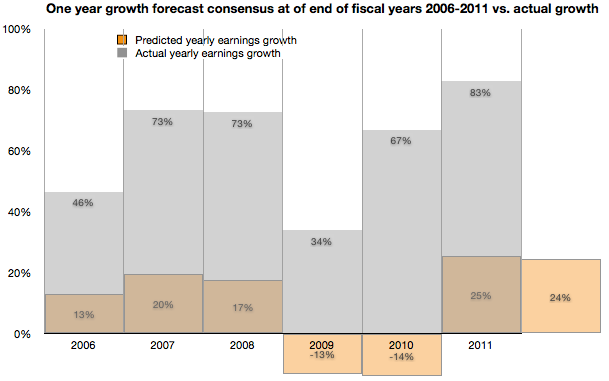
    You go with a 13% growth for 2006,  15% for 2007 and 5% for 2008. The chances are, you reason, that the iPod will not carry the company's growth much longer. The competition is sprouting all over and Microsoft is rumored to be launching its own music player.

    It makes sense to be conservative and offer a modest growth of 13%. At the same time you can rate the stock a buy as it is still growing. The stock just doubled in the last 12 months and the law of large numbers says that growth cannot last at the same rate as we've just seen.
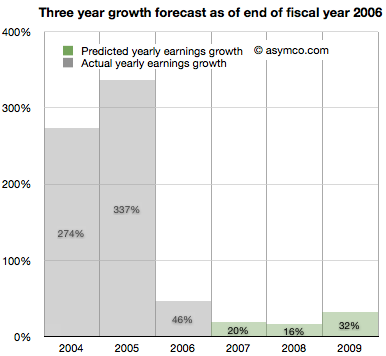


    It's now late 2006. Apple just closed out another big year. Contrary to your forecast last year, the company grew at a rate of 46%, more than three times faster than you expected.

    It turns out the iPod still has some legs and the company's Mac business seems to be growing. Looking forward you take your 15% growth for 2007 and increase it to 20% and suggest 16% for 2008 and 32% for 2009.

    There are rumors of Apple getting into the phone business.
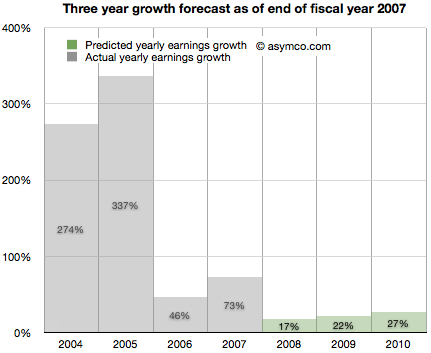
     

    It's now late 2007. Apple just launched the iPhone and even though it was available in limited numbers on one carrier for one full quarter, the company still turned in an amazing 73%. Again more than three times faster growth than you forecast. What do you do about 2008?

    It might make sense to increase the previous 16% estimate to 17% but since there is a real estate bubble brewing, the 32% growth for 2009 should come down to 22% and defer that growth out to 2010, dialing in 27%.
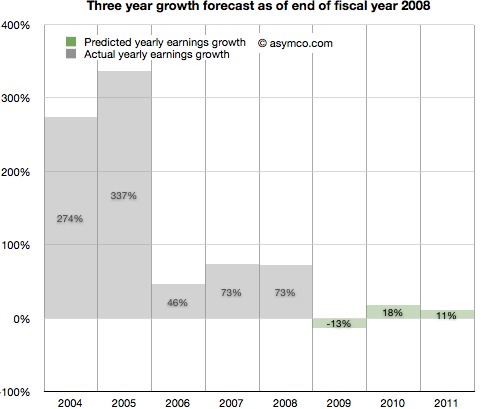
    It's now late 2008. Apple closed out another huge year. 73% growth was once again more than triple your forecast of 17% growth. It's clear that the iPhone is a huge hit.

    However, there is a credit crunch and talk of a huge recession, even depression looming. Apple is a luxury/premium brand and it is unlikely that those expensive products will sell well into these "macro headwinds". You predict a decline in the earnings of 13% in 2009, inline with many other tech stocks. You are optimistic however that 2010 will be a year of recovery and predict 18% increase from recession lows followed by a more reasonable 11% growth in 2011.
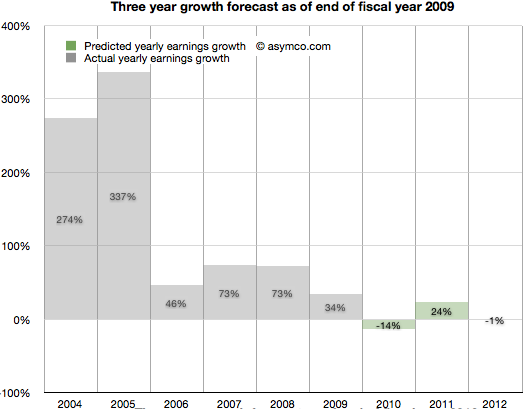
    It's now late 2009. To everyone's surprise, Apple grew through the credit crisis. It turned in 34% growth (vs. your predicted 13% decline). The success is hard to believe but the iPhone had a lot to do with that. There are new competitors coming and the recession has proven resilient. With unemployment still high you predict 2010 will still be a tough year. You go with -14% growth for 2010 and postpone recovery out to 2011 with 24% "bounce". Longer term you see 2012 as a flat year, with Apple earnings shrinking slightly by 1%.
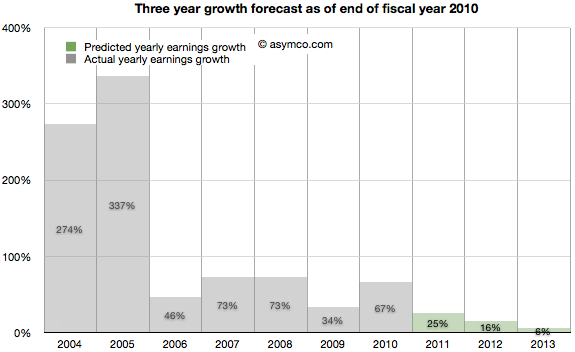
    2010 ends with Apple achieving 67% growth. Shocking relative to a -14% growth forecast. But then again, Apple launched the iPad and who could have thought that was a hit? Apple achieved growth throughout the recession and it looks like it might keep going. Your 2011 forecast of 24% looks weak so you increase it to 25%. The 2012 decline thesis is abandoned in favor of 16% growth and, given the likely competition in smartphones, you tone down growth in 2013 to 6%.
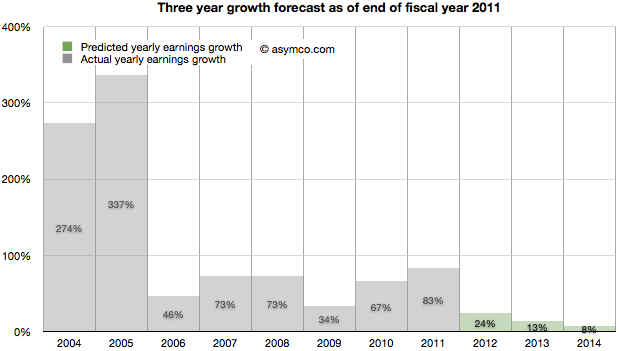
    It's November 2011. The company turned in 83% growth. It's  more than three times faster than your forecast. Some people are suggesting that Apple may have a lot of headroom with the iPhone and iPad but the law of large numbers is what it is. The company became the largest by market cap in the world and Android is gaining huge market share. However, in deference to their strong recent performance you increase the 2012 forecast from 16% growth to 24% growth. 2013 goes from 6% to more than double: 13% and 2014 is when growth begins to slacken, though still a healthy 8%.

    As the following chart shows, look ahead one year accuracy has not been all that great, but you are at least consistent. In any case, everything you based your decisions on showed remarkable consistency with consensus. You're just reflecting common sense.
    Note:

    • Though the numbers are all real, the narrative is fictitious. I suspect however that the truth is actually stranger than this fiction.
  2. The thermodynamics of Apple's share price

    Research · 82 comments

    Andy Zaky at Bullish Cross wrote a great post on Apple’s valuation, showing the deep discount of Apple's earnings vs. an average company. It essentially states that Apple's money is not green.

    Felix Salmon took it forward by enumerating a few explanations that might be used for the despondent valuation. None are successful arguments, but that should not be a surprise.

    To understand the phenomenon a bit more precisely, I maintain and think about these charts:

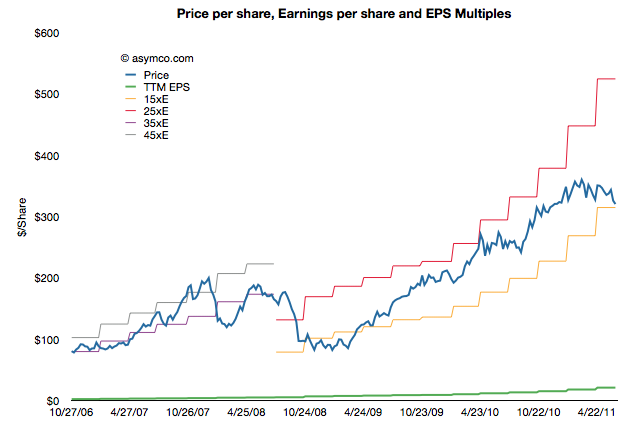
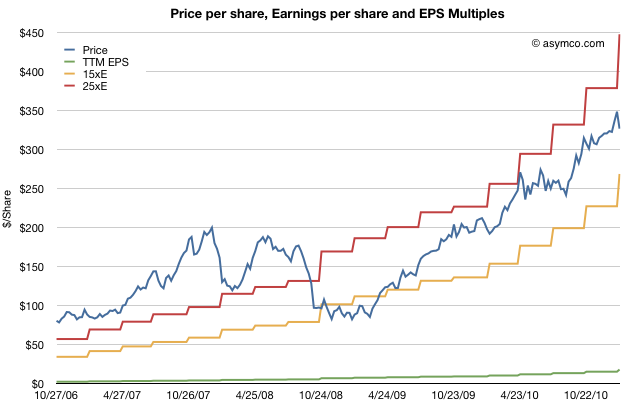
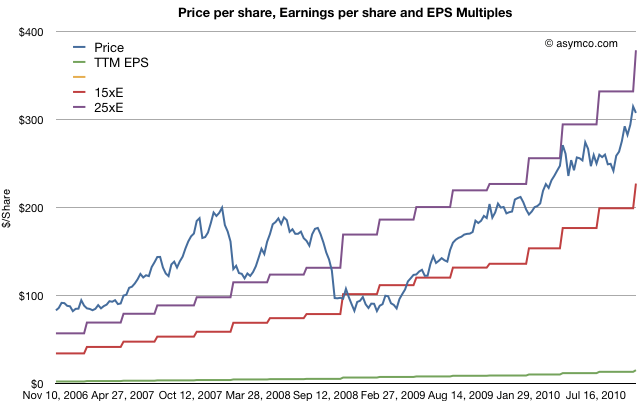
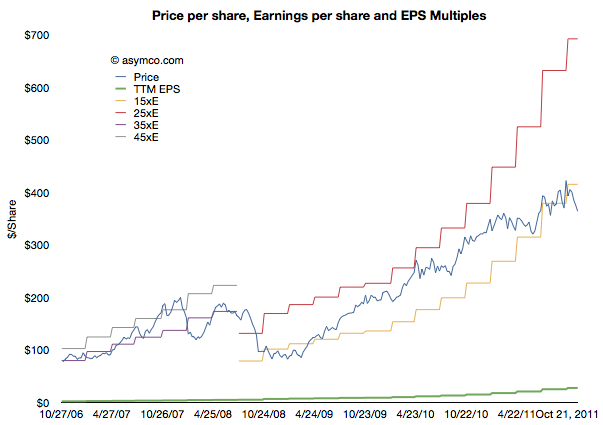
    This shows Apple's share price ("P" in blue) and its earnings per share ("E" in green). In addition there are multiples of the earnings in "bands". The first band is 35xE to 45xE which bounded the price during the period of 2006 through most of 2008. The second band is 15xE to 25xE which bounded the price since then. The data is updated weekly so it is current as of last Friday.

    Illustrating it this way shows how the stock is seen as representing different companies at different times. The 2006 era (iPod) Apple was seen as a high growth, dynamic company with loads of headroom for growth. The current (iOS) Apple is seen as a slow growth, fairly static company with most forecasts showing 20% growth potential.

    Note that the price has dropped outside the current band for the first time since the great recession. It is still below 15xE today. Perhaps a new band is forming.


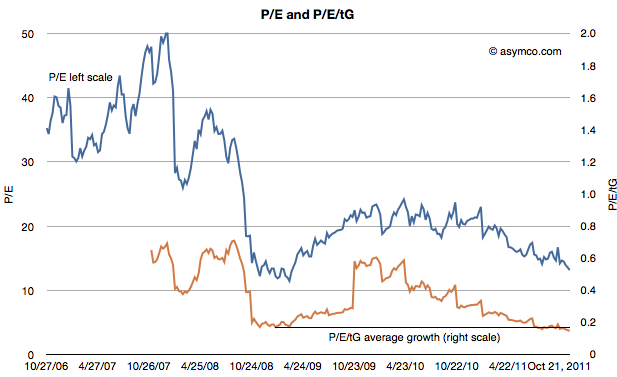
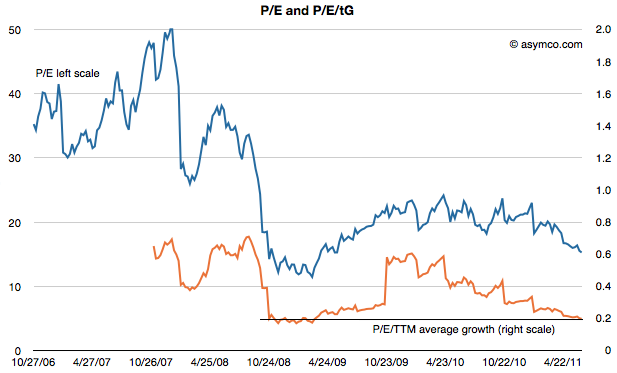
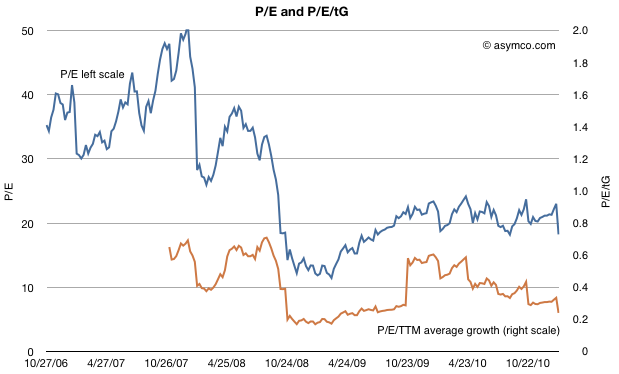
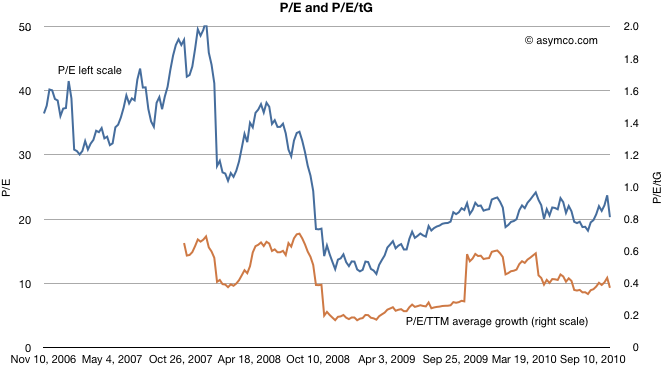
    The second chart shows the P/E on its own (in blue) but with a second measure where the P/E is divided further by the average trailing twelve months' growth (P/E/tG). This is a variation on the P/E/G (aka PEG ratio) where instead of (mostly wrongly) estimated future growth I use actual growth history--hence the t for trailing. The P/E/tG is a way to normalize P/E as a function of growth and hence a more appropriate index of value potential.

    I added a horizontal line to the chart to show the minimum value P/E/tG reached during the recession (0.17 in January 2009). As you can see, the P/E/tG is now lower than at that time (0.15). It implies a deeper discount for the company's earnings growth than during the time when the world faced economic contraction.[1]

    Note also the trend of that line as it shows a steady linear path toward zero.

    Of course, it cannot reach zero unless Apple files for bankruptcy. But until it does file, the line can only reach zero asymptotically as E/tG increases. Which is a relief, I suppose, as it means the rate at which P/E/tG drops will decrease. This implies that as earnings growth persists, the drop in price will have to moderate.

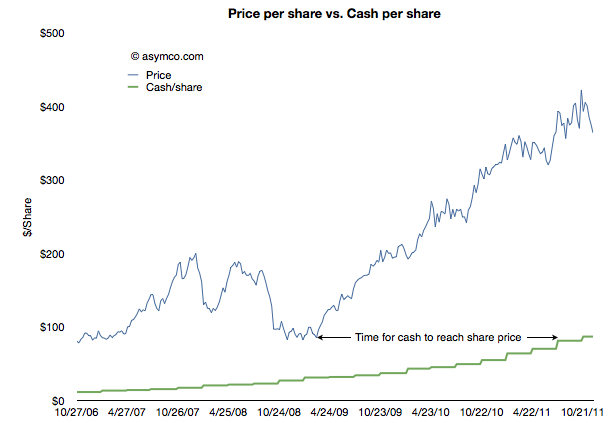
    The other threshold to keep an eye out for is when Apple's share price will reach its cash per share. That's the point when investors will consider the company to be a net value destroyer. If you performed that analysis in January 2009, and you were accurate about earnings forecasting, the answer would be well before today. See the following chart:

    In other words, in January 2009 the stock was trading at a price (<$80/share) below the current cash per share (>$85/share). It took Apple 18 months to grow its cash to reflect the price set on the company. Had the stock not risen then the company would today be trading below book value.

    The amazing thing is that today the valuation structure (P/E/tG) is even worse than in it was January 2009. An interesting exercise would be to project how long it would take for the cash to increase to the current share price.[2]

    I imagine this time interval should have a name. How about the time to boil: the time for growth pressure to become sufficiently high to exceed disbelief that growth can happen.

    ---

    Notes:

    1. Note that the low values were placed on the company after the crisis took hold, not as an anticipation of contraction. See the behavior of the index during the summer of 2008 as the credit crisis was unfolding.
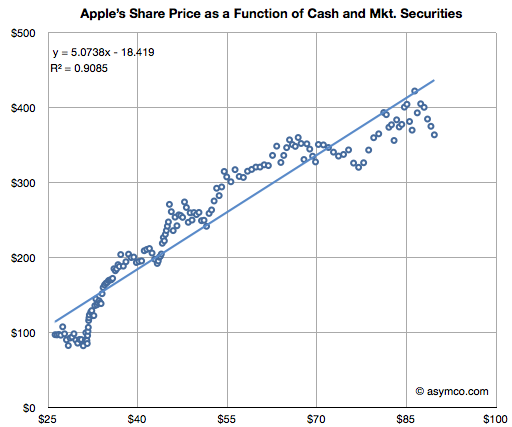
    2. This analysis is consistent with the analysis that Apple is not valued on earnings or earnings growth but on its balance sheet. The ratio of Price/Cash has been fairly constant but if it breaks down (as it has been--see below) then we need to assume a new dynamic is in place. 
  3. Apple's Guidance Deficits

    Research · 94 comments

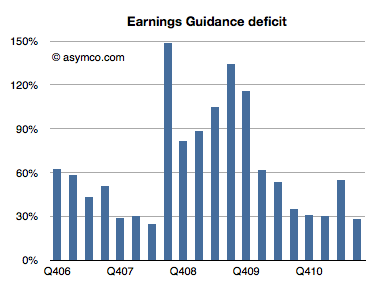
    Every quarter Apple's management issues a "guidance" or forecast of their own earnings in the following quarter. Over the years, this figure has been nearly useless because not only is it not accurate, the error itself has been wildly variable. I plotted what I call the Earnings Guidance Deficit for Apple based on the formula (Actual EPS diluted - Guidance)/Guidance.

    The higher the value in the bars above, the more the company underestimated (or under forecast) its performance. Note that during the recession the company routinely offered guidance at half the level they actually delivered. After the recession they returned to a more reasonable ~30% under-reporting.

    The problem with this analysis is that there is such a high volatility in this factor that we can't count on it to predict where earnings will fall. Even if we saw a range bounded at 30% to 60% the usefulness of this would be very low as that is far worse than the range that analysts can get through other means (Deagol's accounting of analyst error). The best thing we can say is that the range seems to be bounded by 30% and 150%.

    Rather than using this history for precision, perhaps it makes more sense to assume that the lower bound offers at least some limit to the possible value of next quarter's earnings. Maybe it can give us a "sanity check" for our own estimates.

    For the next quarter Apple guided $9.30 per share. If we assume a 27% "deficit" which is at the lower end of the range above then the earnings are likely to be about $11.8.

    That's equivalent to an 84% growth in earnings year/year. It would also imply $33 for the 2011 calendar year. At the current share price of $384 that implies a P/E of 11. That happens to also be the P/E for Apple at the trough of the recession in January 2009.

    In other words, if the stock price does not rise (or falls) from the current level by the time earnings are reported in late January, then the P/E for Apple may drop to less than 11 on growth of 83%. That's a sanity check all of its own.


  4. Thinking over Apple's value

    Research · 71 comments

    In intra-day trading Apple's stock price traded at a P/E ratio below 15. That threshold is now at a price of about $315/share. Excluding cash the P/E is under 12. On a forward basis, there is widespread agreement that Apple has the reward (yield) profile of a bond without the risk of inflation.

    The history of the P/E ratio and the share price is shown in the following chart:

    As the chart shows, Apple traded in a range of P/E between 35 and 45 until late 2008 and has been trading between a range of 15 and 25 since about spring 2009. It might seem that the price is rewarding growth, but it's not.

    When adjusting for the growth the company has maintained, the company is at a similar P/E/tG (Price/Earnings/trailing Growth) to the depths of the recession.

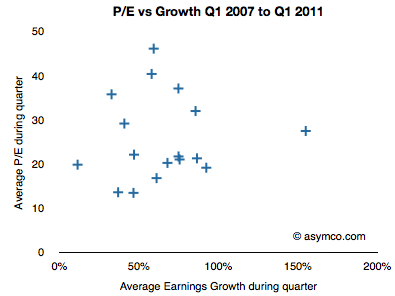
    At the trough shown above, the company was growing earnings at high 30% rates and sales in the teens. Today the company is growing earnings at 92% and sales at 83%. the following chart shows P/E ratio vs. growth.

    From a historic perspective, Apple is as cheap as it was at the bottom of the recession. At the time there were many reasons given for why the company would suffer 'headwinds'. Most commonly cited was that the company was a maker of "luxury" products and luxury does not sell in a recession.

    Today reasons being given for why the company will not prosper are far more nuanced. I won't re-iterate them but they deal with competition, platform issues, production issues, sympathy with companies that are failing, and saturation of markets.

    The trouble is that these arguments are easier to refute than the luxury vs. economy argument.  Exactly because the arguments are more precise, there is data that can be used to counter pessimism.

    And yet, with or without data, markets sometimes decide that profits are not reliable indicators of value created or potential for value creation.

  5. The Apple Growth Scorecard

    Research · 127 comments

    Apple's revenue for the first quarter was $24.7 billion, which at 83% was the largest quarterly revenue growth they ever experienced. Operating margin was an all-time high of almost $7.9 billion, representing 31.9% of revenue and yielding 95% EPS growth.

    After earnings were announced the share price reached $350.7. This includes $70 in cash. Trailing twelve months' earnings were $20.97. That makes the Price/Earnings ratio 16.7. Excluding cash, P/E is 13.4. The average growth over the past four quarters was 77%.

    The following chart shows the share price vs. earnings. The green line is price and the blue line is share price. I also added multiples of the earnings to show how the stock traded in certain multiple bands.

    During the period of 2006 to 2008 the company shares traded roughly in a range of 35 to 45 P/E. Since late 2008 the company shares have traded in a range of 15 to 25 P/E.

    Share prices normally reflect potential earnings growth and past growth is often a good indicator of near term continuing growth. This is why the P/E is usually a proxy for growth. The faster the growth, the higher the P/E. Or so one would think.

    If we look at the P/E vs. earnings growth for Apple, the picture is not encouraging.

    P/E and Growth don't seem at all correlated. In fact, if we drop two outliers it almost seems that P/E is insensitive to growth.

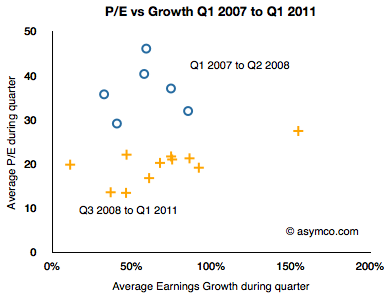
    I took the data a step further and separated it into two clusters: pre-recession and post-recession.

    The blue circles are Q1 '07 to Q2 '08 and the orange plus signs are Q3 '08 to Q1 '11. As the share price chart implies, there is a clustering of averages where during the 2007 and early 2008 period P/Es were in the 35 range while growth was in the 50s and P/Es below 20s with similar or higher growth ranges.

    As the following scorecard shows, the company's growth is exceptional. That does not seem to be something that is being valued by investors.


  6. Is Android responsible for Apple's deep market discount?

    Research · 96 comments

    At last night's closing price Apple was trading at a P/E of 16.3. Excluding cash that ratio was at 13. On a conservative forward basis (my estimates) the stock is priced at less than 10 times next twelve months' earnings.

    These figures show a remarkable pessimism that has persisted around Apple for years. It was slightly, but not much, worse during the great recession. It persisted whether the company was growing at 30% of, as now, 95%.

    There are many hypotheses about why Apple's earnings and growth are considered worthless. They come and go with the whims of the age: recession, elitist, luxury branding, health issues, macro "headwinds", earthquakes, phantom competition.

    Lately it's become fashionable to blame Android. That's a curious thing to me, because Android has been discussed at length here and it has been shown to be, for the time being, benign. Apple has not "lost sales" to Android as it has been selling all it can produce. In some ways it's been a boon as a co-belligerent against non-consumption.

    The argument that the discount is in effect because of the future of Android has one first strike against it: the fact that the market does not often discount the distant future. Capital markets are notoriously incompetent in spotting disruptions and often reward those who are failing right up until the bitter end.

    But let's take the "Android hypothesis" (i.e. that Android is causal to Apple's share price) seriously and analyze it. How could the impact be measured?

    Since Apple is trading at a fraction of (a) historic multiple (b) multiple based on growth (c) comparable companies' multiples then we can assume that a "normal" valuation would be twice the current (i.e. a multiple of about 32). That would still be a discount to growth and history but it would begin to match some of the comparables. A doubling of the P/E would be a good start.

    But a multiple of 32 would imply a doubling of market cap, which means that the Android hypothesis is causing the evaporation of about $300 billion in future profits. So it stands to reason that it's responsible for a $300 billion destruction of Apple shareholder value.

    That's an interesting number since Google itself is only worth about $169 billion.

    The measurement then presents a remedy: If Apple bought Google (it already has a third of its value in cash) and it shut down Android, it could create $300 billion in value. If could even throw away all of Google and still walk out with a profit.

    Seems like a great bargain.

  7. Is Apple a candidate for acquisition?

    Research · 57 comments

    As shown in the Apple growth scorecard, the company's earnings growth is continuing at 75% with the top line increasing at the annual rate of 70%.

    The $59 billion of cash on the balance sheet has reached the equivalent of $64 per share yielding an enterprise value of $263 per share based on closing price of January 21st.

    The stock price has been rising but not outside a narrow P/E band. The following chart shows the stock price and the 15 P/E and 25 P/E bands that have bounded it for nearly three years.

    As previously observed, this overall share appreciation is not accounting for the growth in earnings.

    The trailing twelve months' earnings were $17.91 per share. Therefore the P/E ratio is now 18.2. Excluding cash, the P/E is at 14.7. However, that's based on 2010 levels of earnings. Those earnings are increasing very quickly.

    To account for earnings and their growth, I developed the following chart which shows the P/E and P/E/trailing-Growth for the stock.

    The P/E is fluctuating on either side of 20 but when considering trailing growth, comparable companies, the macroeconomic conditions and guidance the value of the company is reaching new lows.

    P/E/tG nearing recession lows

    Earnings were 75% higher in 2010 than the year before. So based on the growth, the rule-of-thumb ratio P/E/trailing Growth (P/E/tG) is 0.24. This ratio (where 1.0 is seen as "fair value") is the lowest since July 2009, during the first months of recession recovery. The trend for this ratio is down (see the burnt orange line in the chart above). It's not far from hitting the lowest point during the recession at 0.17.

    Now I'd like to reminisce a bit about that point in time. The stock had bottomed at $78/share[1]. It was trading at barely 3x cash and a P/E of 11 but growing 3x that level (32% in the slowest recession quarter but averaging much higher).

    So today we are at a similar point in valuation. The cash is at $64/share, shares are priced 5x that amount and the growth is 4x P/E[2]. Although analyst targets are less comical, there is still the sense of extreme despondency when looking at the valuation ratios.

    Guidance, Comparables and Macroeconomics

    Unlike two years ago there aren't the same dark clouds on the macro horizon. The company is also not as cautious on its guidance (guiding 63% EPS growth must be a new record for a post-holiday quarter) and there is talk of bubble in valuation for comparable companies. Netflix, Amazon, and ARM have eye-watering valuations relative to growth.

    A discount to the S&P 500

    And to round out the tragic tale, Apple's P/E is, once again, at a discount to the S&P 500 P/E (14.7 vs. 16.57 respectively).

    Given the new low in valuation contrasted with optimism on behalf of many (including management), on some forums there is discussion about Apple becoming the target for a take-over.

    There is some perverse merit to this logic. With $64 in cash, $25/yr in earnings and 75% growth it's so cheap that if credit were available, it would make a tempting candidate. Private equity could take it private and use the gigantic cash flow to pay off debt (in about four years). In bygone days, this would have been an easy pitch.

    Alas, the capital markets may not have liquidity for the size of the market cap Apple holds and I don't see any competitors able to get the leverage for an acquisition either. Or can they?

    ---

    Notes:

    1. In early summer 2009 some analysts put 12 month targets for the stock at $70, so their predictions were within $6/share to today's book value.
    2. A buyer of shares two years ago would only have to wait two years to have 80% of their investment sitting in retained earnings.  An investor who read the data from Apple and knew that the iPhone existed could not fail but be amazed.
  8. Remembering January 14, 2008: The day the market lost faith in Apple

    Research · 106 comments

    In a recent but recurring lament I asked why Apple shareholders are not being rewarded for the company's growth. I pointed out that there is no fundamental reason why the company should receive such a low P/E multiple (about 18 ex-cash trailing and 10x forward while maintaining 70% earnings growth for over a year).

    There were many objections in the comments. Most of them dealt with recent reasons why doubts might have arisen among investors: Android hegemony or some perceived lack of competitiveness leading to margin compression or some macro hangover from the recession.

    In this article I argue that none of these objections hold water. My argument hinges on the fact that there is a precise date when Apple ceased being seen as an exceptionally valuable company and that date precedes any of the causes being suggested.

    The day of disillusionment was almost exactly three years ago: January 14th, 2008.

    How to pin down the date of disillusionment

    Consider the following chart.

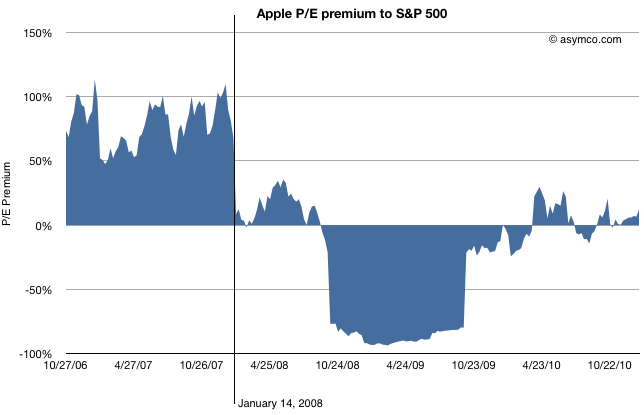
    The blue area represents either a premium (above 0) or a deficit (below 0) of Apple's P/E (ex-cash) relative to the S&P 500 P/E. This is a re-imaging of a chart, first introduced in June 2010 when I first pointed out that Apple was being discounted relative to the S&P 500.

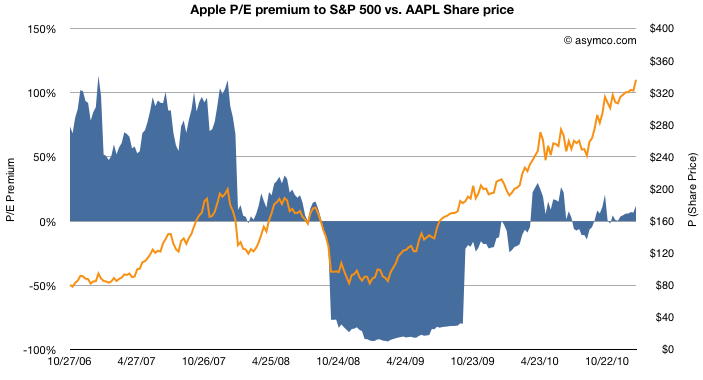
    By measuring P/E I am focusing not on the stock price, which has grown nicely, but the ratio of the price relative to earnings, which hasn't (see the next chart below). P/E is a fundamental measure of potential (its reciprocal is the stock's earnings yield.) It is usually highly correlated to the company's growth. If that P/E is uncorrelated to past growth, there is some significant discounting of future growth. It's the most significant (and simplest) measure of "faith" in a company.

    By measuring the company's P/E relative to an index of other large companies (S&P 500 P/E) we can assess whether the company's potential is being valued as extraordinary or whether it's being valued as ordinary. In other words we are measuring whether a company is "special".

    The chart shows that until January 14th, 2008 the company was valued at a significant earnings premium--a P/E consistently 50% higher than the norm.[1]

    Following the collapse (about 40% drop in share price but 100% drop in P/E premium), there was a small recovery followed by a huge trough in valuation. During the recession quarters Q308 to Q309 S&P earnings fell to zero or below. As a result of S&P earnings collapse the S&P P/E shot up astronomically (as E approaches zero, P/E approaches infinity). Apple's earnings dropped as well but remained positive throughout that period bottoming at 37% growth(!) in Q408. As a consequence Apple's P/E fell as low as 11 while the market's went well above 100 (122.41 peak). The P/E deficit for Apple went 80%: Apple was valued as basically worthless (3x cash).

    After the earnings recession, the S&P P/E recovered close to historic levels but Apple's P/E did not. It's in-line with the S&P but does not obtain the 50% premium preceding the recession.

    So we can establish that the day that Apple's potential was discounted was nearly six months before the onset of recession.

    What other discounting factors can we discard?

    How about earnings growth itself? Did the collapse foretell an earnings collapse?

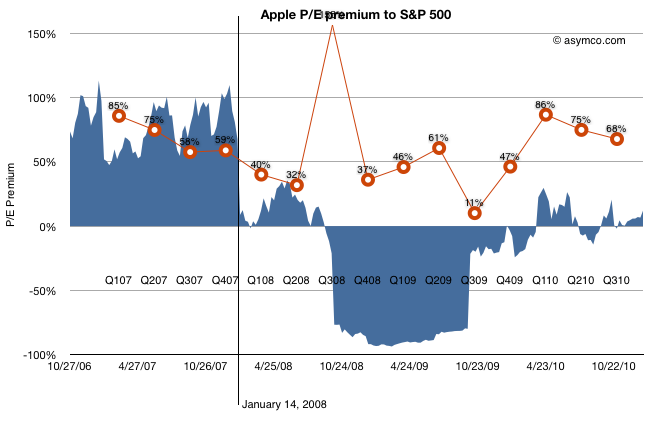
    The chart above shows the P/E premium vs. earnings growth (in red). Although earnings growth began to slow soon after the 14th (earnings for CQ407 were not yet announced at that point), growth recovered six months later after the launch of the iPhone 3G[2]. Growth continued throughout 2009 and 2010 reaching new heights last year of 86%.

    Still, the company received no premium to the S&P 500 P/E. Companies in the index averaged, at best, a quarter of Apple's growth in earnings.

    What about Android? The first Android device did not ship until October 2008 (HTC Dream or T-Mobile G1). There were no appreciable Android volumes until 2009, one year after the drop in relative value and no talk of a threat until 18 months later.

    The last objection to be put aside is that of margin compression.

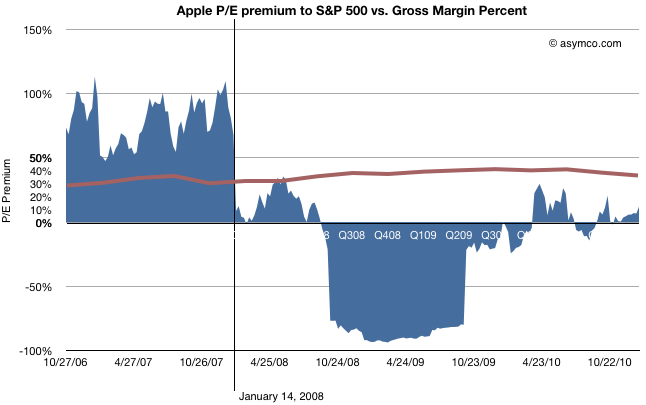
    This last chart shows how margins (in brown) behaved during the same time period. They went up. The only slight decline took place during the last few quarters, after the launch of the iPad, long after the collapse.

    Regardless of the adjustments with product launches, Apple's GM is the envy of the world and is not at all correlated with the loss of faith in the company.

    So What happened on January 14, 2008?

    Having led you this far in the story, I'm afraid I'm going to let you down at the end: The cause for the loss of faith is a mystery to me.

    There is only one noteworthy event that took place on that date: Macworld 2008 (January 14-18). During the keynote, Steve Jobs introduced the Macbook Air (and Time Capsule and Leopard and pre-announced the iPhone SDK which, six months later led to the app supernova). I remember that day and I remember that the stock began selling off exactly at the point when the Air was mentioned. It has never been the same since.

    Obviously, correlation is not causation. The Macbook Air need not be the cause for the loss of faith in Apple as an investment. Or can it? I'm hoping someone can explain this because to me it makes no sense. The product was not a home run but it did not do badly either and its current incarnation seems to be a hit. Whatever sins the original Air may have had have surely been expurgated by now.

    Regardless the cause, the bottom line is that, in the eyes of investors, Apple stopped being "special" that day. Its valuation dropped to in-line the S&P and, given its growth, well below what a large growth company should be worth. The company's shares went into the bargain bin and are still there today.

    ---

    [1] I should point out that the P/E ratio is based on post 2009 re-stated earnings. The restatement changed the P/E as the "E" changed. This was based on the abolition of subscription accounting for the iPhone. Although it may seem unfair to hold the market to this standard, restatement did not actually change cash flows which were transparent and visible to all, even to amateurs such as myself and the other unaffiliated analysts that published throughout this period. Earnings may be an opinion but cash flow is a fact. Valuation on the basis of cash flow should have yielded the same results as shown above.

    [2] That quarter showed a y/y growth of 150% while the stock was in freefall. In fact, it was during that earnings day that Steve Jobs came on the conference call and pointed out the astronomic iPhone cash flow to an audience of analysts more concerned about their own jobs.

  9. Wall Street's Infinite Loop: How AAPL is valued

    Research · 30 comments

    In the previous article discussing the growth scorecard, I left open the question of how Apple's growth is reflected in its share price.

    The approach to answering this question is to show how the share price correlates to that growth. The challenge for analysts has been that the company switched from subscription to current accounting for the iPhone (the largest component in its income statement). As they re-stated income and thus earnings, any historic review of P/E or other multiples of Earnings have to also be re-computed.

    So this is what I've done:

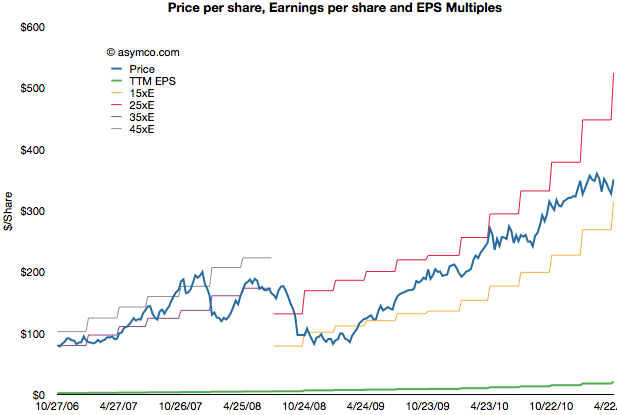
    The first chart shows Apple's price per share (blue) vs. its trailing twelve months earnings (green) and multiples of those earnings (15x and 25x).

    The chart shows how Apple was priced well above 25 P/E before October 2008 and has remained within the 15 to 25 multiple bands since the winter of 2008/2009. This seems fairly reasonable and the stock's rise is a cause of celebration for many, but a cause for concern for some. Is this rise in price matching a rise in value?

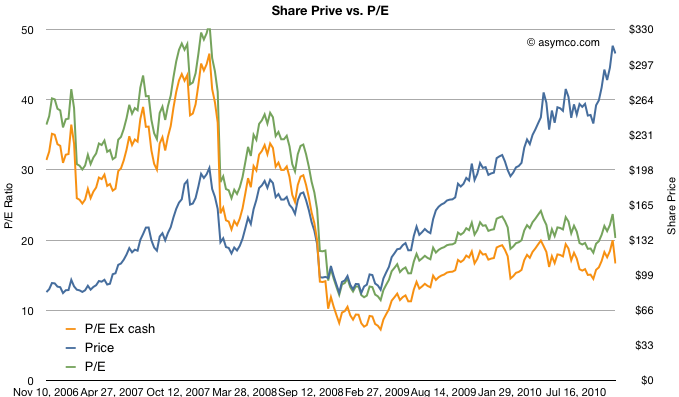
    To answer, we need a way to look at the valuation of Apple. One way is to plot the P/E ratio over time. That would show how the market perceives the value of the company (i.e. how many years' worth of earnings is built into the price) The chart below does that.

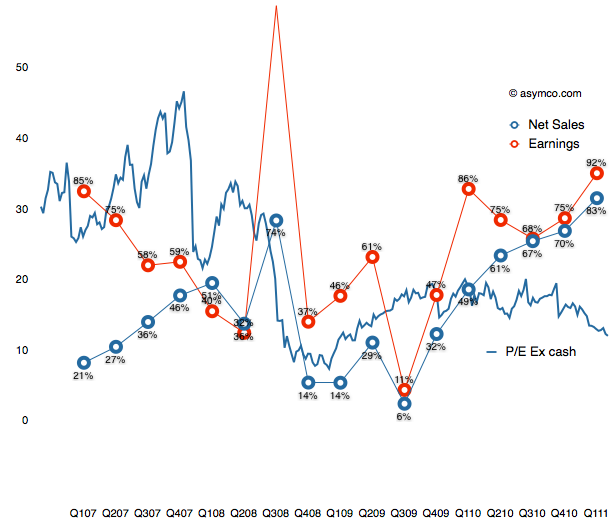
    I took the additional steps of plotting the P/E excluding cash from the price to show "P/E Ex cash" in the orange colored line and I also copied the Share price line from the first chart on this one for contrast.

    What the P/E analysis shows is that as the stock rose, it's P/E ratio fell. This means that the "valuation" of the company is quite a bit lower now than it was in 2006 and 2007. In fact, as a multiple of profitability, Apple's stock is nearly half as valuable now as before the recession.

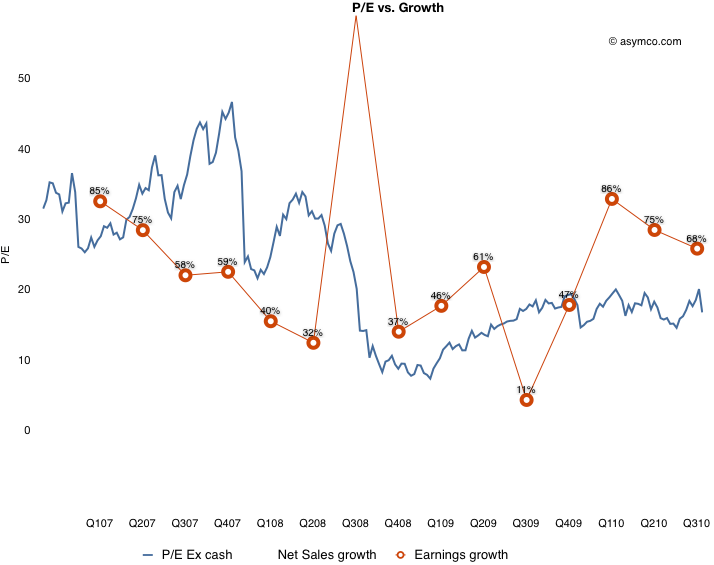
    Since valuation is usually correlated with growth, (P/E is often compared in a ratio with Growth) we need to see whether the P/E in the chart above matches the actual growth of earnings. Fortunately we have just measured growth with the scorecard.  Here are the two charts together:

    What this shows is that while earnings growth did slow down in the lead-up to recession (with the hugely anomalous 3G launch spiking growth to 155% in Q308 causing the year-later plunge to 11%), growth picked up again in the depths of recession and has moved back to pre-recession levels. The only difference is that the multiple assigned to the stock has remained near recession lows. This is visualized by the blue line being mostly above the red line pre-crash and usually under it post-crash.

    To put a finer point on this, I plot the ratio of P/E and trailing growth (P/E/tG) in the brown line below:

    It shows that as a measure of valuation with respect to growth, Apple is trending down. A P/E/tG ratio of 0.4 and closer to 0.2 if we exclude cash shows very weak confidence.

    The only conclusion I can draw is that the market does not believe that Apple has significant growth opportunities. A P/E of 20 with consistent 70% growth is, to be blunt, damnation. For comparison, Amazon just reported 16% growth in earnings and was rewarded with a P/E of 68.

    Amazon notwithstanding, is Apple an anomaly? Is the disconnect between earnings growth and the stock price unique to Apple or does it apply to most other equities? Is pessimism about Apple a symptom of pessimism in general? I will suggest a way to answer this in a future article.

  10. Apple's Growth Scorecard

    Research · 14 comments

    Every quarter I try to score growth by top, bottom and product lines. As unforeseen growth is the only driver creating shareholder value, it's of paramount importance to measuring a company's performance.

    For Apple, the analysis is fairly straight-forward. There are relatively few product lines (seven including the iPad). I measure y/y sales growth and try to form a picture that is easy on the eyes and mind.

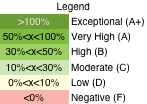
    The method I'm using now is color coding growth for each line according to the legend to the left.

    The table that follows shows each product plus the Net Sales and Earnings lines according to this color coding. I also added an average column for reference.

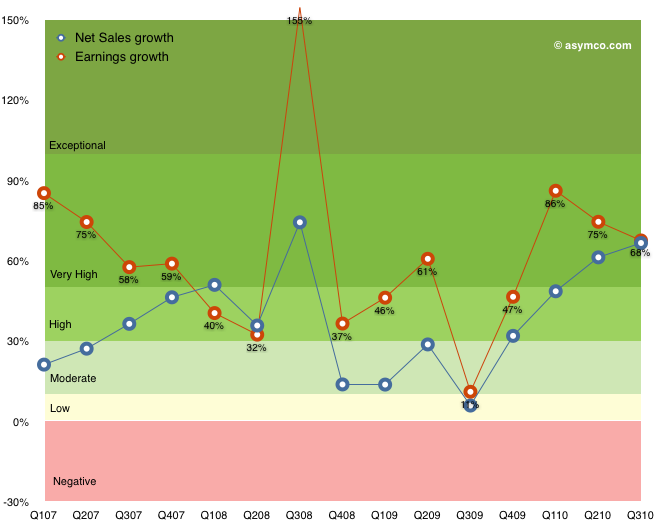
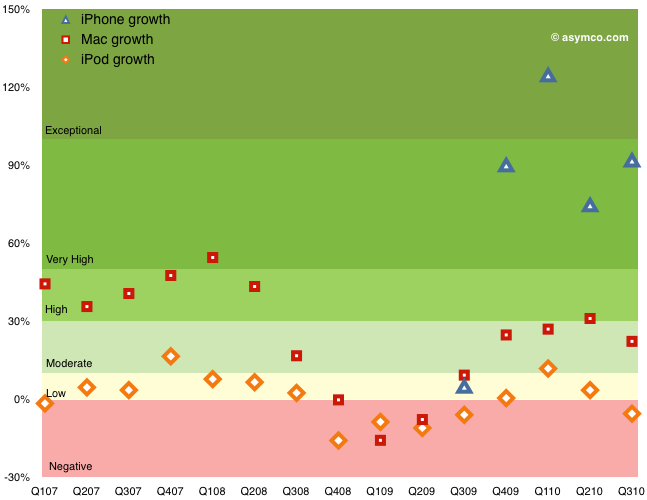
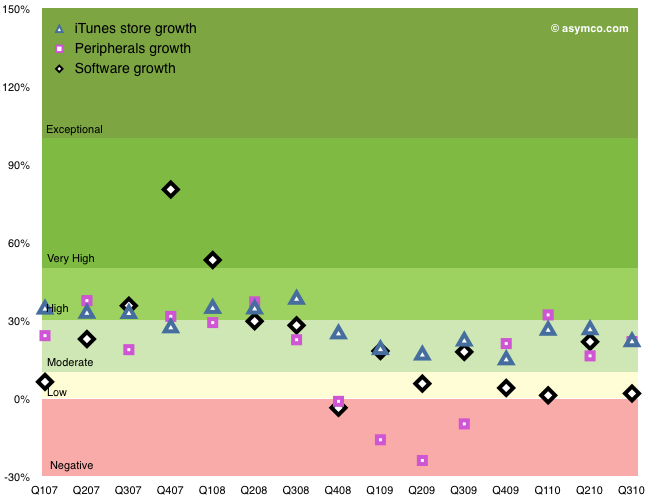
    The following graphs show the same data with color coding for the rates as they change over time. I broke the data into three charts: Top/Bottom lines, Hardware Products, Other Products.

    Discussion

    Hopefully this representation describes the company's growth without requiring too much explanation. Earnings growth, which determines ultimate value created is near all-time highs, well into the "Very High" (A) growth band. Apple have recovered from the Moderate-to-High (B/C) bands during the recession and are near the levels of 2007 when the company was trading at a P/E of 50 (today's P/E for Apple is 20). Sales growth broadly followed earnings growth.

    Within the products, the iPhone again shows exceptional performance. The growth during the first five quarters was (literally) off the scale (above 150%--see table for actuals). The average quarterly y/y growth has been 234%! Last quarter's 92% growth is very near the 100% threshold for exponential growth. This after three years in the market.

    The Mac growth is Moderate (B) and that may be because it was not a launch quarter for portables. The Mac underwent Very High (grade of A) growth for a period of 2008. The iPod shows weakness. The product has been in a Low-to-Negative  (D to F) band of growth since the iPhone launched. Clearly a mature product line but one which has been largely subsumed into the iPhone and iPad. The iPod touch is increasingly a large proportion of the iPod line.

    The non-hardware product lines are Low-to-Moderate growth products. The Peripherals business tracks very closely to the Mac business and dipped negative during the recession.

    Overall, the growth scorecard is in the "Very High" category, or a grade of "A", mostly driven by the iPhone and iPad. Whether this growth will be reflected in the share price is a question reserved for a future discussion.

  11. Android's Pursuit of the Biggest Losers

    Research · 170 comments

    The mobile phone market is intertwined with the telecommunications industry which is vast and there are numerous competitors which are much more dynamic and better capitalized than the moribund PC or music player vendors. It’s also a regulated and fragmented global market with 1.2 billion units and 5 billion consumers—far greater than any of the markets Apple played in for its first 30 years.

    Nevertheless, the iPhone has had a huge impact on the industry. To show just how much of an impact, I dove in and pulled over 500 data points on three years’ financial performance of seven competitors responsible for 80 percent of units being shipped today. The time frame covers the iPhone’s participation in the market so it allows for “before-and-after” comparisons.

    I divided the findings into five articles:

    1. Unit Volumes. The evolution of market share.
    2. Revenues. The shift in where dollars are spent.
    3. Selling prices. The tale of ASP erosion.
    4. Operating margin. Profitability ratios over time.

    Now I turn my attention to draw a bottom line from all the data above, namely the operating earnings (EBIT or Earnings before Interest and Taxation).

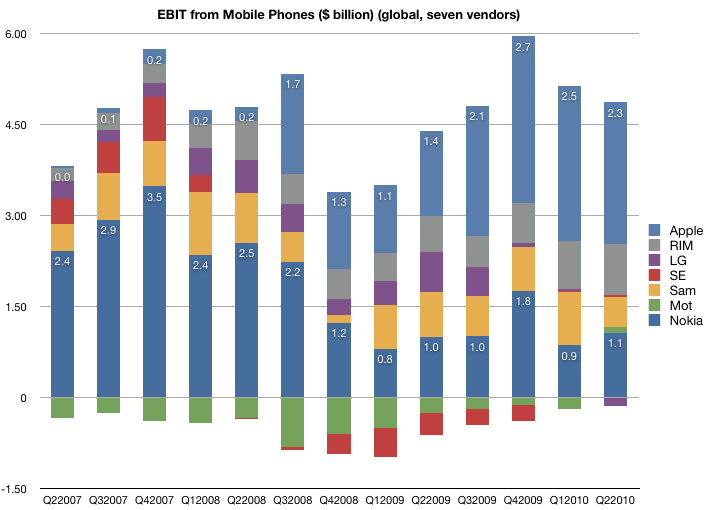
    The first chart shows the EBIT from the top seven vendors of mobile phones since the quarter when the iPhone launched. I annotated Nokia and Apple's bars to give perspective.

    The total available profits in the industry dipped to a bit under $4 billion at the trough of the recession, and have recovered to nearly $6 billion in the holiday quarter last year. However, not all vendors are profitable. As you might expect from looking at the operating margins, Motorola and Sony Ericsson have been generating losses for most of this time period. They have both reached profitability in the last quarter, though at very low levels and after having lost a large part of their sales. LG has turned negative this past quarter after being a modest earner for some time. Samsung has maintained a fairly even consistency in its profit capture, though with its expanding market share, it seems to have come at the cost of pricing.

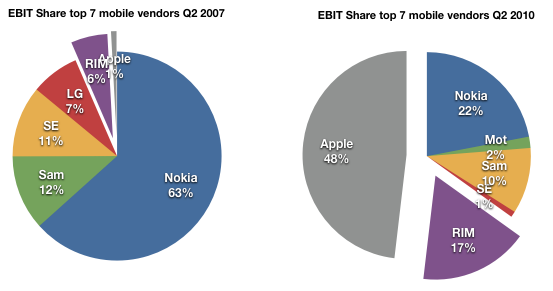
    Finally, looking at the pure smartphone vendors RIM and Apple, the picture is nothing short of astonishing. This before-and-after share-of-available-profit chart shows that the two entrants went from about 7% profit share to 65% in three years.

    Apple in particular is capturing about half of the available profits with three percent of the units. It dwarfs all the other vendors, more than double the nearest (Nokia). All that in three years and with the added burdens of only three models, a recession and limited distribution.

    What does it all mean?

    Here are my conclusions, enumerated:

    1. The lack of a real response. The recurring theme in this series of articles has been that giant multinational incumbents in a vast and rapidly growing industry, enjoying all the advantages that size and incumbency, have had their profits taken from them. And they don't seem to have put up much of a fight.
    2. It's all wealth transfer. Note the total amount of profit available has not increased markedly; this is not about incumbents growing the pie. Two thirds of what should have rightly been theirs moved from the incumbent shareholders to the entrant shareholders.
    3. Speed. This shift of profit occurred over an unprecedentedly short period of time.  Three years is no more than two product cycles in the industry and it's an order of magnitude faster than what happened historically to other industries.
    4. Disruption is the diagnosis here. The incumbents were caught in the headlights. Disruptive innovation leads to asymmetric competition and this is what we just witnessed. History has shown that the shift of profits is usually the last stage of disruption and is usually irreversible because the change in business models cannot happen at the rate of change of profit transfer.

    Which leads me to one final point.

    When analyzing the potential for challengers to the new winners, the most cited is Android. Can Android affect this redistribution of profit once again? And to whom?

    If Android is to become the dominant platform, does it depend on the success of its licensees? Who are these licensees and what are the chances that they will be able to align their businesses to what Android offers (a new revenue model based on services and advertising).

    One problem I see is that Google is making a bet on those same vendors who are now squeezed in the middle of that last pie chart: Samsung, LG, Motorola and Sony Ericsson. Nokia, Apple and RIM will certainly not take the OS over what they already have as it dilutes their differentiation and margins. That means Android is aligned with the biggest losers in the industry.

    So how likely are these disrupted ex-giants to recover and take Android forward? My bet: slim to none. Android does not offer more than a lifeline. It is not a foundation for long-term profitability as it presumes the profits accrue to the network and possibly to Google. Profit evaporation out of devices to Google may be a possibility at some time in the future, but only if the devices don't need too much attention to remain competitive. But because they're still not good enough (and they won't be for years to come), it's certain that attention to detail is what will be most important to stay abreast of Apple.[1]

    So here we have the real challenge to Android:  partnership with defeated incumbents whose ability to build profitable and differentiated products is hamstrung by the licensing model and whose incentives to move up the steep trajectory of necessary improvements are limited.

    In other words, Android's licensees won't have the profits or the motivation to spend on R&D so as to make exceptionally competitive products at a time when being competitive is what matters most.

    [1]: I would argue the same lack of symmetry with licensed software vendor Microsoft is what led the the failure of the same incumbents to make a dent in the industry with Windows Mobile [2003 to 2010].