Asymco

Asymmetric Intelligence

revenue

  1. How will we measure Apple's Watch success?

    Research · 55 comments

    It won't be easy. The company will not be reporting the Watch segment revenues or (presumably) unit sales and therefore we won't have an accurate unadulterated view of the business. In addition, the large number of products in the mix and wide price variance means that it will be difficult for analysts to determine demand and price.

    There is a hidden benefit to not having this data. All data is a creation and it tends to lead thinking in directions led by whatever is being measured (and whoever chose those measures and their motives). And yet without data there is no evidence and no credibility. In other words: You can't manage without measurement but you can't be sure what to measure.

    The analyst is then faced with a requirement to have good taste or at least judgement about what to measure. This judgement is based on experience and good theory. Given that, what could we measure to determine whether the Apple Watch will be a success?

    Here are some suggestions:

    1. Language. Measure whether "Watch" will come to mean "Apple Watch". "Phone" has come to mean not only "smartphone" but also all mobile/cellular phones and not just things used for calling but things used for all manner of information. This is a great test because the theft of semantics can only be accomplished through a degree of ubiquity of influential mindshare. Incidentally, the brand may well have been designed to do just that. ((It leaves open the question as to what watches as currently defined will come to be known as.))
    2. A measurable and significant reduction in the use of the iPhone. The Watch peels off uses from the iPhone and therefore the more it peels off, the less remains. However, that which remains will be more uniquely valuable to the incumbent. This is the process of carving and erosion that the PC experienced vs. mobile devices in general.
    3. An increase in the mix of large-screen iPhones. As iPhones are removed from pockets more rarely, the larger version might be more comfortable to carry and more useful to use for the immersive tasks that are outside the scope of Watch.
    4. An overall increase in iPhone sales beyond the foreseeable trajectory. This would suggest switchers from Android would be drawn to the platform purely for the value of the "accessory". Note that this is not inconsistent with the lower usage and higher spec mix measurements.
    5. Apps uniquely targeting the Watch. It's hard to imagine how this will develop as it involves millions of creative minds, but as smartphones created new economic value through the solving of new jobs to be done, the Watch should do the same. As a side-effect it should lead to new empires (or at least Unicorns) being formed around Watch use.
    6. Iteration. How quickly and deeply will the product be improved? Basic accessories like headphones and Apple TV have a leisurely update cycle. Smarter devices are faster. The cycle time of iteration should indicate how seriously Apple takes the platform and that itself should be fueled by positive consumer sentiment for the product.

    These indicators are vague and the data will be weakly signaled but in many ways it will be more meaningful than any financial performance figures.

  2. Peak Cable

    Research · 172 comments

    Paying for TV has been a curious consumer phenomenon. There was a time when TV was free to consumers. It was delivered as a broadcast over-the-air and paid for either by commercials (US mostly) or by taxes on viewers (Europe mostly). The consumers were delighted with the idea as it was far better than radio and radio was delightful because it was far better than no radio.

    The process of convincing consumers to pay for something that used to be free was quite interesting. The first benefit to be articulated was that the quality of the picture would be much better. It would, in essence, be noise-free. ((This was in fact the birth of cable TV: a shared antenna for a community in an  electromagnetic shadow))

    The second benefit was an increase in the number of channels. VHF and UHF television would cover about three and 5 channels respectively while cable could offer dozens, many specializing on specific types of content like the Home Box Office (HBO) offering movies and ESPN offering sports only and MTV music videos and CNN news only.

    The third benefit was fewer (or no) commercials for some of the channels. This was especially valued by fans of movies whose interruption by commercials was often detracting from the immersive value and continuity of the cinematic experience.

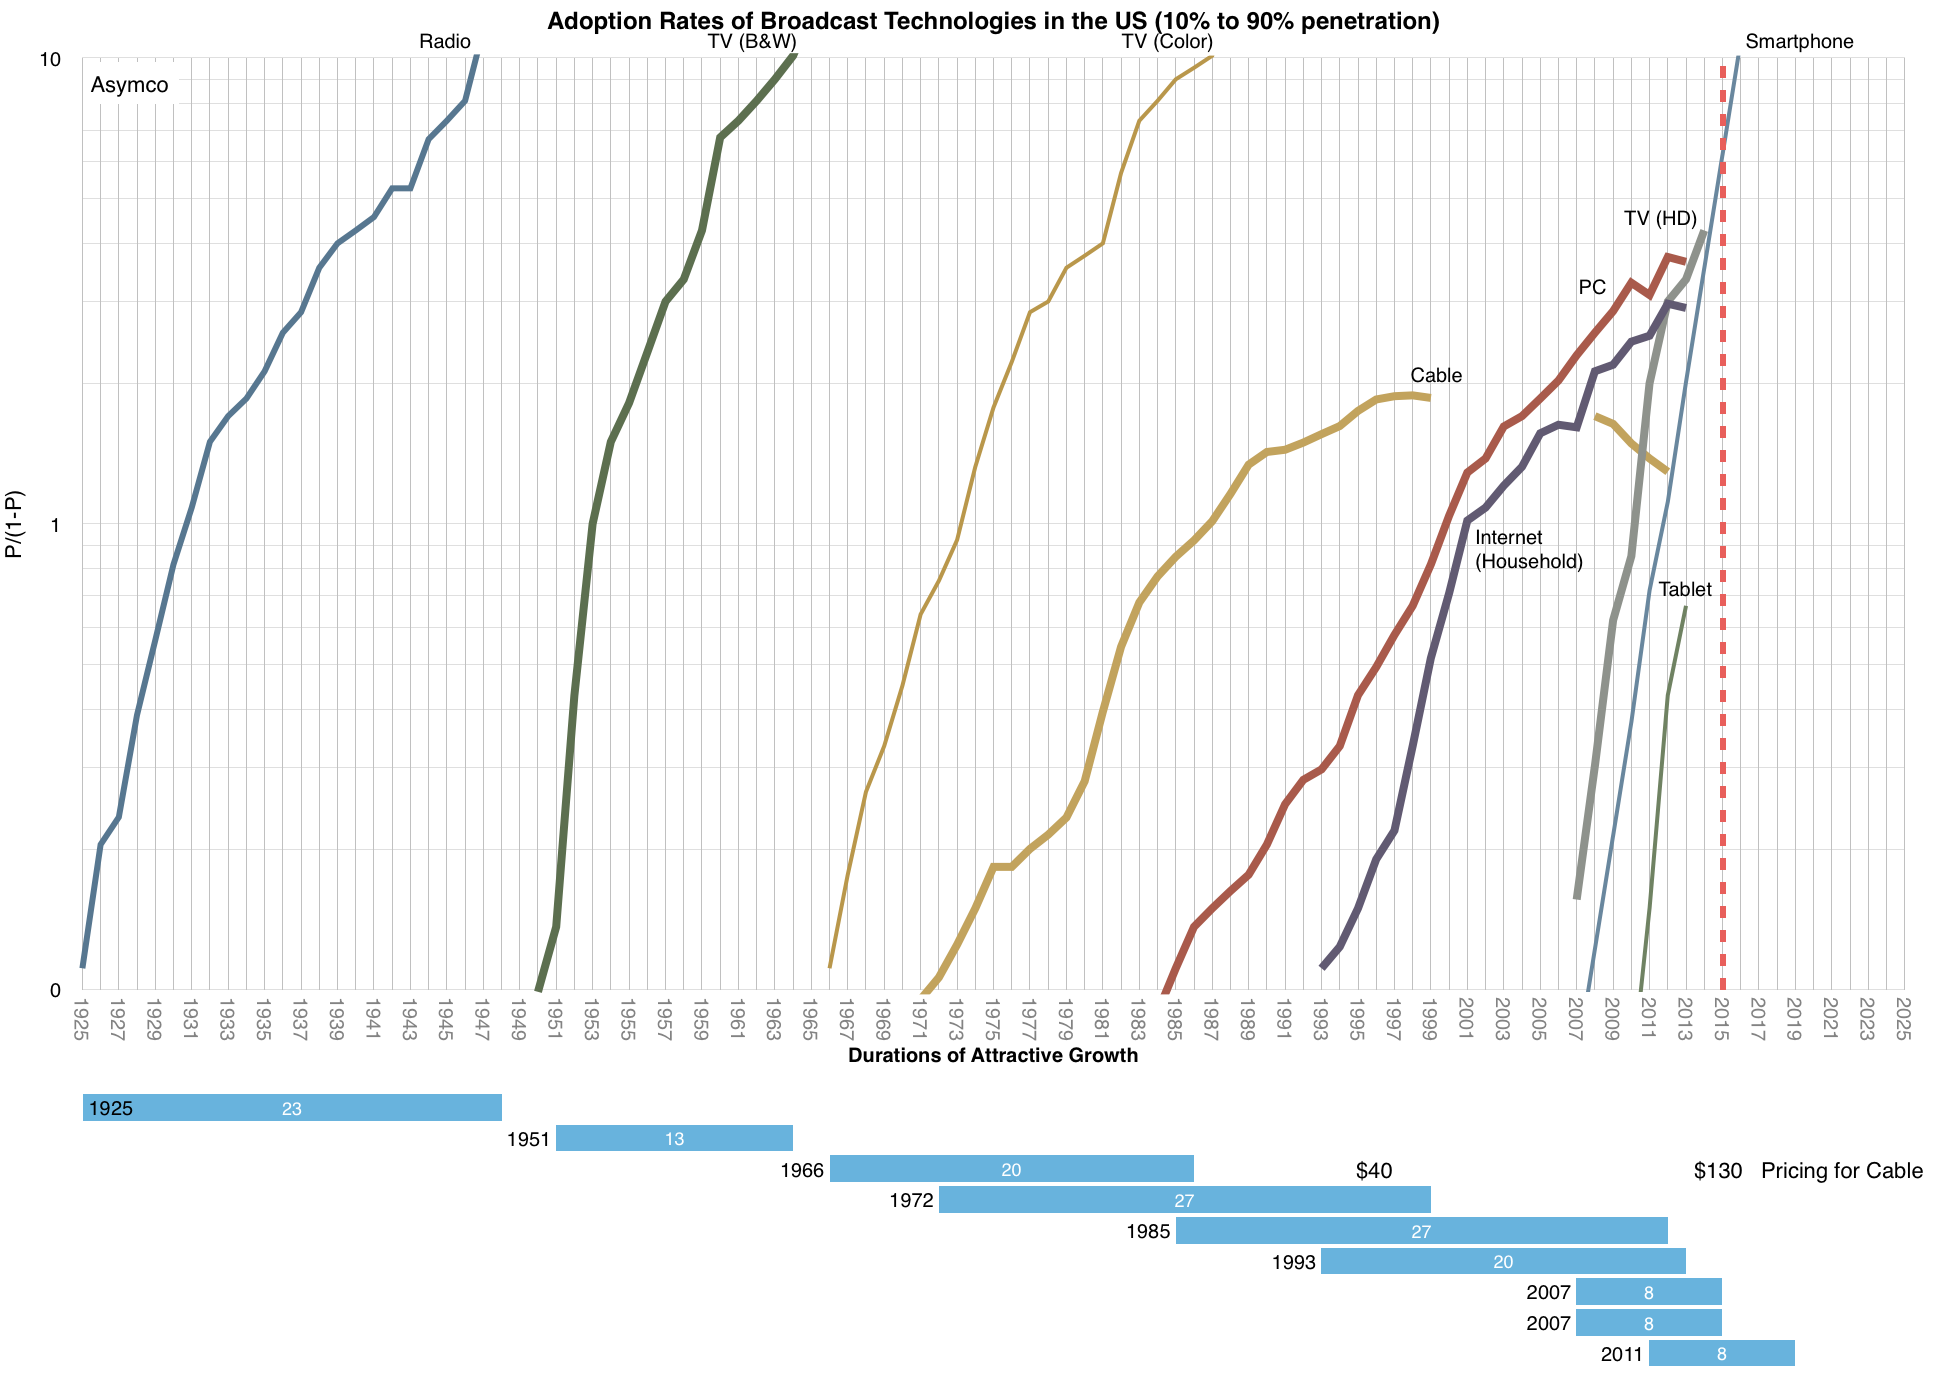
    These benefits were very attractive during the 1980s, to the extent that about 60% of US households adopted cable. An additional group later adopted satellite-based pay-TV as the technology became reasonably cheap.

    Screen Shot 2015-03-19 at 2.29.06 PM

    These benefits were priced modestly but as the quality and breadth of programming increased, prices rose. An average cable bill of $40/month in 1995 is $130 today ((a 6.1% compounded rate of price growth vs. a 2.4% rate of inflation)). Some of that revenue went into upgrading the capital equipment in use (the plant) and some into paying for the higher production values. Yet more went to the sports leagues and their players whose business models increasingly depended on broadcast rights.

    And so over a period of about 40 years, watching TV went from free to quite expensive. More expensive even than a family's communications costs (i.e. telephone service.) That's quite an achievement at a time when technology diffusions caused huge price reductions in other goods and services. Consider that the TV set used to watch the programming improved dramatically while decreasing in price over the same period.

    Meanwhile, some of the benefits began to be less relevant. Commercials are more abundant than ever. Ad buyers spend about $60/month per household to deliver ads ((Implying that the TV "business" has a $200/household/month revenue model)) The quality of the TV picture is actually worse due to compression than one might get with over-the-air digital broadcast. Finally, the abundance of channels is beyond anyone's absorption rate. Those channels which used to be "pure" became polluted and undifferentiated as each tried to be the other. ((A pursuit no doubt driven by seductive but toxic market research))

    On top of these paradoxes is the fact that actual penetration of the service has been declining. As the graph above shows, Cable TV has declined (though Pay TV much less so). The industry has reached saturation decades ago and has not offered anything meaningful in terms of innovation.

    Disruption theory suggests that once a product over-serves on meaningful bases of value creation (and underserves on value) it opens the door to disruption. Which leads me to ask not whether cable is past its prime but rather why it's still around?

    The answers are usually immediate and plentiful: conspiracies of monopolists, lobbying, back-room deals, lock-in of content and all kinds of other misdemeanors. To which I would say: You can fool some of the people all of the time and all of the people some of the time but you can't fool all of the people all of the time.

    So again, why have all the people been fooled all this time? Twenty years have passed since the industry reached saturation and prices keep rising. Today the average cable bill is projected to rise to $200/month by 2020.

    My answer is that disruption is predictable. Users are cutting cords, the "uncabled" or "never-cabled" are a significant portion of the population. 13.5% of broadband households with an adult under 35 have no pay-TV subscriptions. 8.6 million US households have broadband Internet but no pay-TV subscription. That's 7.3% of households, up from 4.2% in 2010.  Another 5.6 million households "are prime to be among the next wave of cord-cutters," according to Experian.

    The same phenomenon occurred with mobile vs. fixed telephony. For several years it seemed that mobile was sustaining to fixed or that fixed was immune due to lock-ins. The fixed telephone incumbents insisted that the data was inconclusive. Then the trickle of abandonment turned into a deluge. The quality of service for mobile kept increasing and, with data, it became clear that the mobile devices could unleash unfathomable functionality and value.

    And so it goes. A business dies first slowly then quickly. (('How did you go bankrupt?' Bill asked.
    'Two ways,' Mike said. 'Gradually and then suddenly.' -The Sun Also Rises (1926) Ernest Hemingway)) The exact timing is tricky because of the non-linearity of the phenomenon. It's also hard to declare end-of-life since business zombies are very common. What is clear however is that the economics will change dramatically and the alliances between talent and distribution will shift to entrants and away from incumbents. The point when we will look back and say that cable was finished will probably come by the end of this decade.

  3. The Analyst's Guide to Apple Category Entry

    Research · 46 comments

    Understanding Apple’s intentions seems to be a popular parlor game and there are many attempts at divining intention from data and market study. These attempts at market research for answers are futile because Apple does not compete in existing markets but rather it creates new markets. For instance, the market for the Apple II could not have been assessed from research into the computing market of 1974. The intention for Apple to enter into music devices and services could not have been predicted through an analysis of MP3 player market in 2000. The iPhone was also not predicated on the market for “Internet Communicators” in 2006 or 2002 when the iPad was first contemplated. ((The market for phones was large but the iPhone pricing and features made it incompatible with any reasonable segment of it.))

    Instead of measuring the size of pre-existing markets, surveying the functionality of existing products, or weighing toxically financialized ratios like margins and market shares, I recall this ad (Our Signature, first seen at 2013 WWDC):

    This is it
    This is what matters

    The experience of a product
    How it will make someone feel
    Will it make life better?
    Does it deserve to exist?

    We spend a lot of time on a few great things
    Until every idea we touch
    Enhances each life it touches

    You may rarely look at it
    But you will always feel it
    This is our signature
    And it means everything

    My interpretation of these lines, coupled with additional public statements can be used to create a “litmus test” for new product categories:

    1. The experience of a product. Read: They will work on things to which they can make a meaningful contribution. To me this means that they will build things which require an integrated approach. As Apple is "the last integrated company standing” it means they will work on problems where the system is not good enough. This means that they will not work on problems where an individual modular component is not good enough. By system I mean, in the largest sense: production, design, distribution, sales, support and services must work in a seamless way. Systems analysis implies a broad understanding of the causes of insufficient performance along the dimensions of “experience”. The experiences are what differentiate the products (and lead to high margins) and these experiences are possible only through the control of interdependent modules.

    2. Does it deserve to exist? Read: They will work on very few things. They will say no to many things. It’s still true that all of Apple’s products can fit on one table. That may not be true forever, but their product space will not grow as quickly as sales grow. This means that there is no notion of “marginal value” or portfolio theory where products are added because they can be justified as “moving the needle” or balancing demand. Rather, the few things which will be worked on will address non-consumption. Non-consumption of experiences.

    3. Enhance life. Read: The things they release are inevitable even though nobody asked for them. The reason this is possible is that there are unmet and unidentified “jobs to be done” which are powerful sources of demand and whose satisfaction leads to unforeseen rewards. The problems that can be addressed are uncovered through a process of conversation with a few people. They are not uncovered through surveys or large n statistical studies. Without the ability to ask the right questions, big data only leads to big misdirection. In contrast, good taste in questions allows small n to lead to big insight. Apple’s ability for finding the right problem to solve comes from this greatness of taste in questions.

    So given this litmus test, will Apple build a Car?

    I believe the problem of transportation and its proxy, the automobile, provide all the requisite demand for Apple's attention. Technical questions abound and they may still prove unsurmountable before a launch happens, but there are no doubts in my mind that this is a problem Apple would see fit to address.

    Non-consumption of unmet and unarticulated jobs to be done can and should be addressed with systems solutions and new experiences.

    The poetry is pretty clear on the matter.


  4. Apple's Growth Scorecard

    Research · 26 comments

    Apple's Net Sales grew at the rate of 30% in the last quarter. Earnings per share grew at 47%. Both of these figures are the highest since 2012.

    Screen Shot 2015-02-08 at 5.27.47 PM

    It should be noted that although the rate of growth is extraordinarily high, the company never actually stopped growing in the past three years. As the table above shows, net sales has always had positive growth.

    Compared with the fourth calendar quarter of 2011, Apple's sales are 61% higher and earnings per share are 54% share. ((Some of the expansion in earnings per share is due to the willingness of shareholders to sell their shares to Apple. 10% of the shares around in 2011 have thus disappeared.))

    This degree of growth at this stage in the history of the markets it participates in is a revelation.

    Consider:

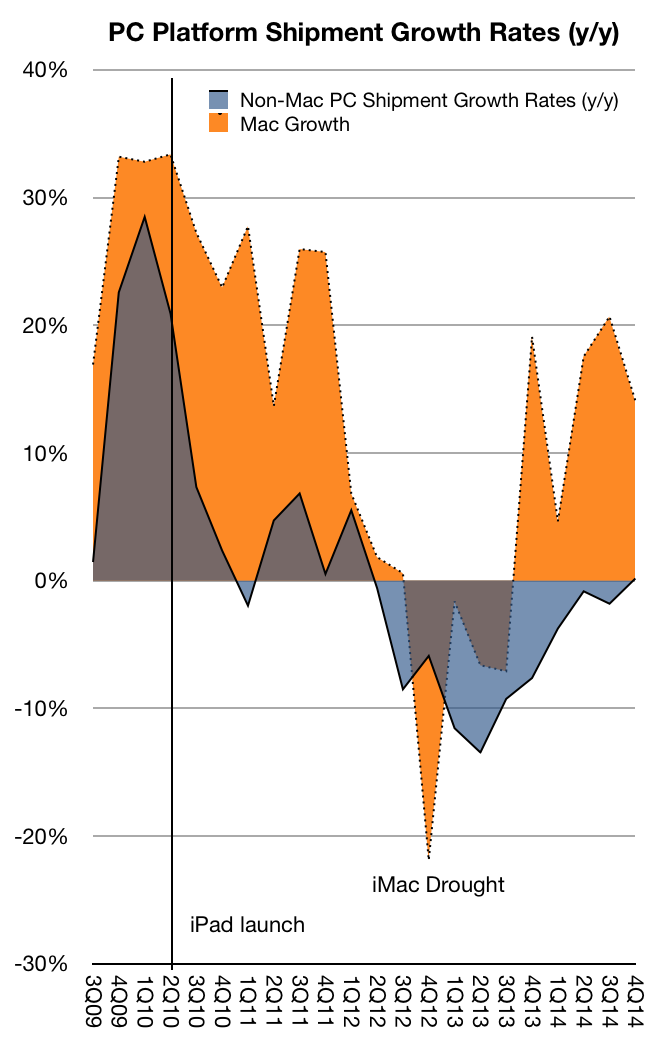
    • The PC market is more than 30 years old. In this mature market the Mac has been outgrowing the Windows platform for 34 out of the last 35 quarters.
    Screen Shot 2015-02-08 at 5.35.43 PM


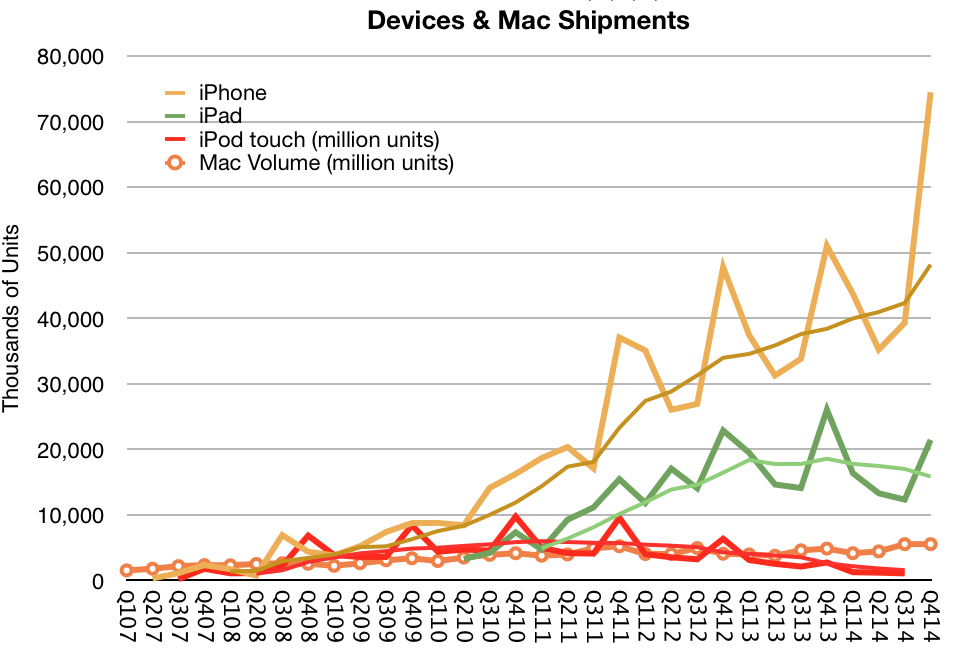
    • The iPhone was announced eight years ago and it still managed to grow at the rate of 57%.
    Screen Shot 2015-02-08 at 5.47.11 PM
    • The market shares of its Mac, iPhone and iPad products are all remarkable only for their paucity.
    • The pricing of all their products is more than double the median for their categories.
    • Regardless of extreme growth, pricing power, headroom and, most importantly, customer loyalty, the company's prospects are seen as dismal in contrast to its underperforming peers. ((As measured by P/E or FCF/EV ratios vs. direct rivals, technology companies or the S&P 500.))
    • Such is the plight of the anomalous.
  5. Bigger than Hollywood

    Research · 72 comments

    Apple paid $10 billion to developers in calendar 2014. Additional statistics for the App store are:

    • $500 million spent on iOS apps in first week of January 2015
    • Billings for apps increased 50% in 2014
    • Cumulative developer revenues were $25 billion (making 2014 revenues 40% of all app sales since store opened in 2008)
    • 627,000 jobs created in the US
    • 1.4 million iOS apps catalog is sold in 155 countries

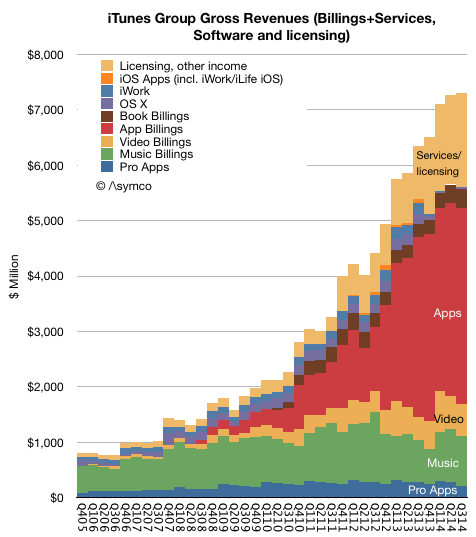
    Putting these data points together with others from previous releases results in a fairly clear picture of the iTunes/Software/Services ((soon to be renamed Services and encompass everything under the heading of iTunes software and services today including content, apps, licensing and other services and beginning Q4 2014 it will also include Apple Pay.))

    Screen Shot 2015-01-22 at 1-22-10.38.39 AM

    The App ecosystem billings (what consumers actually pay) is shown in the red area above. 70% of those payments are transferred directly to developers and Apple reports the 30% remaining as part of its revenues. This view of the iTunes ecosystem shows the impact of Apps relative to the other media types. When we measure the payments to the content owners we can see that Apps also dominate: 

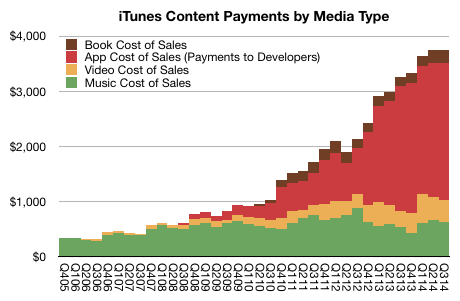
    Screen Shot 2015-01-22 at 1-22-10.44.16 AM

    The red area above adds up to the approximately $25 billion total paid to developers. This view of the payments to ecosystem contributors shows how apps are now a bigger digital content business than music (( Music payments due to iTunes Radio streams are not shown as part of Music cost of sales. Streaming revenues are included in the services/licensing income and payments come out that cost structure.)) and TV programs and Movie rentals and purchases put together.

    This is quite a story.

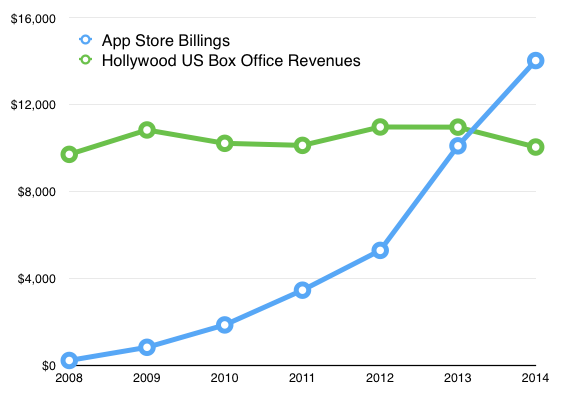
    Put another way, in 2014 iOS app developers earned more than Hollywood did from box office in the US.


    Although the totals for Domestic (US) Box Office are not the complete Hollywood revenues picture, Apple's App Store billings is not the complete App revenue picture either. The Apps economy includes Android and ads and service businesses and custom development.  Including all revenues, apps are still likely to be bigger than Hollywood.

    But there's more to the story. It's also likely that the App industry is healthier. On an individual level, some App developers earn more than Hollywood stars ((so do YouTube stars, but that's another story.)) and I would guess that the median income of app developers is higher than the median income of actors. ((A large majority of actors earn less than $1,000 a year from acting jobs)) The app economy sustains more jobs (627,000 iOS jobs in the US vs. 374,000 in Hollywood) and is easier to enter and has wider reach. As the graph below shows It's also growing far more rapidly.

    Screen Shot 2015-01-22 at 1-22-11.30.06 AM

    The curious thing is that even though the medium of apps is swamping other forms of entertainment in all measurable ways, comprehension of the phenomenon is lagging.

    Information asymmetry is a wonderful thing.

  6. Yet another billion dollar business

    Research · 48 comments

    I tried to assess the opportunity of Apple Pay but found it to be mostly dependent on how quickly card payments will overtake cash. It seems that as payments move to a digital format they will move to a mobile device. The hurdle isn't going from a card to a phone but from cash to card.

    Data published in The Growth and Diffusion of Credit Cards in Society  shows that between 1970 and 2001 households with at least one credit card in the US grew from 17% to 70%. More recent data shows 82% of US consumers have at least one credit card and 77% have a debit card.

    The Total Addressable Market for Apple Pay then is dependent on how quickly this pattern repeats over the markets where iOS devices are in widespread use. Once cards are in use they are used with higher frequency and quickly overtake cash for the user.

    The only assumption that needs to be made is that the device then replaces the plastic card. This seems a safe assumption as the benefits of the device as payment authenticator are high and the costs are negligible given a penetrated market.

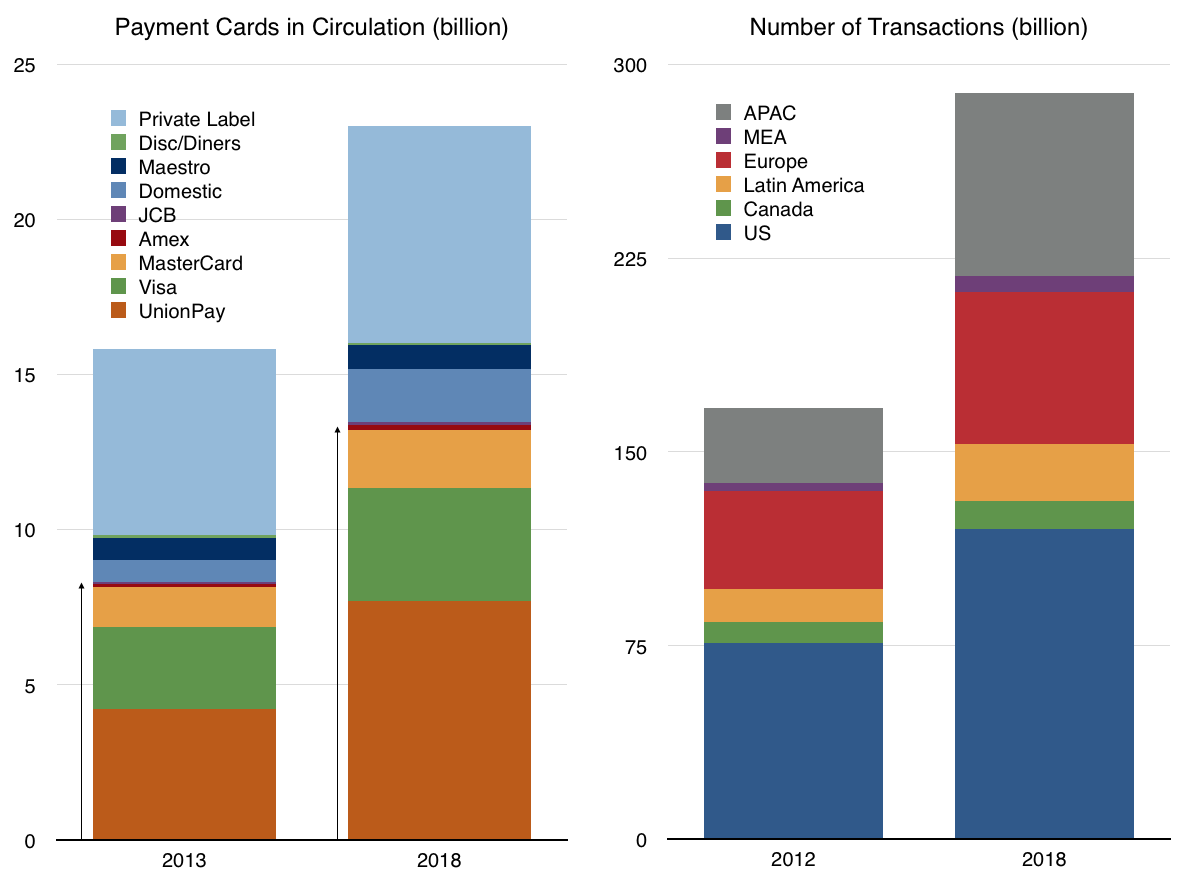
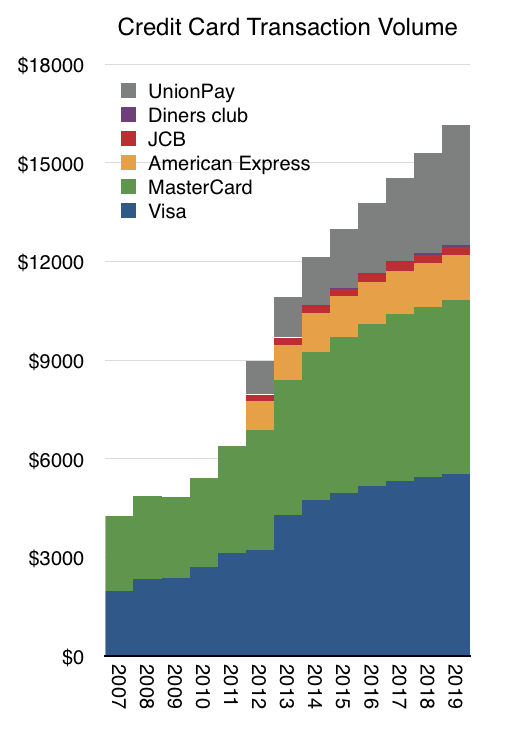
    The following graph shows an extrapolation of transaction volumes where Visa and MasterCard and Amex are showing moderating growth with UnionPay showing 20% constant growth through 2019. ((Supporting these assumptions is a forecast from Nilsen showing total number of cards in circulation by issuer and a forecast of total transactions

    Screen Shot 2014-11-28 at 1.40.01 PM

    ))

    Screen Shot 2014-11-28 at 12.58.21 PM

    Two more assumptions are needed: the share of transaction value captured by Apple Pay and the Apple Pay fee. I used 15 basis points ($15/$10000) as the assumed Apple fee and a share schedule as follows:

    • 2015: 0.5%
    • 2016: 1%
    • 2017: 1.5%
    • 2018: 2%
    • 2019: 3%

    These assumptions result in a cumulative revenue of over $1 billion by 2018 and a yearly run rate of $1 billion in revenue by 2020.

    Although this is not a huge amount relative to Apple's overall revenues ((No more than half of one percent of 2015 revenues)), it's important to note that these revenues are likely to go directly to earnings ((About 2% of 2015 earnings)) as there are negligible costs associated with the transactions that Apple needs to bear.

    These assumptions make the statement that Apple Pay can become "A Billion Dollar Business" plausible by 2020. Perhaps sooner.


  7. How big is iCloud?

    Research · 24 comments

    Apple has declared that what used to be "Other Music Related Products and Services" ((Includes revenue from sales from the iTunes Store, App Store and iBookstore in addition to sales of iPod services and Apple-branded and third-party iPod accessories.)) plus "Software, Service and Other Sales" ((Includes revenue from sales of Apple-branded and third-party Mac software, and services.)) which was formerly known as "iTunes/Software/Services" ((Includes revenue from sales on the iTunes Store, the App Store, the Mac App Store, and the iBooks Store, and revenue from sales of AppleCare, licensing and other services)) is about to become "Services".

    "We'll also have a category that we refer to as services and this will encompass everything we report under the heading of iTunes software and services today including content, apps, licensing and other services and beginning this month it will also include Apple Pay."

    "Services" will therefore encompass a massive amount of revenue. The reported revenues for the fiscal 2014 were $18 billion. Including all billings, the turnover in sales is over $28 billion. For next year, assuming that Apple Pay, which is just getting started, is unlikely to contribute greatly to revenues, Services turnover will top over $35 billion. That figure would make Apple Services alone one of the top 90 companies in the Fortune 500.

    Screen Shot 2014-11-14 at 5.11.47 PM

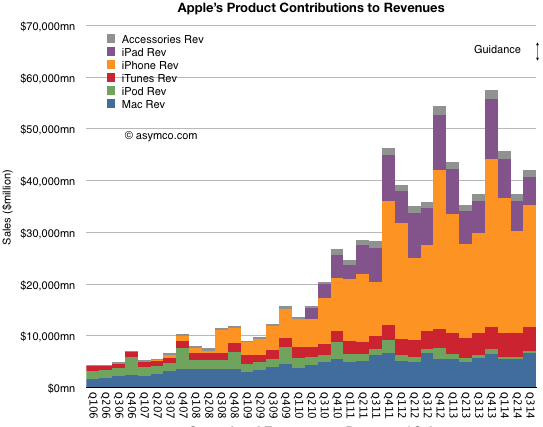
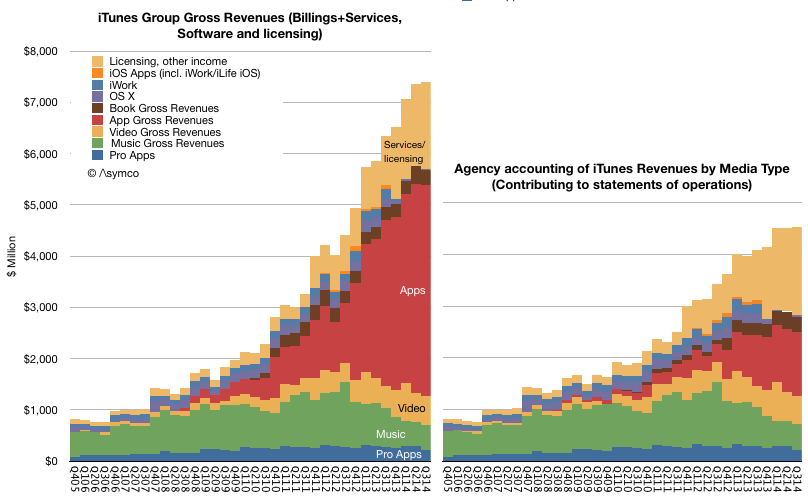
    Regardless, as a component of overall sales, the group formerly known as iTunes/Software/Services (shown in red above) was a modest 7% of total sales in the last quarter. Using all available information regarding downloads, payouts and reported financials, an estimate can be obtained on how this 7% is itself divisible into nine sub-segments:

    Screen Shot 2014-11-14 at 5.15.08 PM
    • Pro Apps
    • Music
    • Video
    • Apps
    • Books
    • OS X
    • iWork
    • iOS Apps
    • Licensing and other income

    These are shown above as either contributing to statement of operations (i.e. as reported, on right) or using billings (or the actual "cash register takings", on left). ((The primary distinction is in Apps billings where the 70% paid to developers is not shown as revenue.))

    What would be ideal in understanding this Services segment would be to break the "Licensing and other income" into its component parts. Namely:

    • Licensing revenues including Google's payments for traffic acquisition (TAC)
    • AppleCare
    • iTunes Match
    • iTunes Radio
    • iAd
    • iCloud
    • (and soon, Apple Pay)

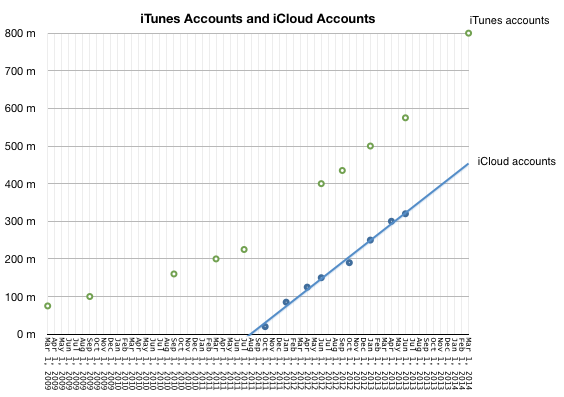
    In particular, it would be very interesting to know exactly how much revenue could be coming from iCloud. We have not heard from Apple on iCloud user numbers since mid-2013 and this was the data at the time:

    Screen Shot 2014-11-14 at 5.30.27 PM

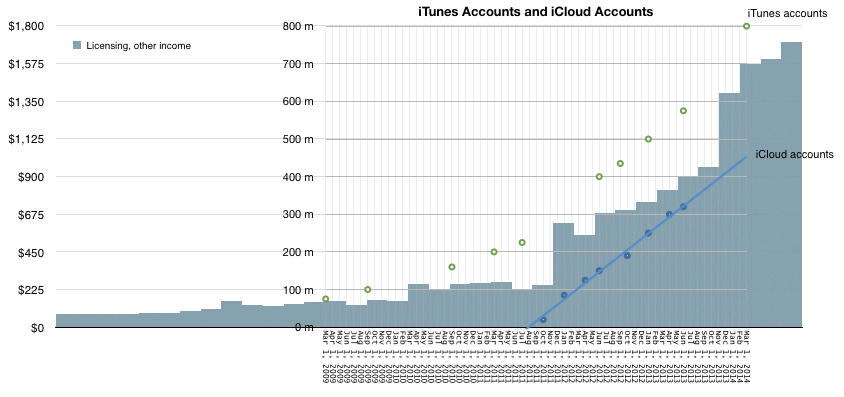
    Couple that to "Licensing and Other Income" as deduced from Services accounting yields the following picture:

    Screen Shot 2014-11-14 at 5.38.30 PM

    It would appear that iCloud accounts are growing in proportion to "Licensing and Other Income". Note that at the point that iCloud accounts were zero, revenues from Licensing were about $225 million/quarter and growing slowly. The real growth kicked in when iCloud accounts started ramping up. Since revenues from iCloud has to be in the "other income" and since no then it is, I believe, reasonable to assume that the iCloud user base growth is a principal driver of growth ((Of course, AppleCare could also be a driver but AppleCare should follow overall device sales patterns and this is not clearly evident in the Licensing/Other curve))

    Also, bursts in the Licensing and other income line occurred after several iCloud-specific marketing events:

    Mobile Me migration started in October 2011 and on September 30, 2013 the complimentary iCloud storage plans expired and were automatically adjusted to the free 5 GB plan (with an offer to upgrade to a paid plan). Correspondingly, Q1 2012 and Q1 2014 showed the largest increases in Licensing and Other Income.

    This is a multiplication of many assumptions, but there is some intuitive logic. The only place iCloud can be found seems to be growing in proportion to iCloud users and plan marketing.

    So how much does iCloud contribute to Apple's sales? My guess would be about $1 billion per quarter. That would be spread over 500 million iCloud accounts and therefore an average revenue per account of $2/user/quarter or $8/user/yr.

    The lowest non-free iCloud pricing is about $12/yr (5GB plan is free). This would imply that two thirds of iCloud users are paying users (and one third are opting for the 5G plan).

    I realize that this attach rate to a paid service is astronomical. Anything over 10% is unheard of. I would say the error in my estimates could be 20% but that still leaves a huge gap to what seems reasonable.

    [Put another way, if the attach rate were only 10% then iCloud revenues would have to be in the $600 million range and thus only about 10% of what Licensing and Other income seems to be. This would force the question of what could be generating the remaining $5.6 billion/yr.]

  8. Faster Followed

    Research · 76 comments

    Samsung's smartphone ascent was breathtaking. From having essentially zero market share in the category in late 2010 to becoming the largest vendor took less than two years. In doing so it grew to become the largest phone vendor, smart or not--a goal which eluded them during the previous decade of effort. Samsung went on to capture not only the lion's share of unit volumes, they also took almost all the profits in the Android mobile phone market.

    And in a market filled with competitors. Literally hundreds of vendors and thousands of products were available at every conceivable price point. Samsung did away with HTC, LG, and Motorola. HTC, the first Android vendor (and first to market with Windows Mobile), Motorola, Google's launch partner in the US and "Droid" brand partner (and future owner).  Google's own Nexus products. Samsung Galaxy ruled them all.

    Galaxy swamped the Chinese market and the Indian market, the largest in the world. They were so powerful that they were singled out both by Microsoft and Apple for IP royalties.

    All within two years or the average life-span of one smartphone.

    But something went wrong in 2014. Growth in shipments suddenly stopped. This was not a problem with the overall market, which kept growing. The slowdown did not affect other vendors, especially the up-and-coming Lenovo and Xiaomi and the second and third tier vendors whose names are  known only in the local markets they serve.

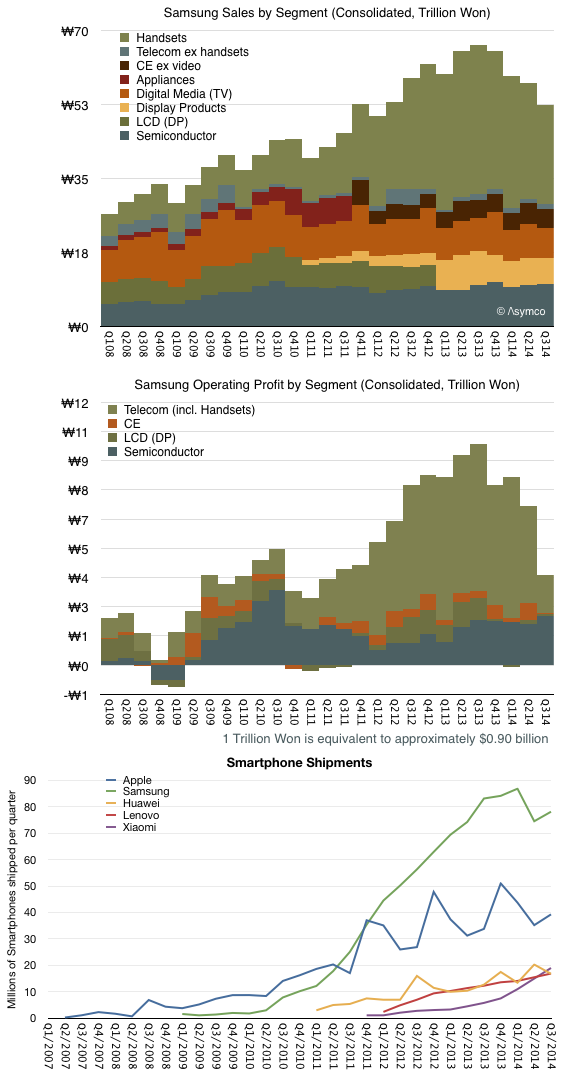
    The result of this slowdown is shown in the following graphs:

    <>

    Screen Shot 2014-10-30 at 10-30-4.11.19 PM

    Note how the wobble in units shipped was foretold by slowing revenues and an even more profound effect in profits. Peak revenues and profit occurred in Q3 2013 while volumes continued to grow until Q1 2014. Even in the last quarter, shipments are at near year-ago levels. Profits however have dropped to 2011 levels.

    At the same time, Apple shipments continue to grow as do those of Lenovo, Huawei and Xiaomi. Xiaomi in fact is growing in a trajectory eerily parallel to that of Samsung from 2010. It just hit the same level of volume that Samsung had in Q2 2011. And Samsung had been making phones for decades while Xiaomi is barely two years old.

    Having seen a boom/bust rise/fall pattern with other vendors (e.g. Nokia and Blackberry) it should behoove us to ask what are the causes of success and failure in this business. Samsung management suggests that they perceive speed of action, product mix/portfolio choices and hardware experimentation are the keys to their success.

    However, competitors which are rising rapidly (at the expense of Samsung) are not acting in the same way. Xiaomi is patterned as a Chinese Apple, offering design, brand, attention to detail and software as differentiation. Lenovo is building on its computing roots and expanding with acquisition. Huawei and ZTE leverage networking business and operator relationships.

    The crisper answer to causality may be that the market is bifurcating into an "upper" market where new jobs-to-be-done are being explored with integrated offerings (Apple and Xiaomi) and a "lower" market which is in the throes of low-end disruption. Both are competing with non-consumption though the upper market is service non-consumption and the lower market is feature non-consumption.

    Samsung is stuck right in the middle ((Just like Nokia was.)) It defines itself on the basis of what exists. It competes only within a defined market and positions itself agains existing products. They claim to be "better" than the competition and make the point loudly with their advertising. However, being better is never a solid foundation. At some point you'll be either good enough or someone more agile will be faster than you.

    At some point the fast follower exposes themselves to being faster followed. Better to find new lands to conquer.

  9. One billion sold

    Research · 12 comments

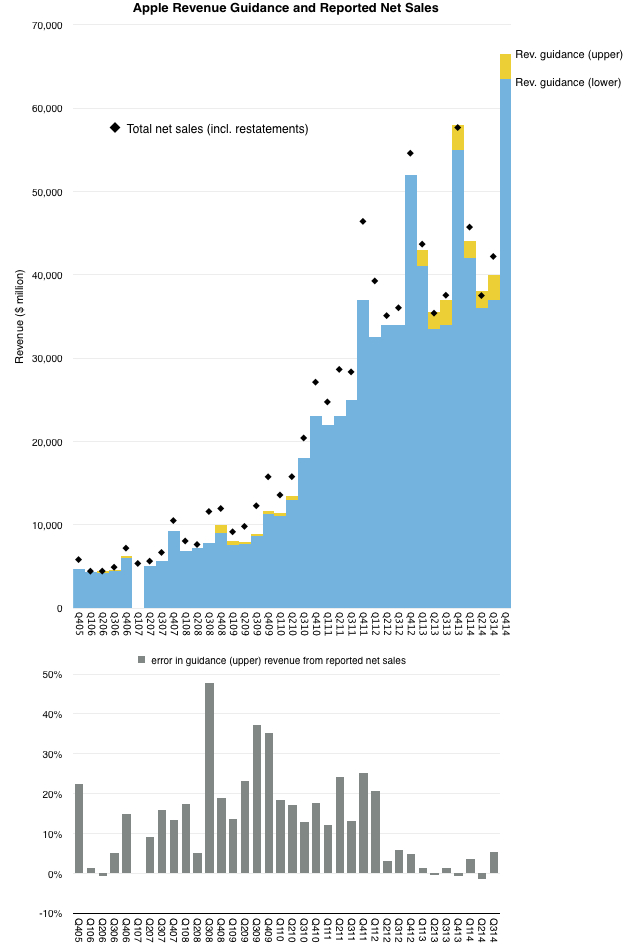
    In Q3 2014 Apple's revenues were 5.3% higher than the upper end of their guidance. This is the highest error in guidance since the new range-bound  reporting regime started two years ago.

    The following graph shows the guidances given since 2005 and the actual revenues. The error (as a percent of upper guidance) is given in the second graph.

    Screen Shot 2014-10-23 at 10-23-10.44.28 AM

    Note how since the newer, presumably more accurate method was introduced in 2012, the errors have decreased on average. As a result, for these two years, forecasting performance for Apple was no longer challenging. The only questions for the analyst were how to allocate the revenues among products and to guess how many shares would be retired.

    Is this about to change? Could forecasting make a comeback as sport and leisure?

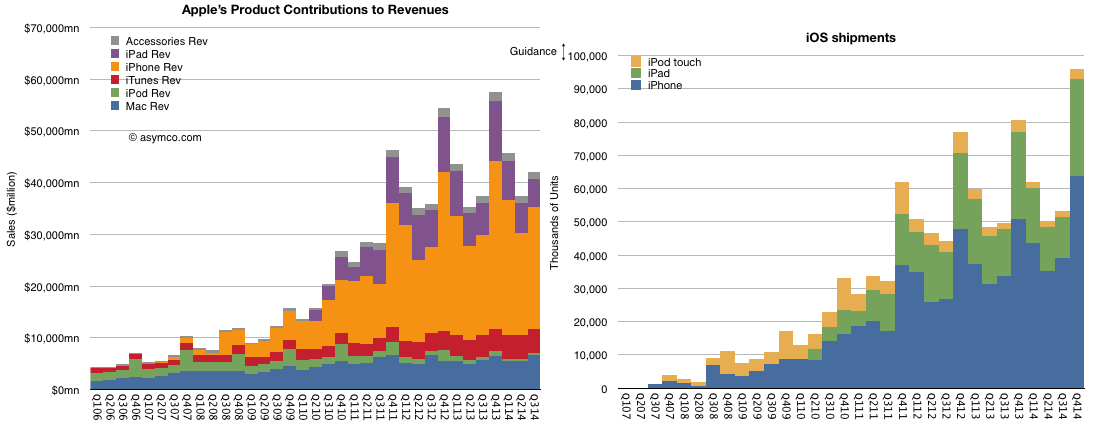
    Assuming no error in Q4 yields the following shipment forecast:

    Screen Shot 2014-10-23 at 10-23-11.11.17 AM

    That's about 95.5 million iOS devices in the quarter. That also means that the one billionth iOS device will have been sold sometime in the next few weeks. ((McDonalds took 23 years to serve its first billion hamburgers)) ((Over 650 million iPhones, 115 million iPods touch, 265 million iPads))

  10. On the trajectory of successful companies

    Research · 159 comments

    Samsung Electronics warned Tuesday that its third-quarter earnings would fall below market expectations. It did not cite a decrease in shipments but an increase in marketing expenses coupled with an unfavorable mix (i.e. more low-end units and fewer high-end units).

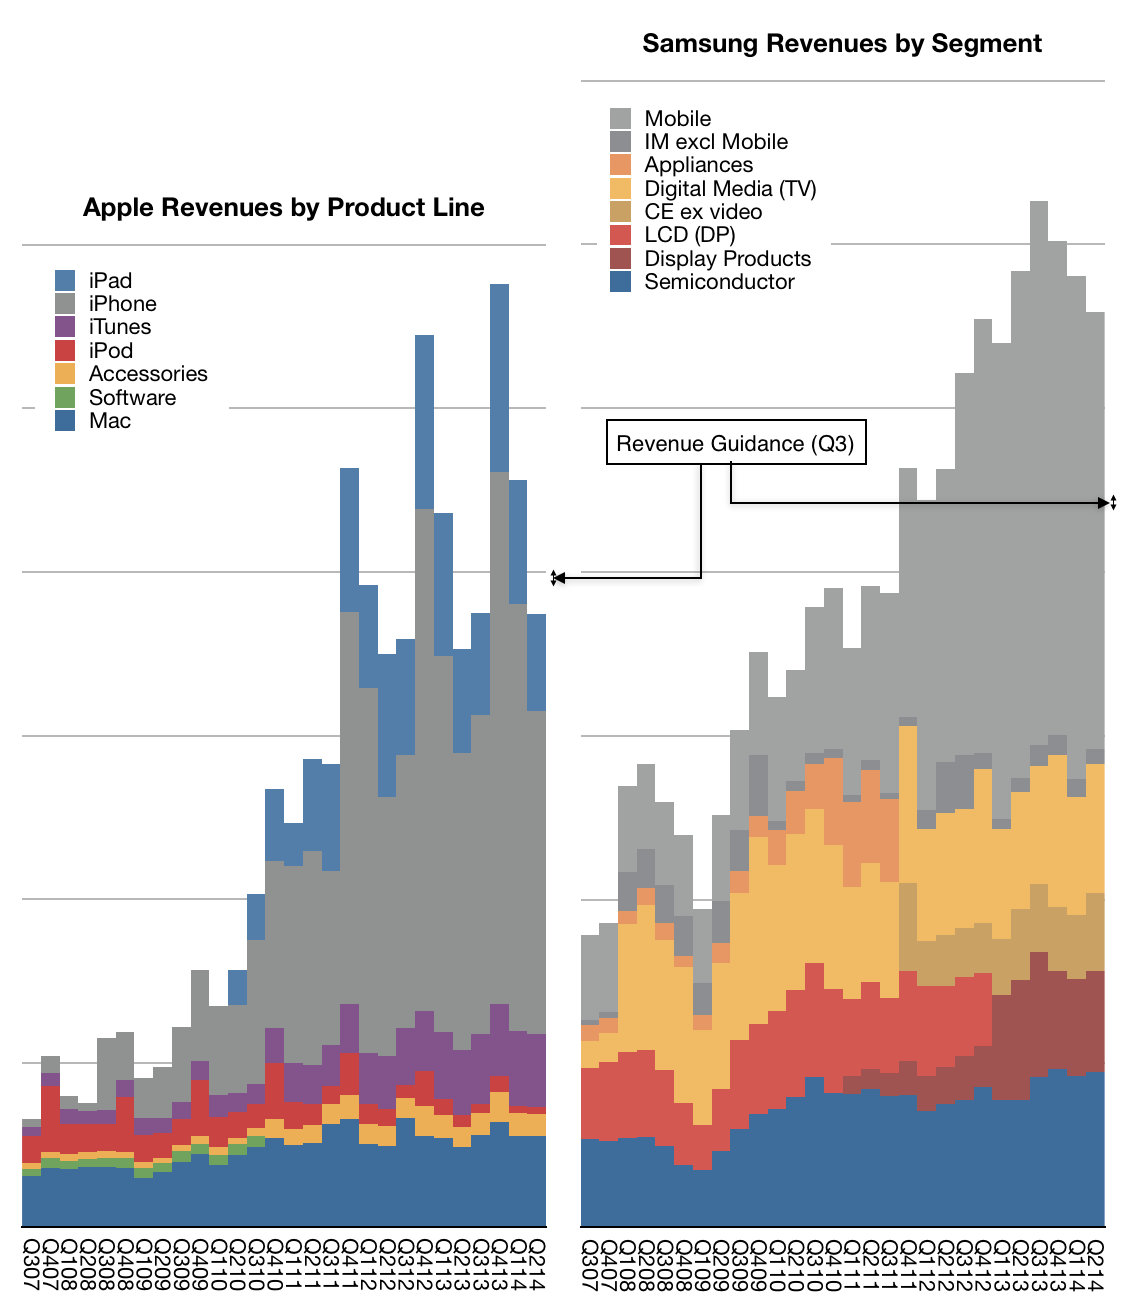
    The headlines reporting the news emphasized the 60% forecast drop in operating income but the company also provided sales figures. Adjusting for exchange rates, the forecast revenues are shown in the following diagram:


    Screen Shot 2014-10-07 at 8.51.05 AM

    Note that I also included Apple's revenue history and forecast. Samsung's revenues are shown on the right and Apple's on the left using the same scale (each horizontal gridline represents $10 billion/quarter.

    The explicit cause for the drop is a decline in prices and "increased competition". ((Though one can't be sure when there was ever decreased competition in its markets.)) However a few more questions need to be answered regarding long-term success in the markets Samsung competes in.

    Namely:

    • The absence of a software platform fully within its control
    • The absence of control over an ecosystem of content and apps
    • The absence of services
    • The lack of integration of software, services and hardware
    • The absence of differentiation vis-a-vis other vendors
    • The indefensibility of its low end offerings from low end disruptors
    • The pattern of commoditization in all its markets

    Samsung is a very big company but many very big companies came to become small companies. They all followed similar roads.

  11. Beleaguered

    Research · 94 comments

    Amazon's recent disputes with publishers (Hachette and Disney) shows a degree of market power that is closer to monopsony than to monopoly but this power is nevertheless real. It may not not be something that requires intervention, regulation or even scrutiny but market power is evident in both how companies operate and in how they are valued.

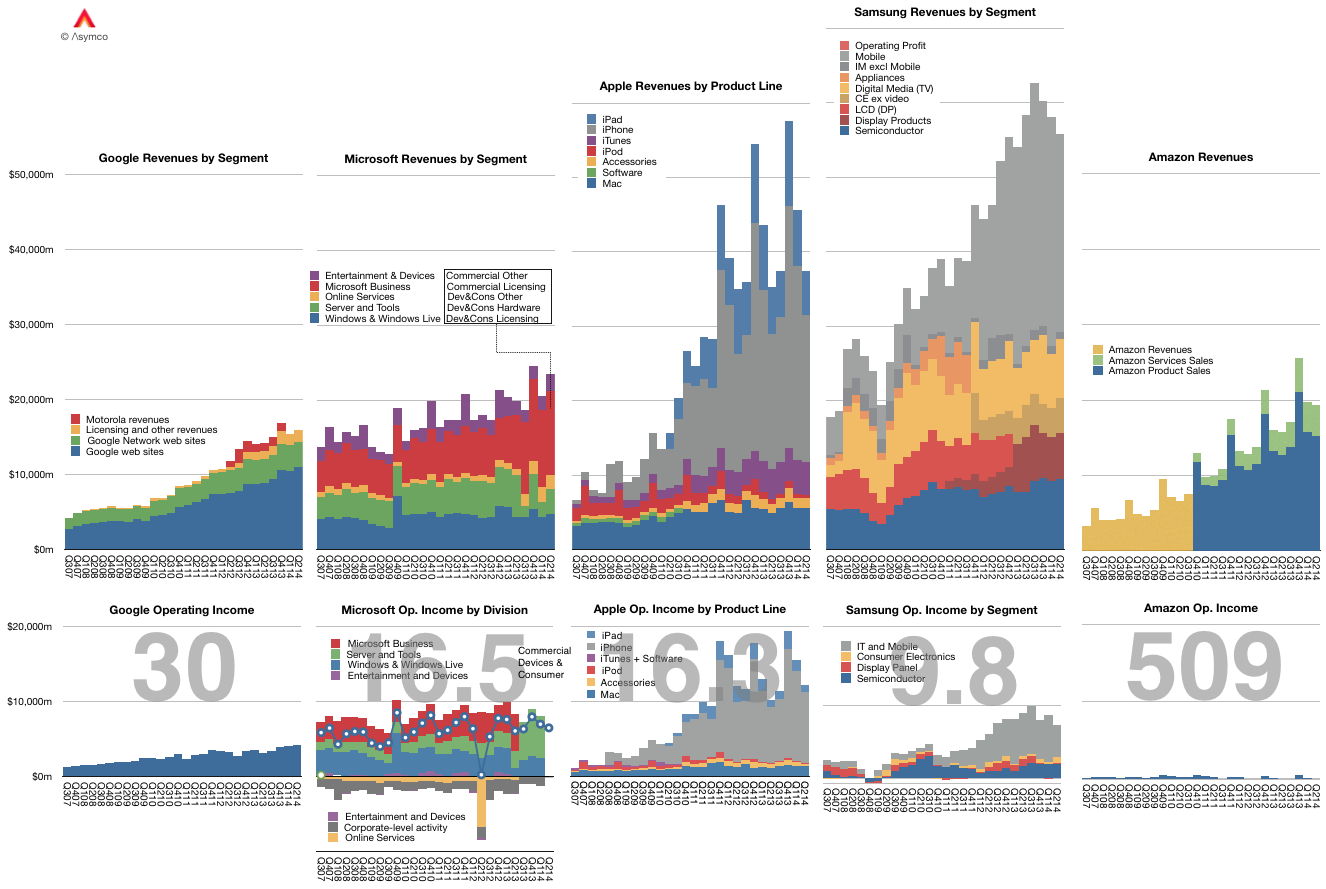
    If you look at the following graph, it's easy to spot those with "monopoly" power. The graph shows a short history of revenues/operating income and P/E ratios. Modest or no growth in earnings coupled with extraordinary high P/E ratios indicate that the market understands the business is not threatened by competition.

    Screen Shot 2014-08-14 at 8-14-1.40.47 PM

    In contrast, "beleaguered" companies include those with great sales growth but no perceived long term prospects. This perception is evidenced by a low P/E ratio. It indicates how long the company can maintain its present level of profitability. I've highlighted Apple's continuing, and indeed perpetual, beleaguered state. Excluding its existing capital base, Apple rarely gets votes for a life span longer than 10 years. One can see the same status in many Asian companies. Samsung is even more beleaguered than Apple by this measure.

    The underlying implication is axiomatic as far as investments are concerned.: Being under threat all the time is undesirable.

    But is this true?

    One of the issues with monopoly/monopsony is that it leads to business practices and strategic priorities that are tainted by hubris. In contrast, the stress of competition leads to "paranoia" and to a sense of urgency which is blessed by innovative insight.

    This is a corollary of Grove's "only the paranoid survive" or Jobs' rant on why Microsoft was unable to come up with breakthroughs. Grove and Jobs looked at dominance of a market (as either buyer or seller) and saw a curse. Their understanding of the human condition went beyond what the arithmetic of markets would suggest. Running a business and managing people who are asked to create things leads to this insight. Peering at spreadsheets doesn't.

    The observation to be made is that those who invest in companies haven't caught on.