Asymco

Asymmetric Intelligence

revenue

  1. The Alphabet of Google A and Google B

    Research · 86 comments

    For the last few years, I've been proposing that the way to conceptualize Google is as two separate entities: Google A and Google B.

    Roughly speaking Google A was the R&D ((Research and Development)) organization and Google B was SG&A ((Sales, General and Administrative)). You can find the operating expenses of running each of these organizations in the company's income statement.  In the last quarter R&D was about $2.8 billion and SG&A was about $3.5 billion ((Sales and marketing was $2.1 billion and General and Administrative was $1.5 billion)). The two entities are further distinguished as follows:

    • Google A was led by Eric Schmidt and Larry Page and Google B was led by persons unknown, but mostly represented by the "Chief Business Officer" Omid Kordestani.
    • Google A spends money. Google B collects money.
    • Google B sends a check to Google A while Google A sends data to Google B (which then sells it on to advertisers and collects money).
    • Google A communicates frequently with optimism and enthusiasm about the future. Google B remains quiet.
    • Google A solves problems of humanity, Google B solves problems for advertisers.
    • Google A has users, Google B has customers (to whom it sells users.)

    In summary, Google A is altruistic, Google B is pragmatic. Google A engages in research, Google B engages in commerce. Google A operates in a structure similar to a Bell Labs for the good of humanity ((Using a definition of Good as established by the founder)),  Google B operates in a structure similar to AT&T and collects monopoly rents but without any government oversight.

    This was an effective construct for analysis which explained to me much of how Google operated and how it made decisions. So what do we make of Google's new Alphabet? Is this a dissolution of the Google B/Google A dichotomy?

    My initial answer is no. We don't have a change in this core structure. What we have instead is a split of Google A into Google A and Google A+.

    A+ is the crème de la crème of the altruistic Google A. It's the stuff that really does not make money. It's the laboratory of Bell laboratories. It's the moonshot manufacturer. It's the incubator where hobbies are hatched. It's the funder of ventures.

    After A+ is carved out, Google A and Google B remain exactly as they were, now under a new CEO. The previous CEO no longer has any day-to-day input in the running of Google A and is no longer soiled by association with Google B.

    Alphabet is therefore the "holding company" of Google A+, Google A and Google B. I can only suppose that the separation of A+ from A (and the previous A from B) allows the founders to distance themselves even further from the purchase decisions which, through pricing signals, determine where value lies and how resources should be allocated. That must be a great relief.
  2. Samsung's profit center

    Research · 41 comments

    Will there come a time when Samsung will earn more profits from the iPhone franchise than from its own Galaxy product line?

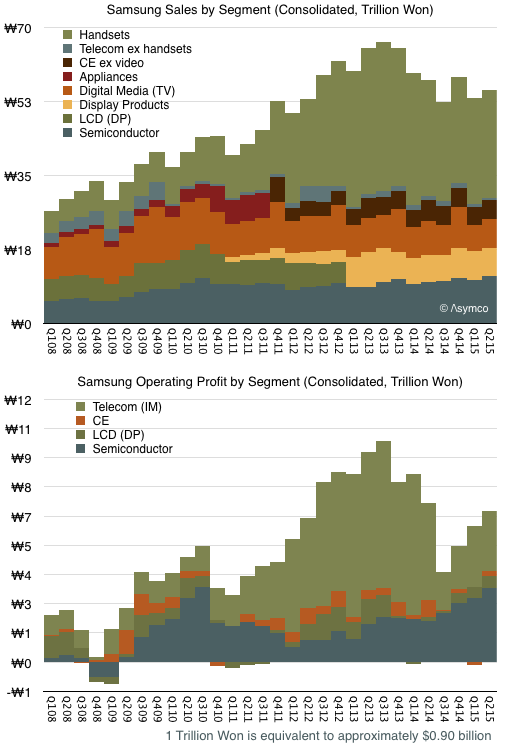
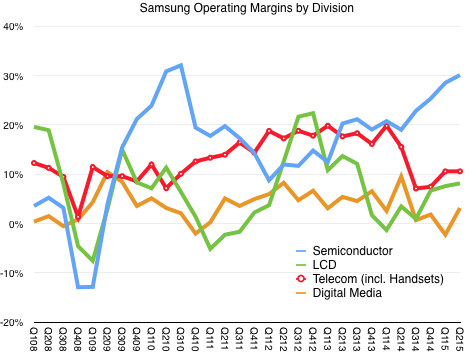
    The problem for Samsung is that although it still sells the most phones ((over 80 million but we don't have a precise figure)), and the most smartphones, the price and margins for these products are collapsing. The pattern is shown in the graphs below:

    Screen Shot 2015-07-30 at 7-30-8.20.29 PM
    Screen Shot 2015-07-30 at 7-30-8.20.22 PM

    Phone operating margins peaked in Q1 2014 at 20% but are half that level today. These margins have dropped to levels Samsung had in 2009, before the Galaxy launched and before they had any substantial revenues from smartphones.

    In contrast, the semiconductor group is growing both revenues and margins. Margins and operating profits are both 50% higher than those of devices.

    We also know that Apple is Samsung Semiconductor's single biggest customer. We can't be sure how much of the total revenue/profit comes from Apple but if the pattern continues then Apple could be the greatest contributor to Samsung's profitability in the near future.

    How could this be? Wasn't Samsung supposed to "disrupt" Apple?

    The reality is that Samsung's own smartphones are being disrupted by good-enough Android devices, typically made by Chinese brands. This low-end disruption is also affecting LG, another phone maker and Apple supplier.

    Unlike Samsung and LG, Apple is less susceptible to low-end disruption. What Apple offers is a brand promise, an ecosystem, associated products and services and what amounts to a new market. It's this parallel value network that competes with Android/Google, rather than with Samsung.

    Samsung is a supplier in the Apple network and a licensee in the Google network. As a result, it has a near monopoly position with a platform controller (Apple) and a commodity position with a platform licensor.

    Neither position is one of control, but the current market stage benefits Samsung within the Apple ecosystem more than  in Google's ecosystem. It's a situation analogous to one where Intel made both x86 chips and PCs that ran Windows. Long term it's likely that the sole-source chip business does a lot better than the multi-source systems business.

    That should be a warning to others who hoped to survive as Android OEMs. They don't have semiconductors to sell to Apple.


  3. How iPad Educates

    Research · 20 comments

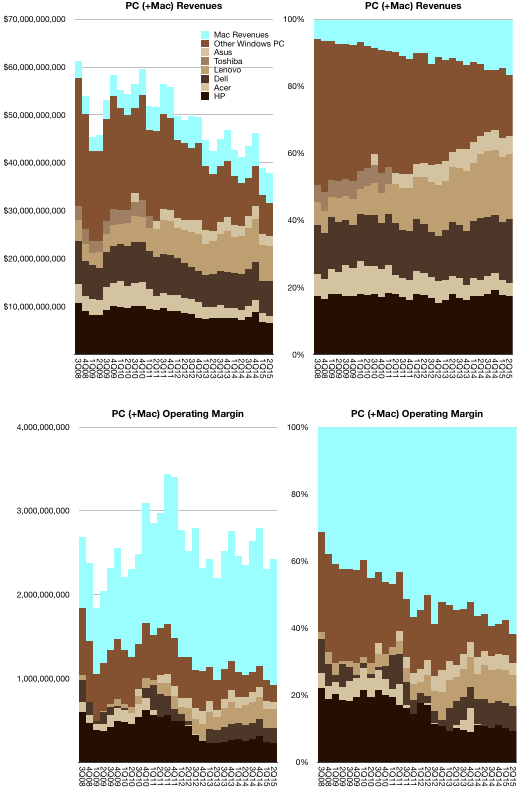
    The fact that the iPhone is contributing over 90% of the operating profits in mobile phone sales has penetrated even as far as the Wall Street Journal. However, it's not yet commonly known that the Mac captures a majority of personal computer operating profits, at least when considering the sale of hardware.

    My calculations suggest at least 60% of operating margin in personal computing hardware is captured by Apple. This is mainly due to the fact that the average Mac sells for more than $1200 while the average PC sells for less than $450.That is equivalent to $1.5 billion per quarter for Apple vs. $930 million for all the other PC makers combined.

    Screen Shot 2015-07-17 at 12.16.27 PM

    If we are to consider the iPad as a "PC equivalent" computer ((for a substantial minority of tasks)) then another $billion/quarter is contributed to the profit pool. It increases Apple's share of profits to 73%. As a result, Apple absolutely dominates computing profits.

    But, as we know, computing, even on handheld devices, is enabled by a multitude of business models. Selling hardware is one thing, but Microsoft showed that one could sweep up profits in the industry by selling enabling software. It's much harder to assign a share of profits if we try to consider all the business models associated with computing and all the form factors that computing has taken shape in.

    The problem can be acutely observed with the iPad alone. It's sold with a decent margin ((my estimate is a gross margin of around 27%)), though not one which approaches that of the iPhone ((my estimate of the iPhone gross margin is near to 48%)). It also enables an ecosystem with thousands of collaborating firms and users.

    Consider the uses of the iPad in education. 15 million iPads were sold to educational institutions. An unknown number of millions have been hired for education uses by end-users or teachers. The result is over 100,000 education apps are available in the App Store.

    The education sector's "jobs-to-be-done" has led to the product being associated with entire new processes for education. Education is not a product but a process and therefore any technologies must be hired as part of the process. In the App Store you can see the “Apps in the Classroom” guides along with impressively powerful apps being used in education. These are educator-created guides designed for other educators.

    There is no way to measure the "profit" in this endeavor.

    Nor is there a way to capture the "profit" in people engaging in exercise because they wear an Apple Watch.

    Nor is there a way to track the operating profit of HealthKit which has enabled 1000 apps to help people manage their health.

    These education and health efforts are not designed to be profitable. And yet Apple is very profitable. That is because creating valuable things generally leads to value being accrued by their creator. How that happens is not very important. Indeed, focusing of the how is actually often self-defeating. What matters is the why and the what is done.

    Understanding this leads us to understand the foundation of any great organization, not just Apple.


  4. Selling Watch Sales Data

    Research · 22 comments

    There is no reliable information on Apple Watch sales. None of the analysts which follow Apple or the phone, computer or watch markets have any insight into this. The only source of information is Apple itself and they have made it clear that they don’t intend to provide watch sales data for competitive reasons. I did not and do not expect any information from Apple on watch sales. They have placed the product within the “Other” category specifically to make unit data hard to discern and have explained why they do so.

    The only estimate we have heard of is from a company that has no track record in market research and relies entirely on sampling of email receipts. I urge extreme caution when dealing with this type of data. We don’t know how representative these receipts are and how they are sourced or sampled. The methodology is not only unclear but it’s one not practiced by any other analyst. You would think that receipt sampling would be a phenomenal source of information about a lot of other products and yet we hear nothing about how predictive it is for anything except this particular new product as claimed by a company which never made any such prior claims.

    It’s also a sampling of (presumably) US-only customers at a time when the product is undergoing a gradual roll-out through multiple countries and multiple channels. Consider that if sales were constrained internationally then buyers would be trying to arbitrage through the US market, meaning there would be many e.g. Chinese buyers/brokers booking sales through US online stores inflating that channel’s initial volumes. Furthermore as physical retail stores begin to receive stock, online sales (which are what is sampled) should decline as buyers opt for the instant gratification (and the option to see the product in real life.) To see US-only online purchases drop after a period of pent-up demand and as store inventory becomes available is not interesting and says almost nothing about the product’s performance.

    The only way to be thoughtful about this new category is to understand the broad transitions underway in mobile computing. We are witnessing a pivot in human-computer interaction as significant as the initial iPhone launch.

    [As a rule, be very careful with the premise of data salesmanship. All data is false, some is useful. Data you have to pay for is less useful than data that has been peer reviewed.]

  5. Breaking the Law

    Research · 22 comments

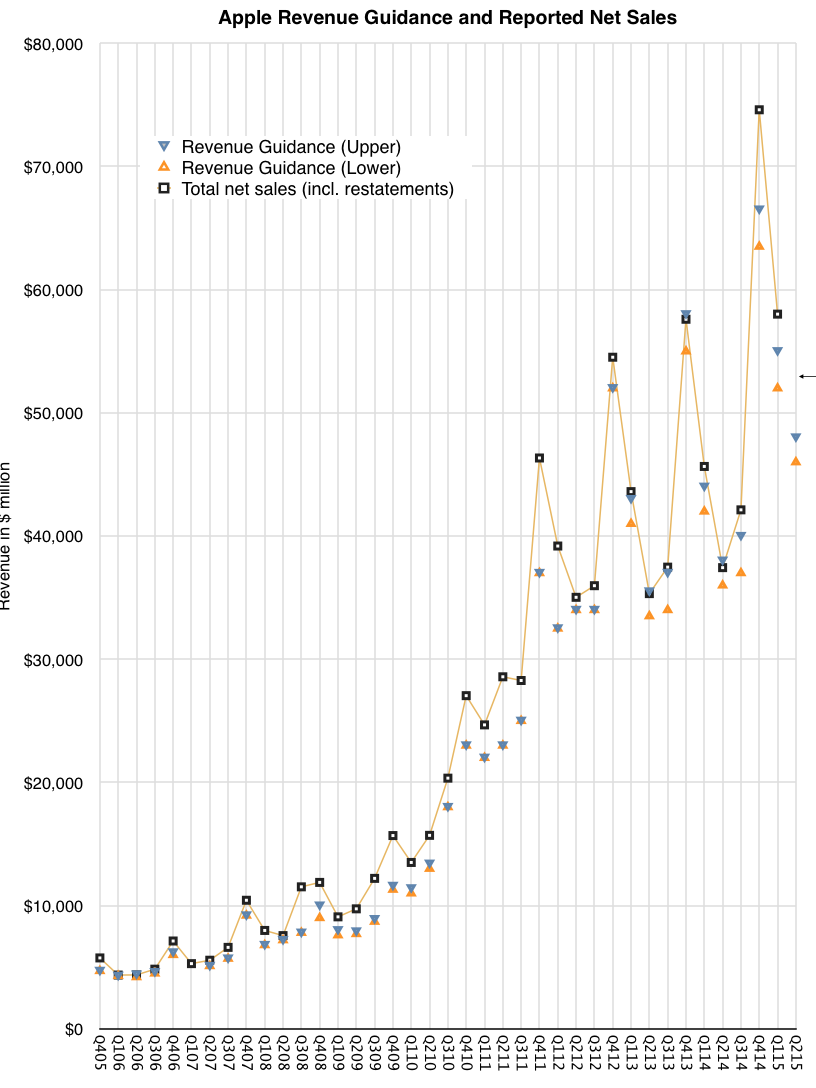
    For the first time in many years I feel that there is some potential uncertainty in the results Apple will announce. After a period of excellent accuracy (shown in graph below), the company's guidance has begun to diverge dramatically from reality and the trend might continue this quarter. The cause might be unanticipated demand for the iPhone 6/6 Plus. The growth rate for the product was 46% in Q4 and 40% in Q1. This is unanticipated because growth rates have been below 20% for five quarters and below 50% for eight.

    Screen Shot 2015-07-13 at 12.21.00 PM

    This slowing of growth was explainable given the rate of diffusion of smartphones in the global population. Within the US and some other early adopting economies the market is reaching late stages where most people have switched to smartphones. Globally we are at a more modest 30% or so but in many of the late adopting economies Apple does not have wide distribution.

    Of course this thesis is thinly supported. There are many reasons to think that late adopters would still start with iPhone and that earlier adopters of Android would upgrade to iPhone after a few purchase cycles. Thus, the iPhone could prosper in later-adoption or even in post-saturation states of the market.

    Indeed, in the post-saturation PC market, Apple is doing very well with the Mac and in the late to post-saturation MP3 player market the iPod did extremely well. This suggests that when it comes to value capture brand, experience and satisfaction trump function, price and share considerations in almost all consumer markets ((Enabled by design for jobs to be done. See non-technology markets for abundant evidence of this. ))

    With so many assumptions put asunder the iPhone business suddenly looks downright lively. I adjusted my own growth assumptions and the resulting figures are shown below.


    F3Q15Daniel TelloHorace Dediu
    iPhoneUnits51.052.8
    Price626645
    Revenues3192534059
    iPadUnits10.010.6
    Price428430
    Revenues42804567
    MacUnits4.954.94
    Price12401240
    Revenues61366129
    ServicesRevenues50065196
    OtherRevenues39023092
    TotalRevenues5124953043
    COGS3057731766
    GM40.3%40.1%
    OpEx57335789
    OpInc1493915488
    OI&E357350
    Pre-tax1529615838
    Tax40234165
    NetInc1127311673
    Shares57795780
    EPS1.952.02


    I include for comparison Daniel Tello's forecast as his work carries quite a bit of thoughtful analysis.

    The upshot of this is that the company is poised to grow earnings per share at a rate of at least 50%!

    That growth rate is astronomical, especially for what is already, by far, the world's biggest company by market capitalization.

    This was not supposed to happen because of a so-called "law of large numbers." The "law" is actually a probability theorem which states that the average of experimental results should be close to the expected value given sufficiently large number of experiments. The way it's applied in market analysis (I assume) is that "no company can perform above market average performance for a sufficiently long time".

    It implies that there can be no outliers and that all companies "revert to the mean because ..."

    Actually, I don't have any idea why they might. The premise that all companies are the same must play into this but companies can only be alike if they have the same processes, priorities and resources. As long as I've been able to observe and as much as I've ever read on the subject I have never encountered any two which had anything in common.

    And so the law of large numbers, as applied to market performance is a myth. It is easily disproved with a simple deconstruction into the causes of firm performance, but the empirical data from Apple alone shows how foolish it is to believe it.

  6. Where are Maps going?

    Research · 311 comments

    At the 2015 WWDC Apple stated that it receives 5 billion requests per week for its maps service. It also said that Apple maps is used 3.5 times more frequently than "the next leading maps app."

    These two data points are the total number of data points we have about the global maps market. Neither Google nor Nokia provide usage or share or performance data. Regardless, commentary on the usage, share and performance of Apple Maps has been abundant for the three years since its inception.

    The data presented allows us to make a few estimates for the first time and we can hope that additional data can allow a picture to emerge of where maps are going.

    With these first two data points we can finally make some estimates. But some assumptions are still needed: We need to assume that the "next leading maps app" is Google Maps. Although there are other maps apps on the iOS platform they are probably insignificant and it's a two-horse race between Google and Apple on iOS.

    This means that the 3.5:1 split in usage results in a 78% share for Apple Maps and a 22% share for Google. If we assume that there are about 400 million iOS users of maps ((Note that not all iOS users are maps users. Maps are not used by all users)), it leads to about 90 million Google Maps users on iOS and about 310 million Apple Maps users on iOS.  This includes iPad. ((We are excluding OS X use of Maps.))

    Given that Google also reported 1 billion downloads in 2014 ((though not necessarily all of these downloads lead to active use, obviously)) we can assume between 25% to 33% Apple Maps "market share" of usage.

    At the minimum, 25% share is not insignificant and it's easily sustainable. To understand why, we should note that there is one more data point. In December 2012 I posted an analysis on the the cost of maps. It showed that maintaining maps requires an investment of between $1 billion and $2 billion/yr. With the addition of new features such as 3-D mapping, transit maps and thousands of new cities, the cost is likely to have increased. $2 billion/yr is probably the norm today.

    Apple then could be seen as spending about $6.5/user/yr on maps and Google could be spending about $2/user/yr. To be profitable Google would need to find ad revenues of $2/user/yr and Apple would need to find $6 of profit on each phone/yr. Clearly, each of these targets is achievable.

    In contrast we can see why Nokia's HERE Maps business is now worth a lot less than it was in 2007. The asset has been for sale for some time and the latest bid  has been for $3 billion, making the $5 billion lost in market value and $7 billion of investment since seem like a catastrophe. Without a business model the data is worthless--with only 30 million users the cost per user reaches $66/yr. A buyer needs to find an appropriate model for sustaining a $2 billion/yr burn rate.

    So the question of where maps are going depends on the business model for maps. In a world where maps are sustained by device value, 300 million users makes it sustainable. In a world where maps are sustained by advertising, 1 billion users makes it sustainable. What else is there?

    How about a world where maps are sustained by transportation services?

    Uber's and other auto makers' interest in HERE shows a third business model. Accurate maps are a key to making vehicles autonomous. More so even than the value of the algorithms, precise imaging of roadways enables vehicle autonomy and the value of location gathering systems should grow to meet that future.

    It's highly likely that Google's maps efforts are going to continue because they are fueled by a business model. That is also true for Apple's maps efforts, though they are fueled by an entirely different business model. Each of these business models fuels the improvement of the maps product but also of the maps gathering process. As these processes are expensive and licensing options are few there is little incentive to share the data. As a result the processes remain integral to the businesses.

    This integrated-while-fueled nature means that maps makers will find it compelling to pursue adjacent business models, i.e. transportation services. It's not a matter of whether they will or won't. It's only a matter of when and where.

  7. Schiller's Law

    Research · 9 comments

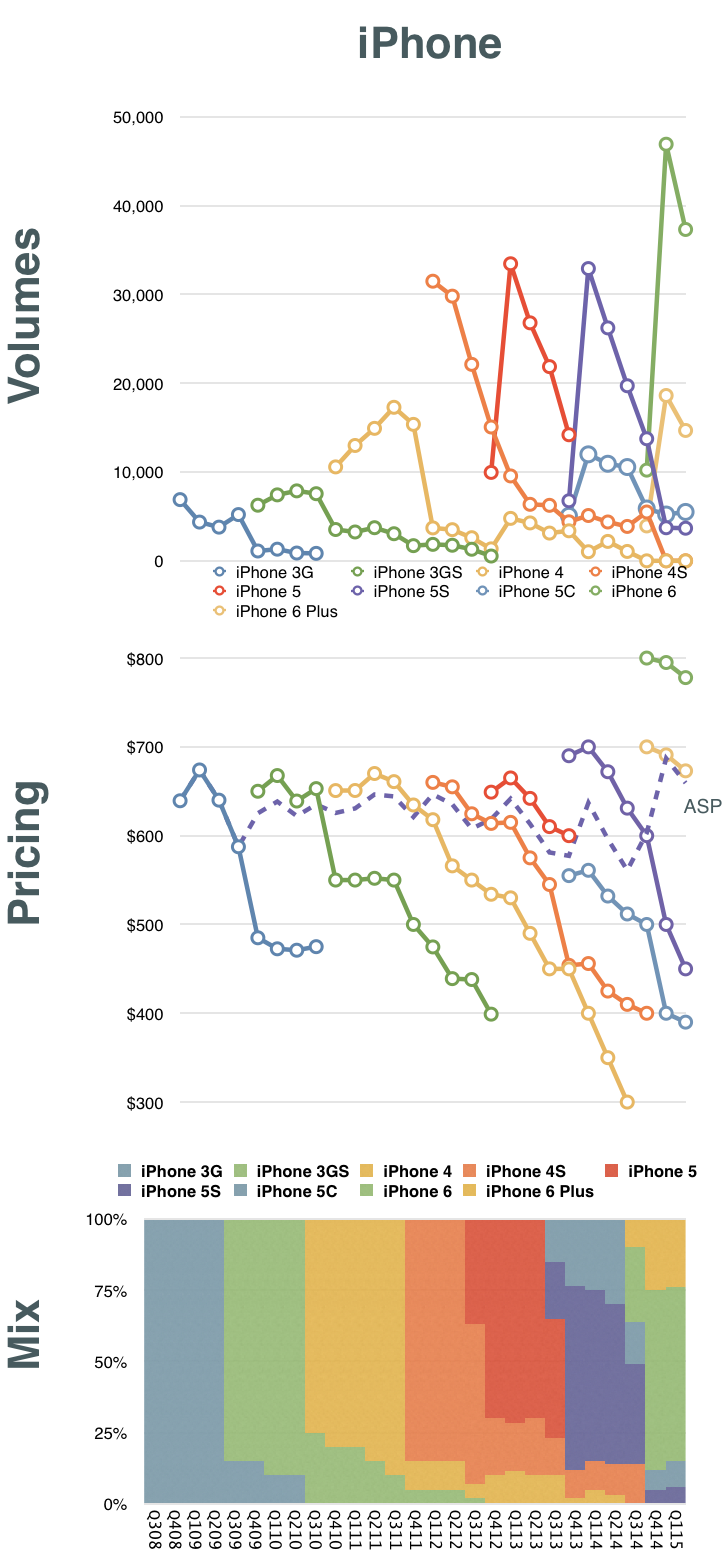
    We know how many iPhones Apple ships but we don't know exactly how many of each model. We can try to come close in such estimates of "mix" by looking also at the market pricing of the phones and the average price Apple obtains ((ASP = Revenue/Units shipped. However, note that there are deferrals in revenue as part of this.))

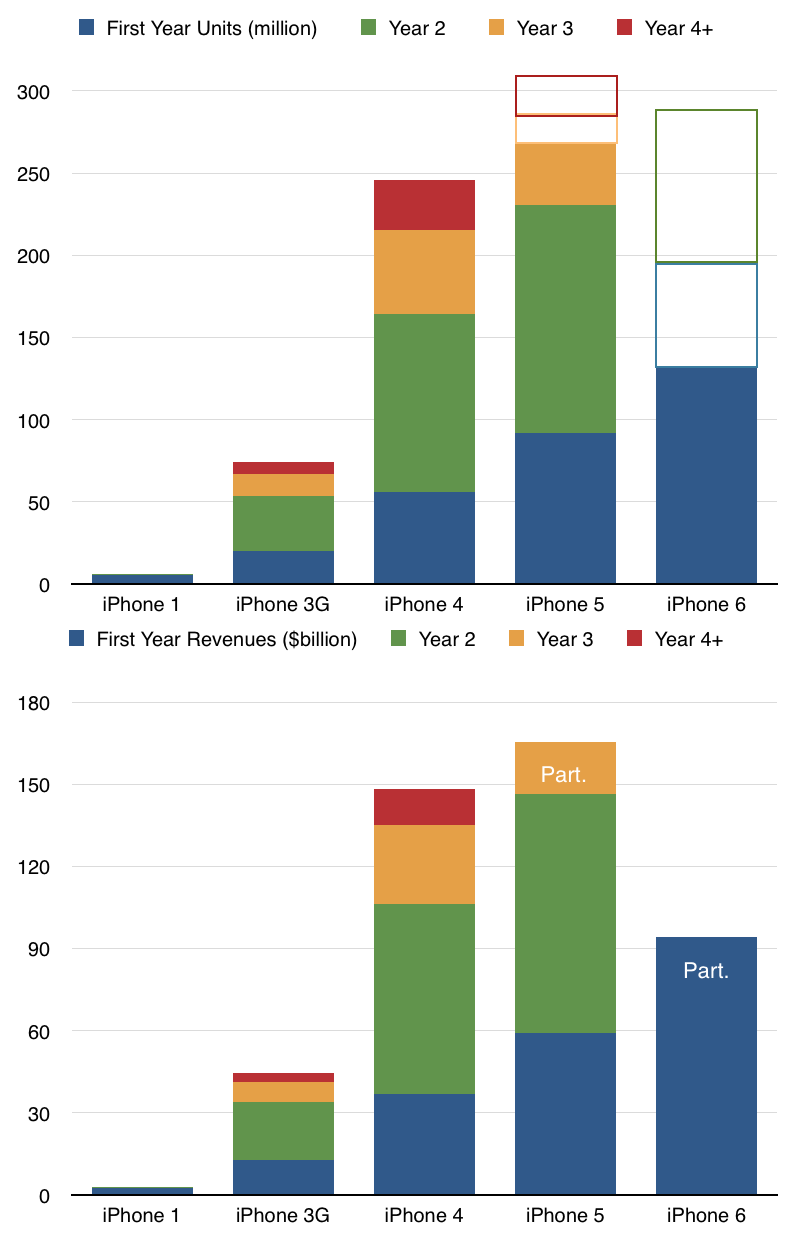
    Combining what we know with some guesses allows some of us to estimate the composition of iPhone models in any given quarter's sales. Here is a graph showing my estimates:


    Screen Shot 2015-05-22 at 2.53.36 PM

    Having this, we can then assess how each generation of iPhones has performed. Remember that although we had a new iPhone for each of the last eight years, there are only 5 generations in total. Starting with the 3G (second generation) the generations were two yearly product cycles long.

    The resulting estimates for generational growth are shown below. 

    Screen Shot 2015-05-21 at 6.41.02 PM

    I included a second graph with revenues. Note that the iPhone 5 and iPhone 6 have not run their course. History suggests at least a five year run for any one generation and the 5 is at less than three years old and the 6 is at less than one.

    The interesting question is therefore not whether each generation sells more than its predecessor but whether it does so by a substantial multiple. I drew in outline a few estimates on future volumes for the 5 through its end of life and for the 6 for the current and next year. Of course these are highly speculative but the question of how much can be expected from these generational leaps is interesting.

    Recall that

    When assessing sales for a new model of the iPhone, Apple used an easy shorthand: "Each new generation sold approximately equal to all previous generations combined."

    Phil Schiller's Testimony in Apple v. Samsung trial

    Such a pattern of growth, which I call "Schiller's Law" is extremely difficult to maintain and probably won't apply in the case of the 5 or 6. However the growth of the overall franchise is very apparent. In particular you can see how first year sales have a very healthy pattern of growth, especially when measured in terms of revenues.

  8. Unicornia

    Research · 14 comments

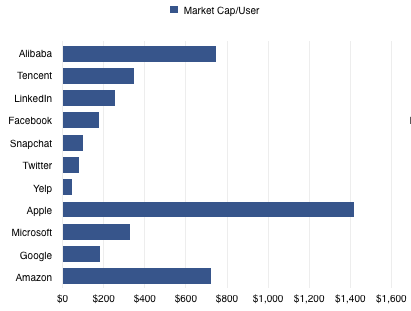
    Unicorns typically are valued on the basis of number of users. While they are not yet monetizing those users, their growth and engagement metrics are expected to be off the charts. As there are no revenues (or profits) the $billion valuation hinges on a nominal value of $/user. That figure is based on comparable companies (e.g. Facebook) which do monetize their users.

    Since the unicorn's capitalization/user defines its valuation, which company should be considered comparable? Unfortunately they range widely. There are many alternatives. The graph below shows a few Market Cap/Mobile User rates ranging from $45 for Yelp to $747 for Alibaba.

    Screen Shot 2015-05-15 at 5-15-2.47.16 PM


    Note that I've also added companies which may not be considered as unicorn comparables because they are not usually valued on a per-user basis. Apple, Microsoft, Google and Amazon are priced by product sales, typically. However, most of them operate and self-define as service organizations. Microsoft has been "monetizing users" for decades using a recurring revenue model. It has a "SaaS" business logic for most of its revenues. Google ((Google users are estimated at 2 billion active Android/GMS devices)) likewise. Amazon reports its active users every quarter and obviously is measuring itself by that metric.

    Apple ((The assumption here is that Apple has 520 million active users which is based on iOS devices in use estimates)) is the least likely to be seen as a company whose value is a function of user base. Nonetheless it behaves entirely on that basis. The company's entire strategy depends on satisfying its customers and building its brand which can only have one outcome: loyalty and repeat purchases. The services and software they offer can be seen as supporting that brand loyalty which is converted to profit through an above-average selling price.

    Being mature of business model therefore does not exclude a company from being valued like all the kids are these days.

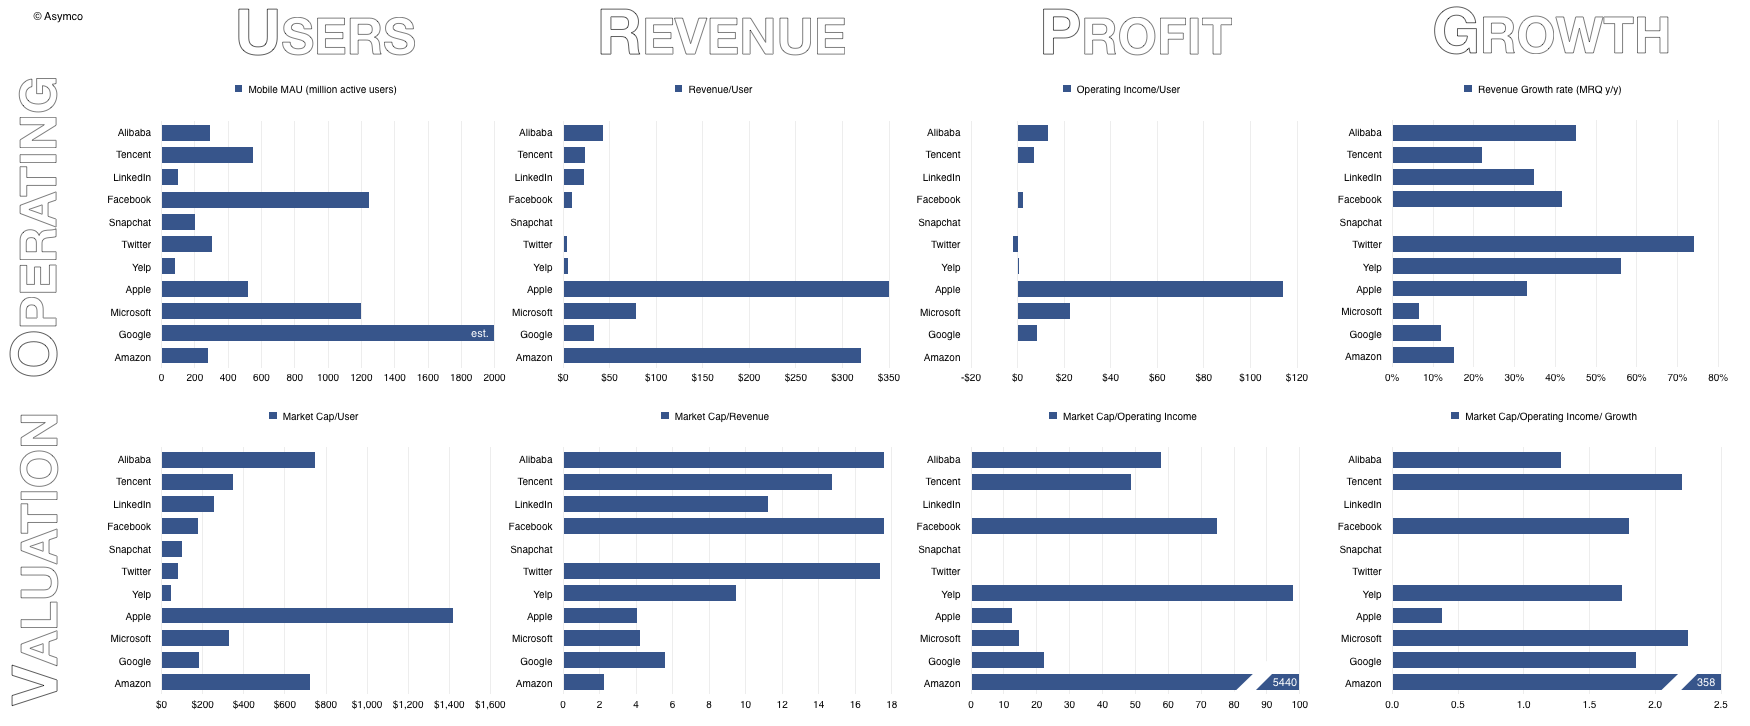
    So, if we do look at the value/user metric we might as well look at the revenues, operating profit and growth data.

    Screen Shot 2015-05-15 at 5-15-3.09.43 PM

    Unicorns are therefore characterized as having negligible revenue or profit but significant growth. The growth of Alibaba, Tencent, LinkedIn, Facebook, Twitter, Snapchat and Yelp should be seen in the 50% y/y range. The growth of mature companies is more modest: Microsoft (<10%), Google (12%), Amazon (15%).

    Apple is an exception with recent growth in the 30% to 40% range.

    Markets therefore value internet services at multiples of 10 to 20x revenues and 50x at least in terms of operating income. These multiples don't yet apply to Unicorns, since they typically don't have revenues, but the expectations are typically in this range once they do.

    Mature product companies are valued more cheaply with 2x revenues for Amazon (a retailer with zero margins) up to Google with near 6x. Apple and Microsoft are in the middle at 4x revenues.

    Mature company value as a function of income is also much lower ranking from about 12 for Apple to 22 for Google. Amazon's multiple is astronomical only because it has almost zero income.

    Finally, when considering growth and income together ((When seen into the future this is the PEG ratio or Share Price/Earnings/Growth. When seen into the past, this is the PETG or Share Price/Earnings/Trailing Growth)) both emerging services and product companies are priced between 1.3 and 2.5. The outliers are Amazon due to its lack of income (PETG of 358) and Apple with its enormous income (PETG of 0.4).

    This last ratio has had a "rule of thumb" of 1.0 being the "fair value" with <1 being seen as under-valued for growth and >1 being over-valued. Alternatively it can be seen as either pessimism about sustainability or optimism, respectively.

    Clearly Unicorn Mania (or Unicornia) is a reflection of an optimism around new market disruptions in many industries where software has suddenly become ingestible.  Old-school software companies are seen as less exciting in this context. If only they could take part in these new market creating opportunities then maybe they too could benefit from this optimism.

    Now that would be crazy talk.

  9. iPhone, killer

    Research · 253 comments

    Screen Shot 2015-05-13 at 5-13-8.20.01 AM


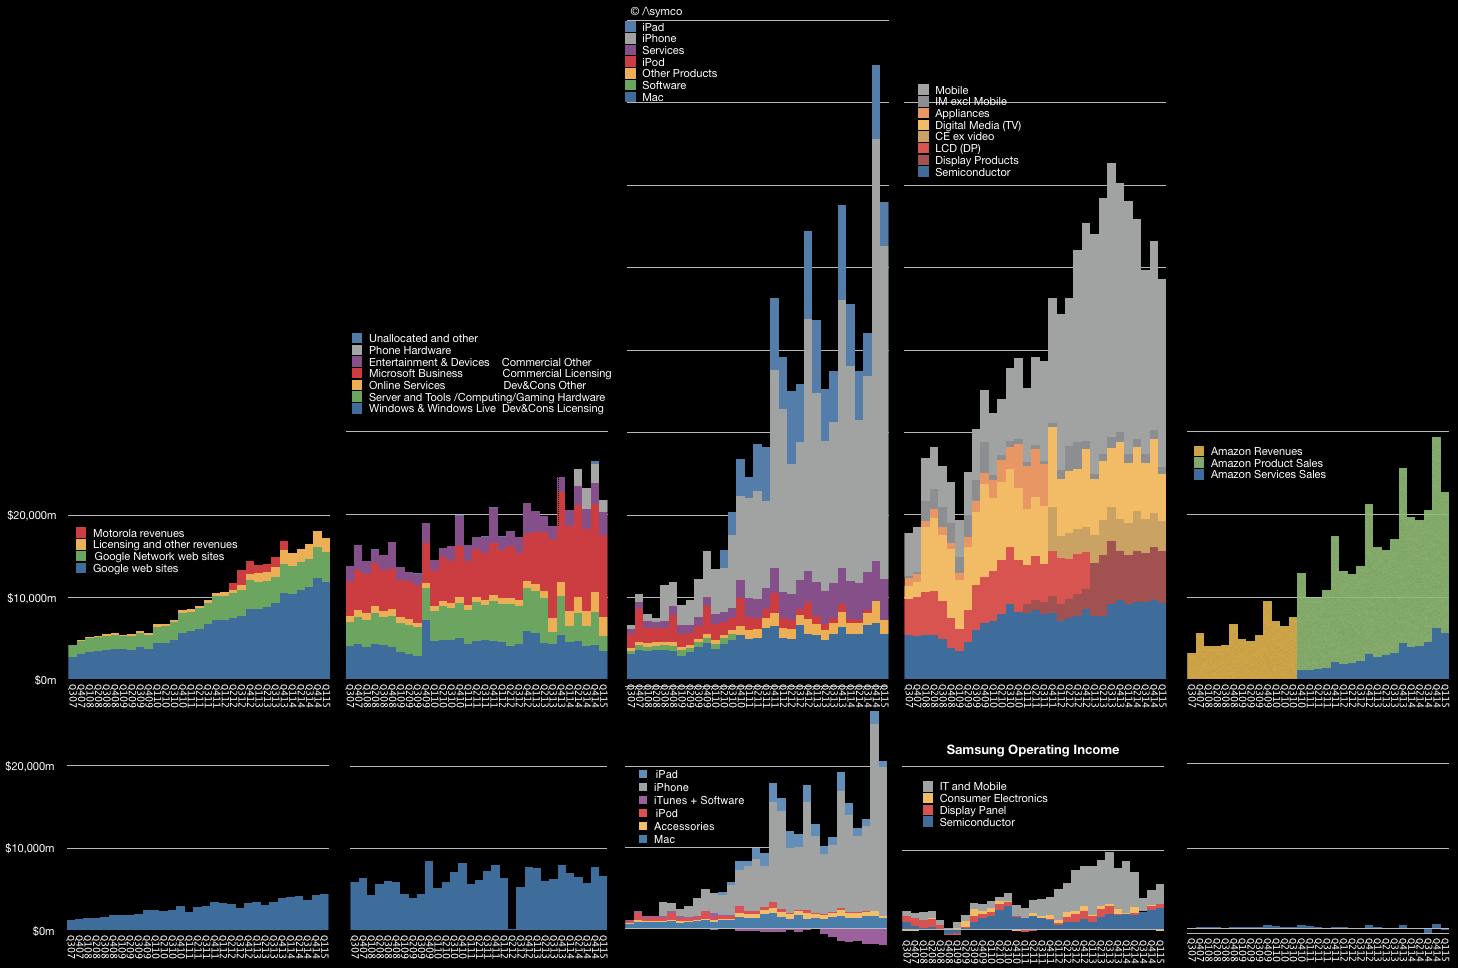
    Searching for "iPhone killer" returns millions of hits. It's hard to remember any phone/product/service/platform/initiative/merger/startup which was not at some point considered an iPhone killer. A sampling is offered here.

    In reality, the killers seem to have all faded away while the iPhone continues. We could just shake our heads and move on, but a deeper analysis is possible. Take a look at the graph above. Note that iPhone's (and hence Apple's) ascent has not caused decline in its nominal competitors. When seen in the context of the graph above, the success of the iPhone has in fact been complementary to those companies who would be its killers.

    Consider that the iPhone drives a large portion of Google's revenues as it is the home to many Google services and engagement through the iPhone is higher than any other platform, including Google's own. iPhone users tend to make better customers. In exchange Google pays a great deal for traffic acquisition on iOS devices. The placement of search on Safari is probably the biggest single cost item on Google's income statement ((Estimates are a few billion dollars a year.))

    The iPhone example drew Google to build Android as a facsimile and that, coupled with Brobdingnagian spending on marketing, led to Samsung's Galaxy success. That success seems to have peaked and the brand is now a victim of low-end disruptors which copied it and the iPhone in turn. However, Samsung electronics benefits from the iPhone in terms of its semiconductor division. Apple is Samsung's biggest customer and the semiconductor division is now the largest source of operating profits.

    The explosion of Android has led to IP licensing revenues for Microsoft and now Microsoft is extending its software applications to iOS, hoping to participate in the iOS ecosystem rather than competing with it. The time may come when Microsoft shows growth from the iPhone.

    Finally, although it may seem oblique, Amazon is benefiting from the iPhone. Instead of killing it with the Fire ((presumably as a low-end disruption)), the iPhone and iPad offered much more mobile shopping opportunities to the Amazon store. Data shows that iOS leads in shopping traffic and order size precisely at a time when Amazon obtains its largest volumes. Amazon's AWS also handles a great deal of iOS-originated traffic.

    This alternate reality shows that the benefits from the iPhone revolution are broad and deep. It's not just the direct revenues (($25 billion paid so far)) from app sales on the App Store but also the creation of entire new communications modalities (Instagram, Snapchat, WhatsApp) new services (Uber, Airbnb) and the multi-billion dollar accessories markets. These benefits are largely unmeasured and therefore not visible in accounting systems. They are perceivable however.

    Users perceive the value, developers perceive the value and, in the end, the only account that matters, the brand, accrues these perceptions to grow in value.

    As the brand flourishes, the perception of vulnerability dissipates and the narrative shifts from Apple getting killed to killing it.

    It's taken eight years and 500 million loyal users but, perhaps, just perhaps, this change in perception is entering the collective consciousness.


  10. Winning Against Non-consumption

    Research · 17 comments

    In the fourth quarter of 2013, mobile phone sales in mature regions fell due to weaker demand."Mature markets face limited growth potentialis the markets are saturated with smartphone sales, leaving little room for growth with declining feature phone market and a longer replacement cycle," said Anshul Gupta, principal research analyst at Gartner. "Lack of compelling hardware innovation has further exacerbated replacement cycles for high-end smartphones in 2013 because consumers don't find enough reasons to upgrade." - Gartner

    Anshul Gupta's assertion of market saturation was not the first. IDC also cited "a number of mature markets nearing smartphone saturation" in late 2013.

    Shortchanging the smartphone market is nothing new. It was happening very early in the market's formation when initial growth was not as rapid as expected. I recall Nokia managers disappointed with sales growth losing faith in smartphones in 2004.  Eleven years later, the market is still growing.

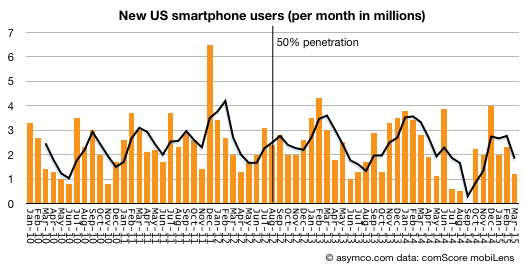
    comScore reported that during the first quarter of 2015 the US market was adding over two million new smartphone users every month. These are not two million units sold every month but two million new users who began using smartphones for the first time ever, every month.

    Screen Shot 2015-05-11 at 5-11-2.33.07 PM


    Since the end of 2013 when both IDC and Gartner declared the onset of saturation in "mature regions" ((The US is the most mature by penetration data)) 31.5 million new-to-smartphones Americans adopted the product. That's an addition of 11% of the sampled market.

    And the sampled market is just a subset of the addressable market. comScore only counts 'primary phones' in use and excludes company-purchased devices and any users below age 13.

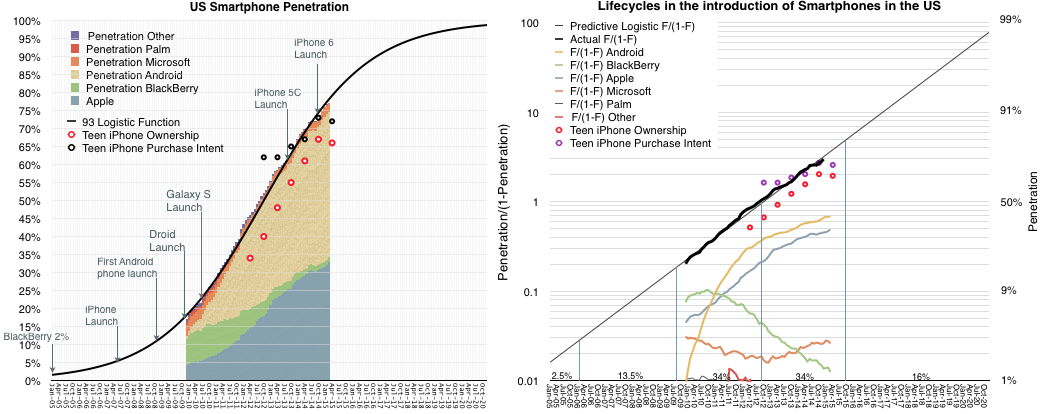
    So according to comScore's data, the US market is at 77% smartphone usage. My assumption is that saturation would come at the earliest at 90% and could be 100%. ((Of the market comScore measures)) The fact that conversion to smartphones is still proceeding at roughly the same rate it has been for five years, makes this assumption pretty safe.

    The pattern of growth fits a diffusion S curve (Logistic curve) as closely as ever: 

    Screen Shot 2015-05-11 at 5-11-2.45.29 PM

    Note that the curve continues to rise even into 2020, and that this is the US only.

    The US is the most highly penetrated market but it's not the biggest. That would be China. So it's not surprising that two years after declaring US growth was over, IDC claims "China's smartphone market has reached saturation".

    Chinese penetration is far below the US. It was estimated at 43% by the end of 2014. If we assume Chinese users are no less hungry for information than US consumers, then why should Chinese stop adopting the technology at less than half of US levels of use?

    That would be risky.

    This understanding of the maximum potential of a market — its highest level of user adoption — is crucial for product development. Paying attention to short term sales trends blinds you to the power of the job your product is hired to do. Your product's purpose is not to be sold, but to be hired. If your product is powerful enough, it can be hired for universal jobs and it should be desired by all consumers, not just the fickle.

    Being patient for growth means that you can release features when the majority of users can absorb them, not just when early adopters choose to play with them. Often, early adopters offer feedback which is off-putting to later, mainstream adopters. In engineering and design one has to always make compromises. The right balance at the right time avoids overshooting a market or under-performing against competitors.

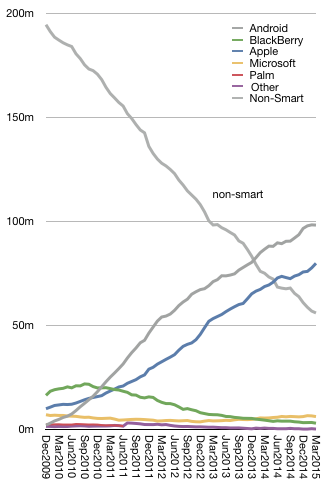
    There are plenty of examples of getting it wrong (see the graph on the right above).

    At this stage in the US market, the iPhone has more than 80 million (sampled) users.  Android has about 100 million. It's still a growing market so apart from BlackBerry, ((Three million BlackBerry users in the US remain.)) the churn between the smartphone platforms is still minimal. The two main platforms are still harvesting non-consumers.

    Screen Shot 2015-05-11 at 5-11-3.18.07 PM

    This will change of course. And when it does, the competition will shift from winning against non-consumption to winning against other-consumption or over-consumption. That post-saturation competition will be decided by brand loyalty as much as anything else.

    ---

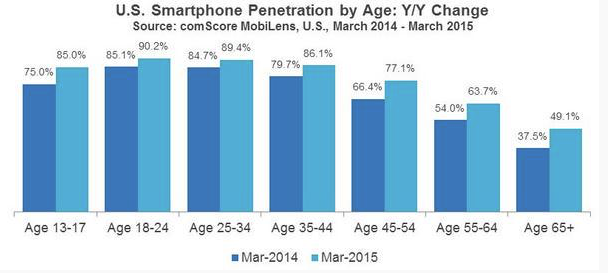
    Update: comScore just published US Smartphone penetration by Age which offers some clues where smartphone hiring is still going on.  (Note: <13 ages are not shown).

    Screen Shot 2015-05-11 at 5-11-4.18.27 PM