Asymco

Asymmetric Intelligence

revenue

  1. Surprise

    Research · 46 comments

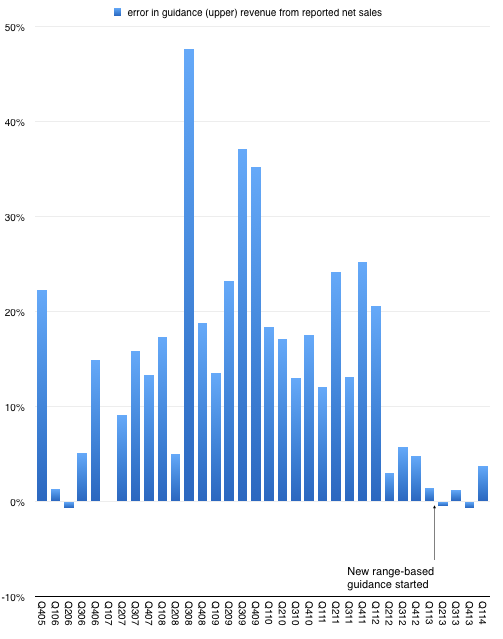
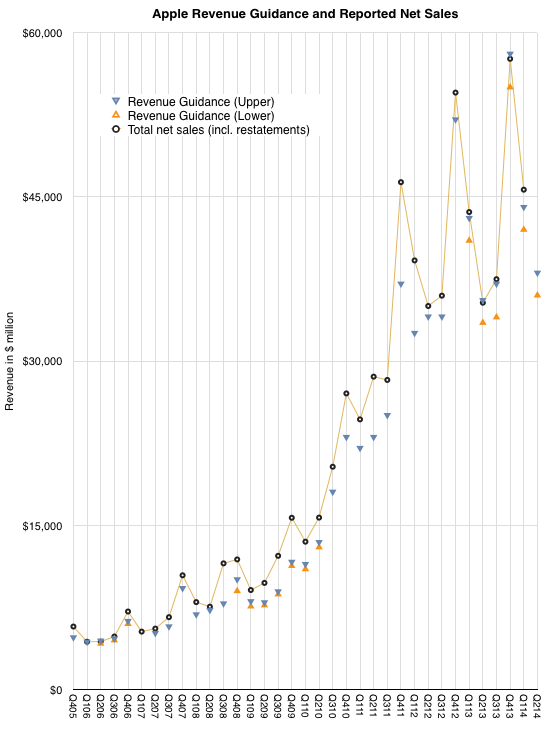
    After n quarters of predictability, Apple surprised with sales performance that was 3.74% above the top of their guidance. This may not seem significant but since instituting a new range-bound guidance method in Q1 of last year the company reported revenue within about 1% of the top of the range.

    This is in stark contrast to the wide variance in prior years. The following graph shows the "error" in guidance as the percent difference between reported sales and guidance ((Upper end of range in quarters where a range was given.)).
    Screen Shot 2014-04-25 at 4-25-10.18.06 AM

    So prior to last quarter we were lulled into thinking that guidance was very nearly perfectly predicting the company. As I tweeted, it took the "sport" out of trying to do any forecasting. All an analyst had to do is tweak the main product growth figures to hit the sales target and then subtract the (generously provided) operating expenses and (also provided) tax rate to get the earnings. Only unknown to getting to an estimate of EPS was how many shares would still be outstanding. ((The company itself would not know shares outstanding as their buying was opportunistic during the quarter.))

    Knowing Apple also means that average selling prices are also very rigidly set in stone so the degrees of freedom in analysis were becoming highly constrained.

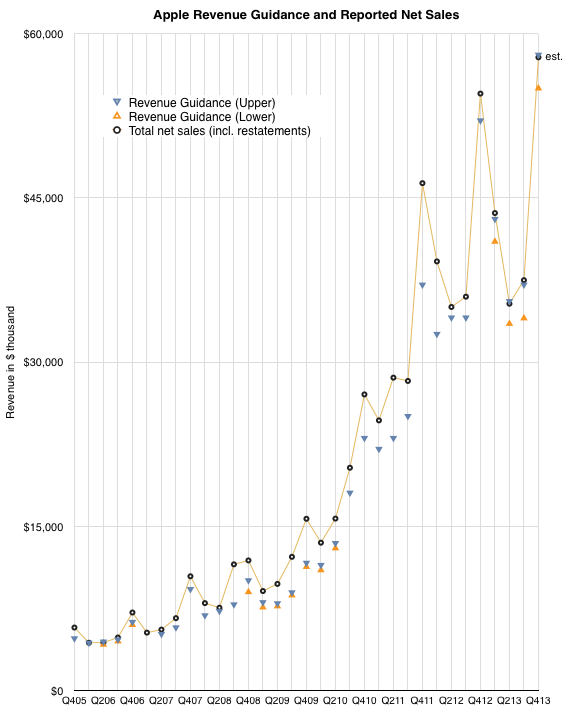
    But just when you think you spotted a pattern, it changes. The company surprised with performance outside the band. The following graph shows the estimate ranges it has given and the actual revenues delivered. ((Next quarter is also pencilled in.))
    Screen Shot 2014-04-25 at 4-25-10.19.24 AM

    So what happened?

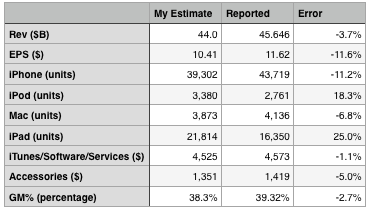
    The answer seems to be better iPhone performance. The following table shows my expectations, which were tuned to return revenues exactly at the top of the guidance range.
    Screen Shot 2014-04-25 at 4-25-10.25.16 AM

    On product shipments/sales I underestimated the iPhone and Mac and overestimated the iPad and iPod. I estimated iTunes accurately and underestimated accessories by 5%. I also generally got the blend of margins fairly close, being 1 point too low on gross margin.

    The bottom line was that the Revenue and Earnings surprise could be accounted for through a significant outperformance on iPhone which offset a less significant underperformance on the iPad.

    The iPhone grew sales by 14% which more than offset a drop of 13% in iPad sales and was enough to allow net sales to grow by 5%. Since the company guided nearly flat growth, that 5% was a big surprise.

    Now one could ask whether 14% growth in the iPhone revenues is a meaningful change in the long-term evolution of the category. This is a difficult question. The way the iPhone is positioned makes it a great success in the premium segment of the market but it does not place it in competition with the perhaps 80% of the market which seems to be defined by a lower price point.

    However let's not forget that pricing is correlative to the market but it may not be causal. Purchase decisions are complex and price is one aspect of that decision. But there are many others. Availability, channels, service, brand all play parts. The error of many analysts is to conclude that price and price alone is causal to behavior. That may be so with commodities, but let us not forget that these products and their uses are newly created and how value is perceived has been changing rapidly. Buyers follow a learning curve in terms of discovering the uses and value of products. These learning curves can be modeled and usually show several years (sometimes decades) for most populations between early and late adoption.

    We don't know where the iPhone is on the learning curve for any particular region and that means we can still be surprised by how it grows.
  2. On the future of Google. Part 2

    Research · 72 comments

    In Part 1 of a look at Google's future I showed that Google's revenues have been highly correlated with the population of Internet users in the markets it serves. If there were a causal relationship between population of users and revenue growth then the company would face a growth inflection point when that population becomes half penetrated.

    In Significant Digits Episode 1 (Part 1) I showed data which suggests that the inflection point will come in 2016. Essentially the argument is that Google's growth is ultimately limited by the population of users and that itself is a predictable number. I also used the example of the PC and smartphone penetration curves to show how the perception of the fortunes of companies whose revenues are based on those technologies were affected by inflections in their respective adoptions.

    However, correlation is not causation. These users we count are not the customers who pay for Google's services. Users (or usage) is therefore only a proxy. It may be a good proxy and intuitively it makes sense that it's a driver of growth but fundamentally the company lives on a stream of revenues paid by advertisers ((This is true to date and certainly it could change but hints of how that might change are still not visible to me)). In order to really evaluate the opportunity we need to "follow the money" and track down where it comes from.

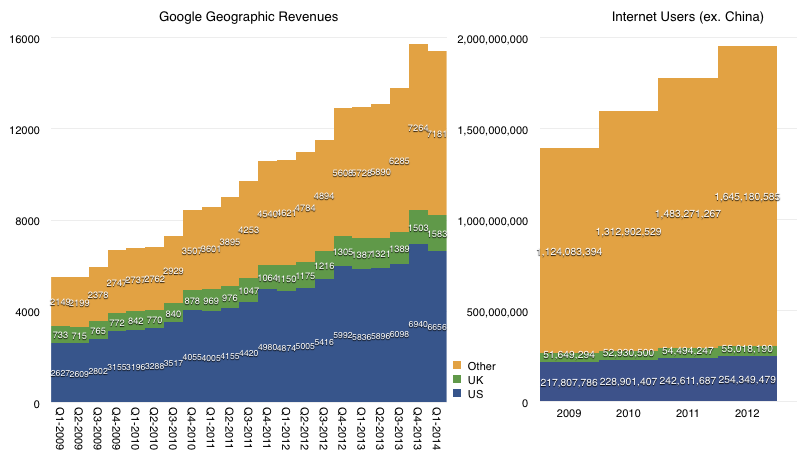
    We don't have visibility into the exact sources of these revenues but we have a top-level geographic segmentation (shown below.)

    Screen Shot 2014-04-17 at 11.15.09 AM

    The data shows that in the most recent quarter 53% of Google's revenues came from the US and UK. Five years ago the proportion was 61%.  Clearly then about 10% of the mix shifted to non US/UK.

    If we exclude China, US and UK, in 2009 there were 1.07 billion Internet consumers. By 2012 there were 1.59 billion users in those same territories. The growth is therefore almost 50%, and this excludes 2013. The corresponding growth in the US/UK was 15%. We should also note that in the same time frame, there were almost a billion Android activations but the number of new users in the US ((as measured in comScore)) was only about 70 million (or 7%).

    It's therefore clear that whereas the population of Internet users and the ways they might access Google exploded in the last five years, Google revenues have come disproportionately from US/UK consumers. Or, at least from US/UK advertisers, which we are assuming are primarily targeting local users.

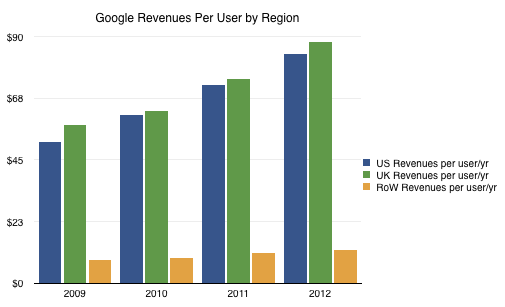
    The result is the following revenue per user per year based on where the users reside:

    Screen Shot 2014-04-18 at 8.28.15 AM

    The disproportionate weight of US/UK income and the low growth of income from rest-of-world vs. the far faster growth of usage outside the US/UK means that the toughest nut for Google to crack is not penetration but emerging market monetization.

    The disparity is enormous. US/UK revenue is on average $86/user/yr (2012) and rising. The rest of the world only manages $12/user/yr. That Rest Of World includes many wealthy countries such as all of Europe and Japan. So the problem for Google is that it has an order of magnitude less income per user in the part of the internet which remains unpenetrated and the trends show that they are not narrowing the gap. ((The ratio between average US/UK and RoW revenue per user/yr was 6 in 2009, 7 in 2010, 7 in 2011 and 7 in 2012))

    Google's R&D efforts seem to be oriented around creating consumption (Making it Rain) but the problem is that the quality of that consumption and the indigenous sources of income are unaddressed. These problems are structural and based on social constructs which don't change at the pace of technology adoption.


  3. On Google's Future. Part 1

    Research · 85 comments

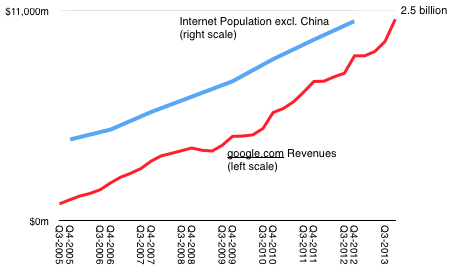
    From 2005 through 2012 Google site revenues ((Google revenues are reported as "Google.com", "Network", "Motorola" and "Other". For this analysis I am including only the Google.com revenues)) have risen at a rate consistent  with the growth in global Internet population excluding China ((Internet population is calculated as a combination of penetration as reported by the ITU and population data from the World Bank)). The Internet population and Google.com revenues for the period 2005-2012 are shown in the following graph.

    Screen Shot 2014-03-13 at 3-13-3.17.02 PM

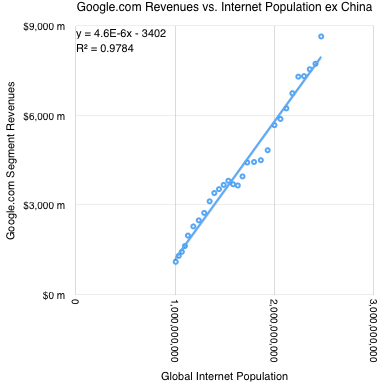
    The correlation is shown in the following graph:

    Screen Shot 2014-03-13 at 3-13-3.17.21 PM

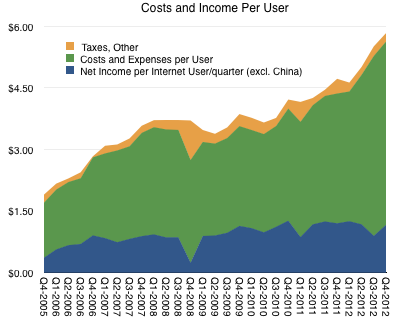
    Taking into account costs and expenses, on a per-user basis profitability per user (assuming all non-Chinese internet users are Google users) is shown below:

    Screen Shot 2014-03-13 at 3-13-3.17.14 PM

    The simple conclusion is that Google earns approximately $1.2 per user per quarter (net income is the blue area above). This figure is relatively constant with a slight increase (~20%) over 3 years.

    If the company does not alter its business model then the future potential of the business could be measured as a function of Internet (ex. China) population growth.

    How hard can that be?

    The next post will answer this question.

  4. Tim Cook's outburst [Updated]

    Research · 64 comments

    When trying to assess the success of an ecosystem, the primary measure is the size of the user base or the "audience" for the product. Companies like FaceBook and WhatsApp and Twitter are measured first and foremost on this metric. Companies like Google, Amazon, Apple and Microsoft are less so. When revenues are firmly attached to products the focus shifts to "follow-the-money" rather than "follow-the-users" metrics.

    That's as it should be, but for the sake of understanding the competition between ecosystems, they should be compared on some similar basis. If the basis of competition in this day and age is ecosystems ((As Microsoft, Apple and Google seem to agree it is.)) how does one evaluate Facebook's vs. Microsoft's? Or, more poignantly, how does one compare WhatsApp's valuation with that of iMessage?

    It's common to value a company which aggregates audiences at a multiple of that audience size. The implication being that each member of the audience returns a certain cash flow to the aggregator and the discounting of those flows is the net present value. Which is why, for example, a newspaper is valued in terms of its subscribers. As is a TV network and as might be a social network. Using this metric, a WhatsApp (i.e. free messaging) user is worth $40 and the average social media user may be worth around $100. ((The degree to which a user is actually worth the sum of all the subscriptions she may have made is a good topic for discussion.))

    The implication is that users/subscribers/audience members are loyal and will stay with the programming for some time. There is also a second implication that businesses which are not measured by audience size don't have this loyal and recurring revenue base. The absence of an "audience" implies transience and impermanence and results in deep discounting of long-term viability.

    Which is why ecosystems are the desired business construct for technology companies. They allow a more consistent and repeatable transaction model and offer predictability which is sorely lacking in the rapidly changing technology industries. It allows a company to define itself on its customers rather than on its products.

    However, old habits die hard. Regardless of the exhortations of product companies, the notion of being valued on audiences is reserved for the service-oriented. Hence the outburst from Tim Cook at the latest shareholder's meeting. Reports have him saying that:

    Apple now has 800 million iOS users and has handled over 16 trillion push notifications, with 40 billion new ones occurring every day. Apple also delivers several billion iMessages and FaceTime requests every day. Cook added that iPad now accounts for 78 percent of all tablets used throughout the enterprise.

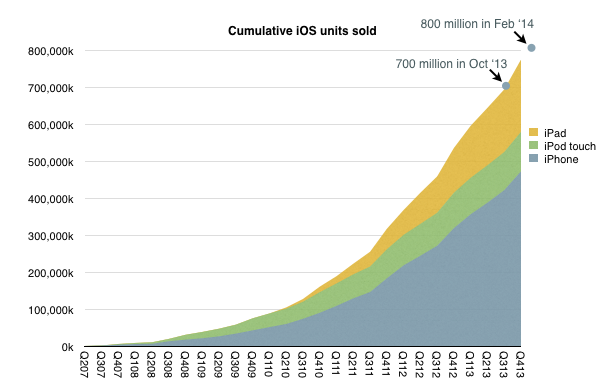
    Trillions of push notifications aside, the claim that Apple has 800 million iOS users seemed way out of line. This is because the number of iOS devices (excluding Apple TVs) shipped through to the end 2013 was exactly 774,336,000. One could easily imagine another 25 million or so since, giving us about 800 million sold, but I cannot see the number in use being the same, and even if they were, the number of users being the same.

    The following graph shows the claim in context of shipments.

    Screen Shot 2014-03-05 at 9.54.13 AM

    Note that last September Cook made the claim that 700 million iOS devices "by October", which did indeed happen. The 800 million claim in February is certainly believable in that context.

    Determining the total number in use is a very speculative exercise. Assuming useful life of 9 quarters for iPhone and iPod and negligible iPad retirements yields about 560 million iOS devices in use. Obviously this can be very inaccurate as also there can be multiple users per device but the claim of 800 million users seems very hard to reconcile.

    Perhaps he was mis-quoted or he mis-spoke but the real question isn't the exact number but rather the implication that Apple should be seen for its users rather than its quarterly shipments.

    Them's fighting words, Mr. Cook.

    [Update: Thanks for Philip Elmer-DeWitt's investigation, Apple clarified that Tim Cook referred to 800 million as the number of iOS devices sold not users of iOS. He was mis-quoted.]

  5. The billion dollar hobby

    Research · 67 comments

    During the latest shareholder meeting Tim Cook revealed that Apple TV sales were above $1 billion in the last fiscal year (ending September 2013). The company later clarified that this figure includes device and content sales.

    This poses a problem. In previous statements the company cited device (unit) shipments rather than value. The statements made to date suggested that cumulative volume of 3rd (current) generation Apple TV totaled 6 million units as of January 1, 2013.

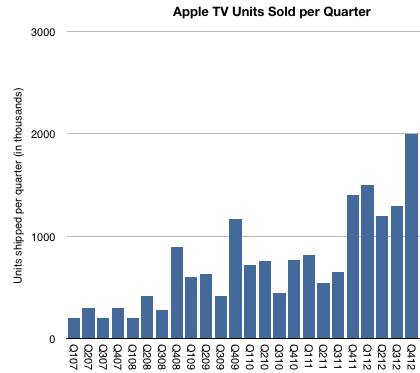
    The following graph includes an estimate of quarterly Apple TV sales based on comments made to date.

    Screen Shot 2014-03-02 at 3-2-8.07.43 PM

    As there were no additional comments during 2013, the "Billion Dollar" quote is all we have to go with for the year.  The problem with trying to separate content from hardware is complicated by several factors:

    • How are we to attach content revenues to Apple TV? For example, what if I purchase a series of shows on iTunes or an iPhone and decide to watch them on my Apple TV. Do these purchases count as being "attached" to Apple TV? Do we attach the full transaction value or do we attach the portion that Apple keeps (as in agency accounting)?
    • How does Apple account for channel placement on Apple TV? Do the channels prominently displayed on its user interface pay for this access (even though the user needs a cable subscription?) Is this the primary source of content revenue that is attributed to Apple TV?
    • What about Netflix, YouTube, etc? What is the content licensing deal with these channels? Does the Netflix channel actually cause an Apple TV purchase or does the Apple TV purchase cause a Netflix subscription?
    • Without content, one might think that the $1 billion revenue would yield total device shipments approximately 10 million units in fiscal 2013 (assuming $99 unit pricing). This is not quite right however as Apple's revenue per unit is unlikely to be $99 unless all units are sold through its own retail stores (including online). Sales through other retailers probably allow for some retailer margin so Apple's average selling price will be below $99.
    • Another question is the fiscal year accounting. We have visibility into the fourth quarter of 2012 (about 2 million units est.) so we only need to fill in the first three calendar quarters of 2013 to understand the Billion Dollar volume.
    • Finally, I already estimate separately the overall video market (in my iTunes Business Report) which, based on historic data and other inferences suggests a total video content gross (contributing to iTunes revenues) of $1.8 billion for the fiscal quarter. If a significant portion (50%) of this were allocated to Apple TV it would imply that the hardware business contracted sharply in 2013. Put another way, if I add what we know about C2012 units (6 million and an ASP of $89) to what I estimate video content revenues to have been in 2012 ($1.6 billion) I get a $2.1 billion business. This would be a "two billion dollar" business in 2012.

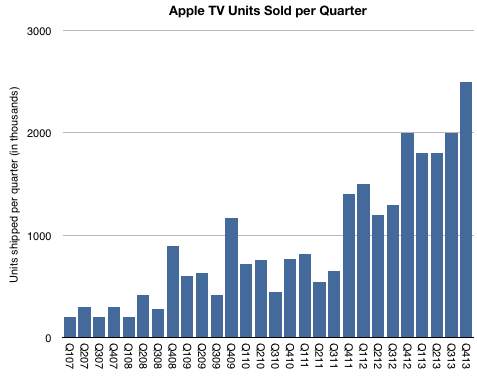
    All this makes the Billion Dollar Hobby a puzzle. The way I can make it square with existing assumptions is by saying that "Apple TV content revenues" are mostly, if not entirely, distribution revenues from channel placement rather than iTunes purchases. ((This revenue will end up in licensing/other revenues in iTunes/Software/Services segment and separate from Apple TV (which is a part of Accessories).))  As a result, my best guess now is that there were about 7.6 million Apple TVs sold in fiscal 2013, with a bit over 8 million for calendar 2013.

    If I'm right, the complete history of the shipments would be similar to this graph:

    Screen Shot 2014-03-02 at 3-2-9.08.24 PM

    By Apple standards this is indeed a modest story. The total units sold would add up to more than 25 million units with healthy growth. But it would not be in the same magnitude as other iOS devices which have so far sold 800 million units.

    More important than this picture however, or the Billion Dollar Business threshold, would be a better understanding of how Apple sees Apple TV as a business. We already knew that it was a low value hardware business. I even suggested that it's "Apple's equivalent of the Kindle": Hardware sold at low margins as a gateway for a high volume content business (iTunes). The problem with that model is that selling other people's content is never a good margin business. If it were to be sustained, Kindle may ultimately have to become an Amazon Prime salesman.

    So that leaves the Apple TV as a product without a satisfactory business model. Unsatisfactory, at least, to Apple's standards; hence the hobby label. But what if the model is turning out to be a platform for discovery of content and therefore the equivalent of (dare I say it?) a portal! ((Exclamation point.)) The TV UI certainly limits search or traditional browsing interaction but it enables eye candy for a few choice placed offers. It is a low interaction model. Think of how the prevailing UI for TV for decades has been that of pressing one button repeatedly, also known as channel surfing.

    If so , the business of Apple TV may be the auctioning of the real estate on the landing page. In some ways this is how iTunes is already behaving by "featuring" exclusive music content.

    There are all sorts of implications, which I will leave as an exercise to the reader.

  6. A margin of error

    Research · 142 comments

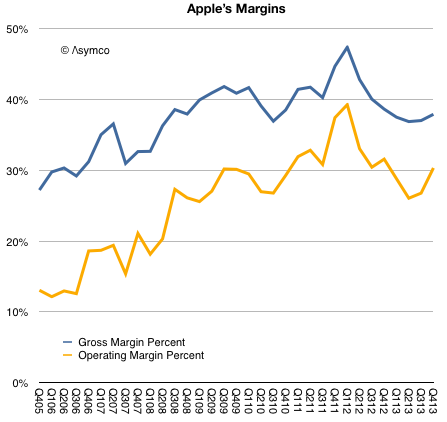
    Prior to Apple's earnings report I read at least one article suggesting that the most important indicator to watch was Apple's margin. I suppose this was due to a recent decline in margins from a peak gross margin of 47.4% in Q1 2012 to 36.7%.

    As the graph below shows, margins began to recover by Q3 2013 and are nearly on par with year-ago levels.

    Screen Shot 2014-02-12 at 10.32.50 AM

    The guidance for the present quarter is a gross margin between 37% and 38%. This would imply a flat q/q GM line (blue line above.)

    This is not quite catastrophic.

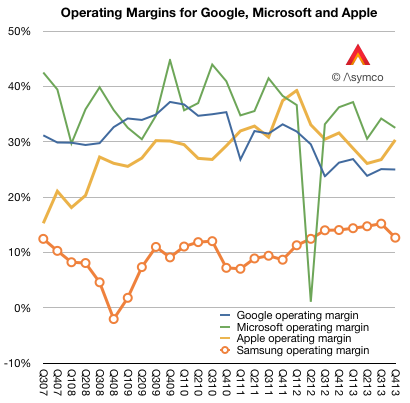
    To better understand margins, it helps to compare them with other companies. When Apple reached that peak of near 50% gross margin I noted that such a level was higher than Microsoft's and Google's. The irony being that Apple was nominally an (implied) low-margin hardware company while Microsoft was an (implied) high-margin software company and Google was an (implied) high-margin internet services company.

    Here is the picture with the last two years added:

    Screen Shot 2014-02-12 at 10.02.17 AM

    In the last two years Apple's margins have declined but so have Google's. And although Microsoft's fell, they fell less than Apple's and thus overtook it to remain slightly more profitable (32.5% vs. 30.3%) into Q4.

    I also added Samsung Electronics' operating margin. ((As a large conglomerate, Samsung will have a lower blended average. Separating the Telecom group's operating profit shows a 16.14% divisional operating margin.))

    So although Apple stabilized, it did so at an extraordinarily high level, well out of band for a hardware company. Thus the question remains: Are Apple's margins a fluke? Is the recent rise of margins to levels far above those of a comparable hardware company and into the realm of software and services sustainable?

    The simple answer is to assume that the iPhone and iPad, which make the bulk of revenues and which explain much of the rise, enjoyed a temporary buzz which allowed them to be priced at a premium but as that buzz wore off, the pricing and margins would decline. This is common with fads and fashions.

    But the situation is far more nuanced. If the margins were due to mere novelty, the effect should not have persisted over so many years. Pricing data shows that the iPhone remains exceptionally valuable and that the iPad, excluding line extensions, has also held the line on pricing.

    The missing piece in the puzzle is that the iPhone and iPad and iPod touch and Apple TV are pieces of an inter-dependent network of assets. The iTunes stores, Apple's services and Apple Retail are easily ignored because they are not "profit centers" but I believe they are a key component to the sustainment of these margins.

    In other words, the iPhone and iPad enjoy margins not just because they are new and well designed. But also because they form part of a ecosystem. The key word is 'system'. The user buys into a system not just what the device embodies.

    This is why I've always said that the iOS product businesses should be thought of as "hardware as a service". The inspiration comes from the notion of "software as a service" which posits the idea that software purchases should be thought of as services and thus recurring revenues.

    iOS devices are part of a service matrix: the user experience in the stores, the after-sales support (including the easily ignored Applecare), the broadband supplied through operator service (which is part of a trillion dollars of value), the apps and content that can be purchased (which add up to a mountain of money), the network effects of iMessage and iCloud and now iRadio and Match and Siri.

    These services attachments are well understood as great business models and underpin some of the most celebrated businesses to emerge in the last decade including Google, Amazon, Facebook, Box, Dropbox, Windows Live, etc.

    It's curious therefore that whereas these other businesses are highly valued as services, in the case when the service is a component within a larger system, the value is missed. In an integrated context the connection between services and high margins is not understood. The reason may be the absence of robust systems analysis and a preference for the facile explanation.

  7. Fortune 130

    Research · 74 comments

    The increase in net sales of iTunes, Software and Services in the first quarter of 2014 compared to the first quarter of 2013 was due to growth in net sales from the iTunes Store, AppleCare and licensing. The iTunes Store generated a total of $2.4 billion in net sales during the first quarter of 2014 versus $2.1 billion during the first quarter of 2013. Growth in the iTunes Store, which includes the App Store, the Mac App Store and the iBooks Store, was driven by increases in revenue from App sales reflecting continued growth in the installed base of iOS devices and the expansion in the number of third-party iOS Apps available. Net sales of digital content, including music, movies, TV shows and books, from the iTunes Store was relatively flat in the first quarter of 2014 compared to the first quarter of 2013.

    Apple Inc. Form 10-Q.

    During the last quarter Apple changed the pricing for iWork and OS X to zero ((OS X server is still priced at $20 and iWork for previously unlicensed devices and computers is still priced above $0)).

    I estimate the net effect to have been a reduction in revenues from those software titles of about $350 million for the quarter. Nevertheless, increases in services and app revenues means that the iTunes total reported revenues increased to a new record.

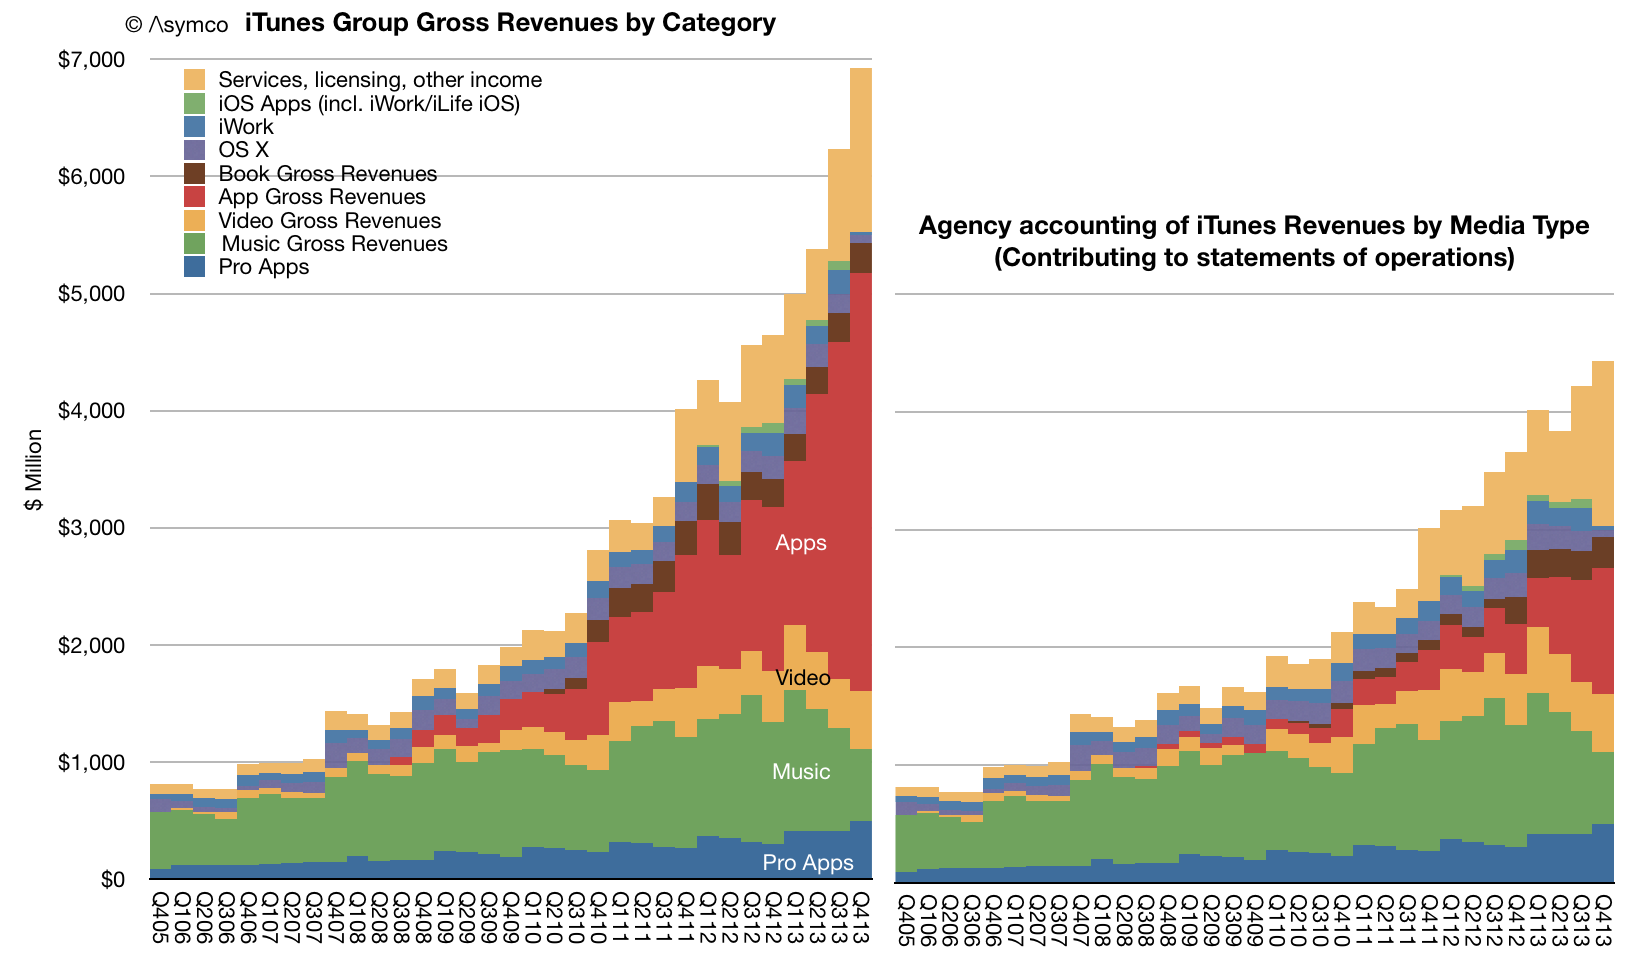
    The total with estimated contributions by media and service components is shown below right.

    Screen Shot 2014-02-10 at 10.05.11 AM

    Note that revenues do not reflect total billings. As Apple reports only the 30% of App transaction values, the full iTunes/Software/Services transaction values are shown in the above graph on the left.

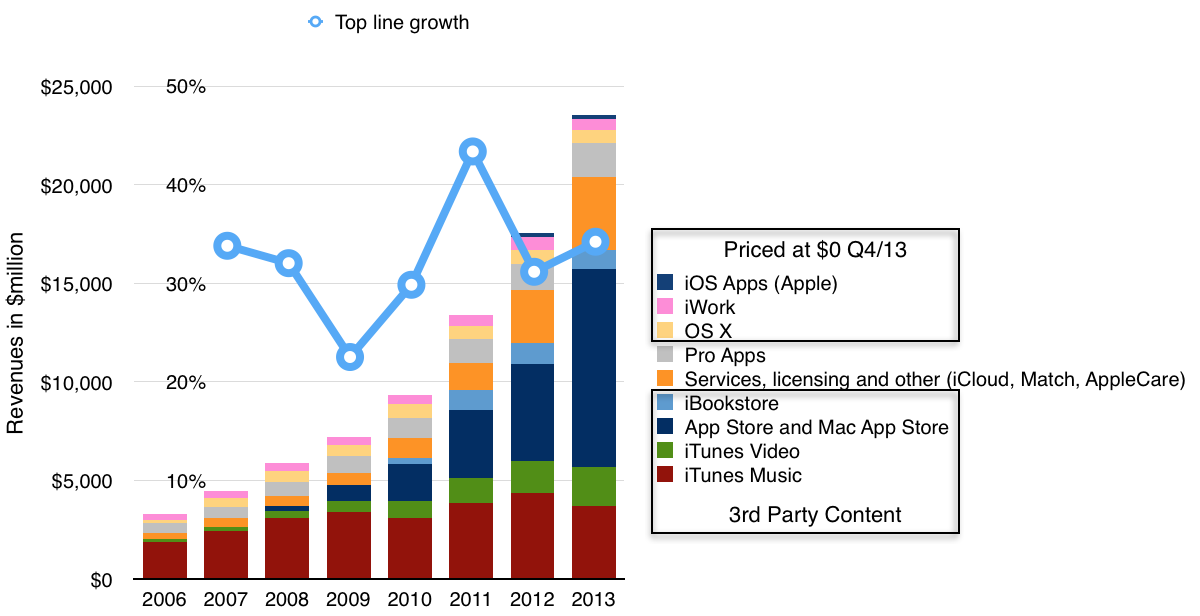
    The "gross" revenues are now nearly $7 billion per quarter. On a yearly basis the iTunes/Software/Services group had gross revenues of $23.5 billion with growth of 34% y/y.

    Screen Shot 2014-02-10 at 10.03.28 AM

    Other estimates for full year 2013 growth are:

    • Third party content +46.6%.
    • Music downloads -14%
    • Video +19%
    • Apps +105%
    • Books -9%
    • Services +37%
    • Pro apps +29%
    • OS X -8%
    • iWork and iLife -8%

    Although iTunes/Software/Services are not usually included in a "sum-of-the-parts" total contributing to Apple's overall enterprise value, the scale of volume and value of transactions is becoming harder to ignore.

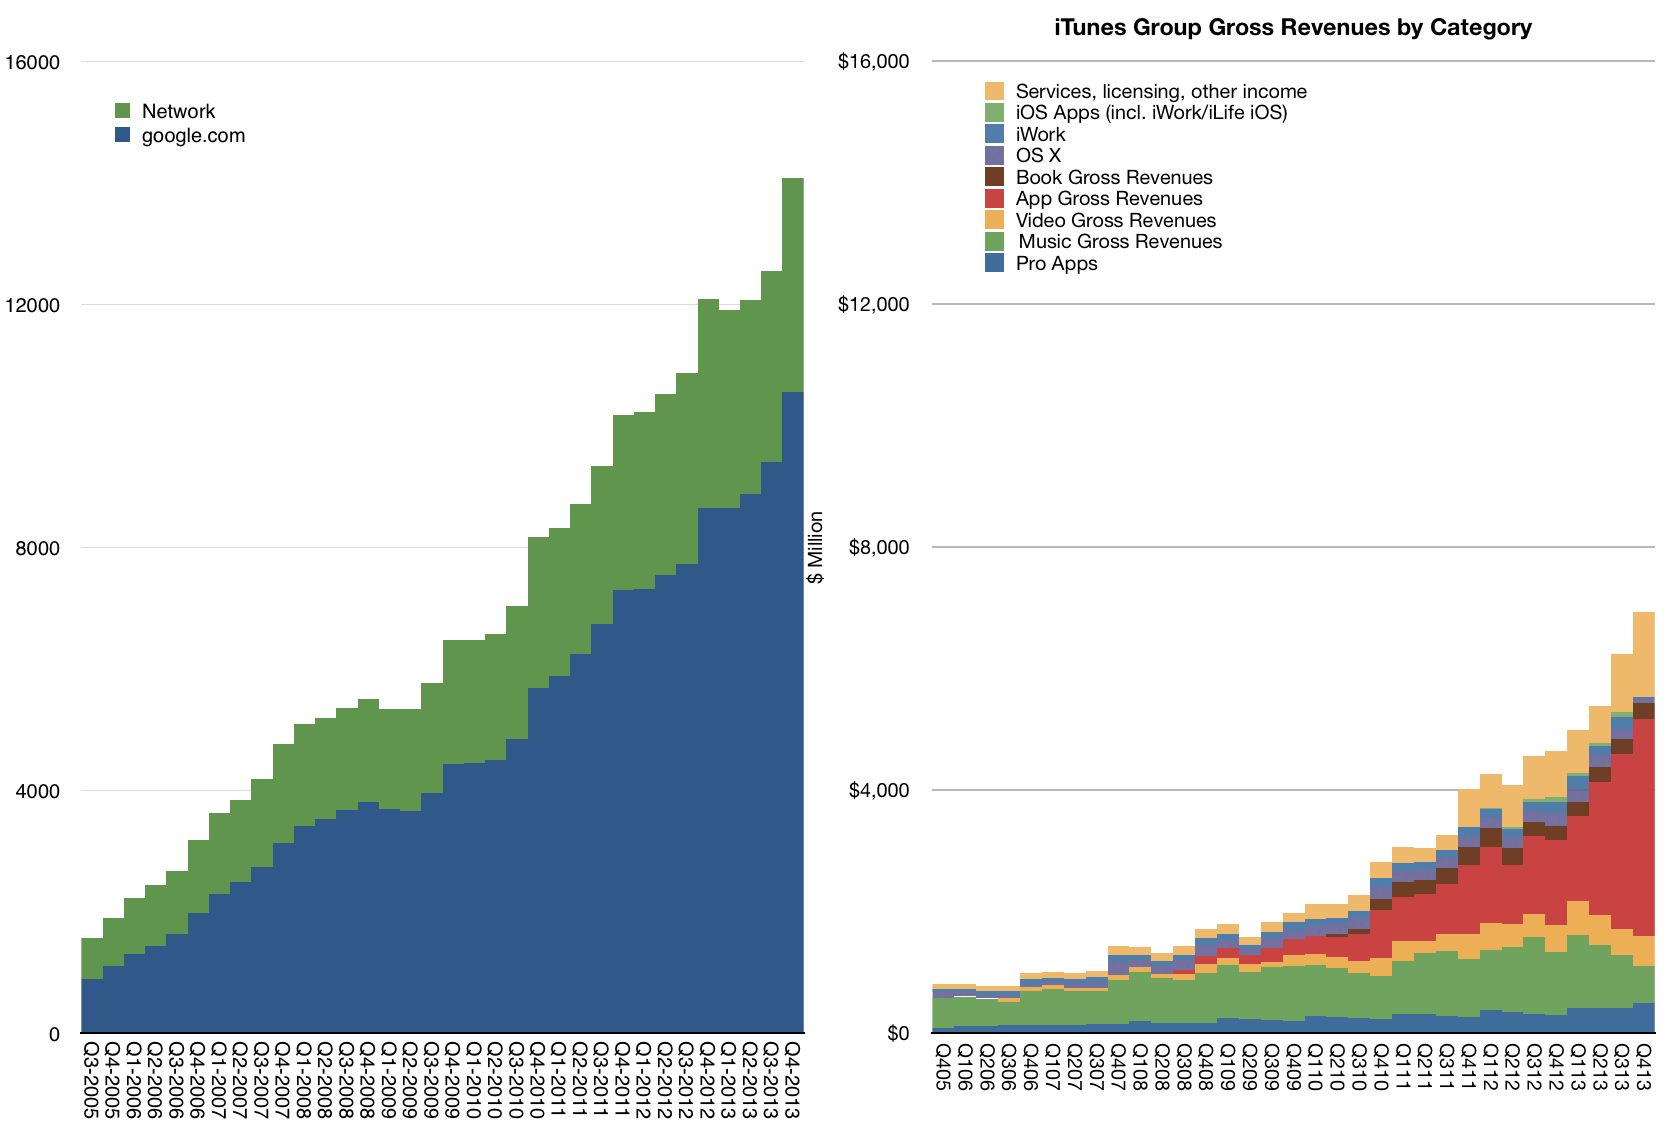
    To illustrate this, I plotted the history of gross iTunes revenues vs. Google's search business ((Excludes Motorola and "Other" segments as reported by Google))

    Screen Shot 2014-02-10 at 10.03.55 AM

    On a yearly basis iTunes/Software/Services is nearly half of Google's core business and growing slightly faster.

    The iTunes "empire" of content and services would be ranked as number 130 in the Fortune 500 ranking of companies (slightly below Alcoa and above Eli Lilly).

  8. Apple's Growth Scorecard

    Research · 89 comments

    Apple revenues grew at the rate of about 6% in Q4, while earnings grew at 5%. These were improvements over Q3 and Q2 but the rate of top line growth is has not been this low since 2009. The bottom line is also slower than it's been for the entire "epoch" or era of the iPhone.

    The components of sales growth are shown in the following table:

    Screen Shot 2014-02-05 at 12.05.10 PM

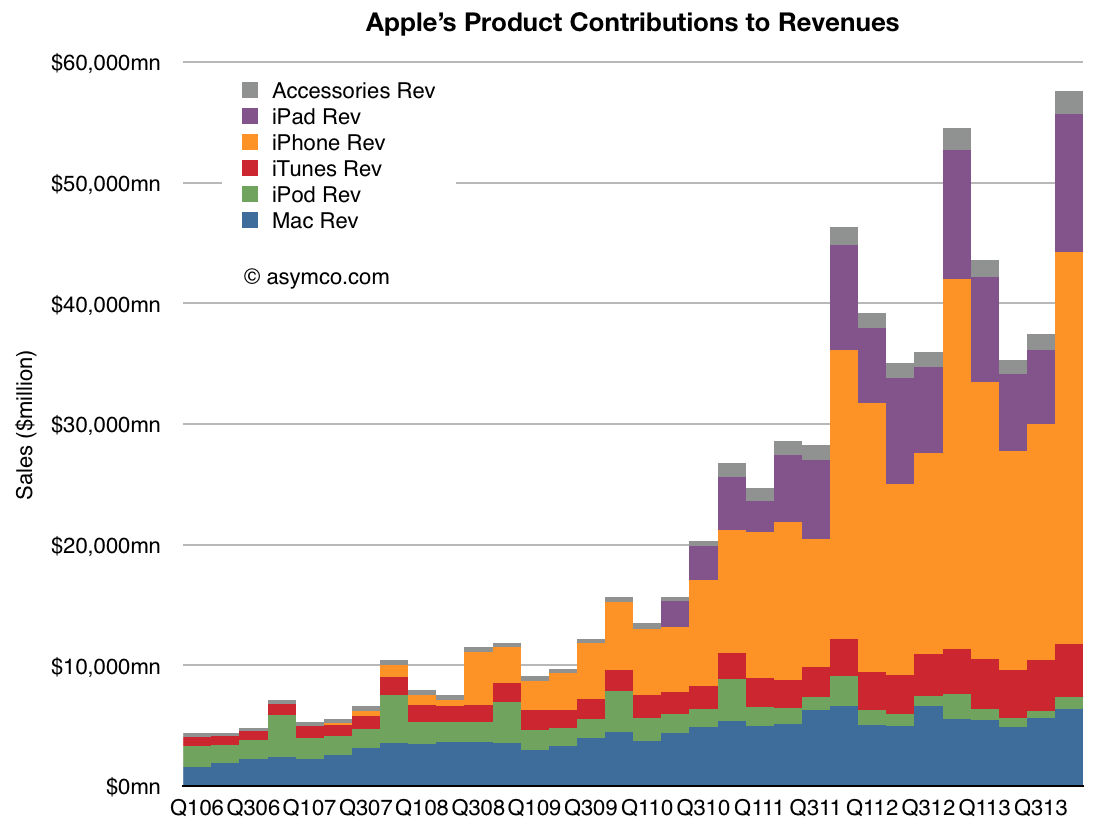
    The company delivered performance inline with its own guidance so there should not have been surprises in the top and bottom lines. However, the disappointment might be in the low growth for iPhone (at 6%) and iPad (at 7%). The Mac and iTunes grew at moderate rates (16% and 19% respectively) while the iPod continued its decline with -55% growth and Accessories remained fairly flat.

    As the graph below shows, the iPhone and iPad are the bulk of the business so their performance is a large part of what is observed.

    Screen Shot 2014-02-05 at 12.31.53 PM

    The speed with which products are introduced and scaled is phenomenal so it is more important than ever to see beyond the trajectory of existing products into the pattern of the introduction of new product categories.

    Markets are effective in anticipating the path of a technology as it ascends into the hands of users, especially if it is destined for ubiquity. But markets are completely incapable of anticipating the emergence of new technologies.

    In this regard markets are a reflection of common sense rather than uncommon wisdom.


  9. Google's three Ps

    Research · 185 comments

    A company is nothing more (and nothing less) than three things: people, processes and purposes. In the language of the software engineer these would be inputs, algorithms and specifications. In the language of classical business analysis they are assets (or resources), organization structures and business models. In military theory, these are logistics, tactics and strategy.

    This is the trinity which allows for an understanding of a complex system: the physical, the operational and the guiding principle. The what, the how and the why.

    When approaching any analysis problem, these questions form the foundation of causal inference. What is it, how does it work and why does it exist?

    When analyzing nature the sciences often help with the what and the how but rarely address the why. ((Religion attempts to answer the whys which science leaves as unanswerable.)) In contrast, man-made systems (e.g. systems of law, religion and commerce) require an answer to the why as there is a presumption of a will in their creation and preservation. The why allows ultimate judgement on the merit of an enterprise. The why may escape us but it's assumed to always be there. For instance, in criminal law the motive is often a crucial piece of evidence but it's not always found. In business, the motive for action or for organization is a crucial piece of the puzzle which often explains the what, who and how, but here the ultimate why is usually profit. This the characteristic of a for-profit business, the purpose is explicit.

    Some companies try to define their purposes beyond profit but they are often too vague or merely speak of values represent a quality not causality.

    This is the case with Google. The problem isn't only that "don't be evil" isn't a priority or a purpose, but also that its resources are not applied to cohesive goals. In fact, there seems to be no interest in pursuing a direction aligned with generating income.

    This is not in itself a bad thing. The notion of operating as a learning (vs. a deliberate) organization, informed but not driven by a goal, is the best approach when seeking new markets or discovering new needs and new business models. The difference with Google is that there seems to be no expectation of business model discovery. In other words, that the learning is not for any purpose other than learning itself.

    This might be noble but learning for its own sake has not been attempted by public, for-profit organizations ((The Bell Labs story in an interesting possible exception but on deeper inspection it was the by-product of a  government sanctioned monopoly and hence a ward of the state)) since there is an implicit fiduciary responsibility to generate profit and unrestricted experimentation, unguided by profit, is unlikely to ever learn the needs of markets.


    The evidence I note supporting this is in the persona the company maintains, both internally and externally. There is no representation of themselves as a "business seeking profit" or even as a commercial entity. It's not simply because their business model is embarrassing. It's because all business models are embarrassing.

    The representation is one of a research laboratory succeeding against difficult problems. Very similar to a successful academic or industrial laboratory sustained by grants from a benevolent (but messy) organization. Google becomes the embodiment of "big science" and "the world's laboratory" unfettered by politics and unsoiled by commercial interests.

    There is a business in Google but it's a very obscure topic. The "business side" of the organization is only mentioned briefly in analyst conference calls and the conversation is not conducted with the same team that faces the public. Even then, analysts who should investigate the link between the business and its persona seem swept away by utopian dreams and look where the company suggests they should be looking (mainly the future.)

    There are almost no discussions of cost structures (e.g. cost of sales, cost of distribution, operations and research), operating models (divisional, functional or otherwise) or of business models. In fact, the company operates only one business model which was an acquisition, reluctantly adopted.

    It's as if the management is not only uninterested in its own profit model but deeply scornful of it. For all the technology innovations the company can claim, it has not had one internally sourced business model innovation.

    But is this wrong? Again, we need to ask if Google breaks with convention then maybe convention needs to be broken. This is the radical bet underlying the Google thesis: are business models necessary? This is in fact a bet many VCs are implicitly placing within the current start-up culture. The notion of making a profit or even having an interest in doing so seems passé. This notion is directly traceable to the Google ethos as it acts as the source of acquisition funding and is driving the agenda of VCs and entrepreneurs. This is leadership by example and the example is one of blissful ignorance of market constraints.

    But we have to go back to the profit model, even if analysts, observers and the company itself sweep it under a rug. The reason is that this laboratory runs only as long as the grant money keeps coming. No bucks, no Buck Rogers. So far the money rains down from heaven, but that rain is not infinite nor permanent. The answer seems to be diversification, even the creation of a conglomerate. In other words, the answer seems to be that if enough great technology is developed or acquired, then a business model will appear (think about it as a probability problem) and the vulnerability of revenue sources is managed. Clever? Convenient? We'll see.

    But that's not the only problem. The deeper problem is in us knowing their intentions. The absence of a purpose rooted in profit makes Google resistant to analysis. There might be a purpose, known only to the founders ((or not known at all)), but it's one that is potentially naive, amoral or too abstract to be useful. Shareholders are aware of this and have agreed to entrust control to only three individuals. The purpose of the organization is in their hands alone and reflects their priorities. Bearing in mind that the road to hell is paved with good intentions, they must be brave indeed.

    This would not be too troubling if the effect would be restricted to the company stakeholders. The trouble lies in that organization also having de-facto control over the online (and hence increasingly offline) lives of more than one billion people. Users, but not customers, of a company whose purpose is undefined. The absence of oversight is one thing, the absence of an understanding of the will of the leadership is quite another. The company becomes an object of faith alone.  Do we believe?

  10. Apple Fourth Quarter Estimates

    Research · 56 comments

    As Philip Elmer-DeWitt is still interested in my estimates I provided the following:

    Revenues ($B) 57.8
    EPS ($) 14 (908m shares)
    iPhone (units) 56.4 million
    iPod (units) 7.6 million
    Mac (units) 4.14 million
    iPad (units) 26.5 million
    iTunes/Software/Services ($) 4.2B
    Accessories ($) 2.2B
    GM% (percentage) 37.1%

    I arrived at these estimates without looking at anyone else's (except for Apple's own published guidance). Soon after sending them I noticed that Daniel Tello published his own.

    In the same format as above, I quote them for comparison. Please visit his post for additional detail.

    Revenues ($B) 59.0
    EPS ($) 14.92 (895m shares)
    iPhone (units) 56 million
    iPod (units) 9 million
    Mac (units) 4.65 million
    iPad (units) 25.5 million
    iTunes/Software/Services ($) 4.3B
    Accessories ($) 1.8B
    GM% (percentage) 37.8%

    The graph below shows the history of revenue guidance vs. revenue reported. The last quarter shows my estimate for net sales.

    Screen Shot 2014-01-15 at 1-15-4.06.58 PM

    Note that the company achieved at or slightly above its upper guidance ever since they started offering a range for guidance (i.e. since Q1 2013). My estimate for sales is therefore very near the top of guidance. The figures for units earnings and margins all result from this assumption.

  11. When Apple reached parity with Windows

    Research · 419 comments

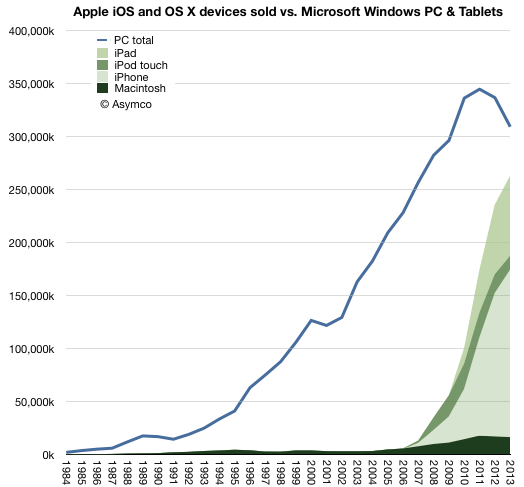
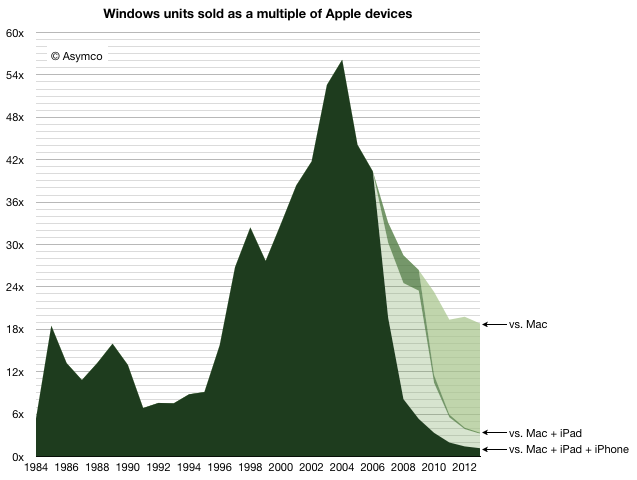
    In 2013 there were 18.8 times more Windows PCs sold than Macs. This is a reduction in the Windows advantage from about 19.8x in 2012. This decline is mostly due to the more rapid decline in Windows PC shipments relative to the more modest decline in Mac unit shipments. Gartner estimates that about 309 million Windows PCs were shipped, ((This figure is not published publicly but can be derived from subtracting Mac shipments from the total PC shipments which are published)) down from 337 million in 2012 (which was down from 344 million in 2011, the year PCs peaked.) I estimate about 16.4 million Macs were shipped in 2013 down from 17 million in 2012.

    The history of PC shipments relative to Mac shipments is shown in the following graph:

    Screen Shot 2014-01-13 at 1-13-3.09.21 PM

    I chose to graph the Mac data as an area with additional areas for iOS devices layered on top.

    When comparing these platforms, the contribution of the Apple mobile platform becomes striking.

    Nevertheless, it's still important to understand the role of the Mac. In years gone, the advantage of Windows was measured in multiples of Mac sales. That peak occurred in 2004 when there were 56 times more PCs sold than Macs. At that moment, when the Windows advantage peaked, the Mac sold 3.2 million units  into a market where 182 million PCs shipped. This means the Mac had 1.7% market share.

    Screen Shot 2014-01-13 at 1-13-3.09.51 PM

    And yet, remarkably, even with 1.7% share, the Mac did not disappear. The figure of 3.2 million units was not great and below the peak to date ((which was 4.5 million in 1996)) but it was enough to sustain Apple while it developed its next products. At the time the iPod was starting to grow rapidly and development on iPhone/iPad was already underway. The point being that there were new products. 3.2 million was a sufficient volume to preserve the company until such time when they would be ready.

    Today the situation is quite different. The total number of platform products Apple sold in 2013 was about 260 million ((This includes my estimates for Q4. We'll have the exact figure in a few days.)) The total number of users Apple has is above 550 million. ((Possibly 600 million.))

    Note the effect in the graph above. Even if we only consider the Mac, the Windows advantage has decreased considerably, and the platform was certainly not extinguished. The new form factor Mac Pro and the continuing improvements in the thinnest of laptops shows how Mac has not just survived but prospered as the underdog which easily captures the bulk of profits.

    But the bigger story is how Apple's mobile platform has nearly reached the sales volume of Windows. In 2013 there were only 1.18 more Windows PCs than Apple devices sold. Odds are that in 2014 they will be at parity. ((The prediction I made in 2012 was that "it’s safe to expect a “parity” of iOS+OS X vs. Windows within one or two years". The data so far does not change this expectation.))

    But will it last?

    It's important to understand just how the quantities involved here have a quality of their own. The quantities themselves speak of a change. It's not convincing to suggest that what comes around goes around and a reversal of fortune can be reversed yet again when there are several zeros added to the end of the figures involved.

    We have to understand that the Windows advantage itself came from the way computing was purchased in the period of its ascent. In the 1980s and 1990s computing platform decisions were made first by companies then by developers and later by individuals who took their cues from what standards were already established. As these decisions created network effects, the cycle repeated and the majority platform strengthened.

    But it was the large companies who made the core decisions. In the 1980s if the Fortune 500 companies all standardized on Windows then their suppliers and customers would also standardize on it. Add governments and other institutions and 80% of the market is probably decided. There was concentration in decision making. In other words, in the 80s a platform could win by convincing 500 individuals who had the authority (as CIOs) to impose through fiat a standard on the centers of gravity of purchasing power.

    Today, with mobile products there are billions of decision makers. 500 decisions mean nothing. In fact, Apple with at least 500 million loyal and wealthy users is considered to be in a precarious situation. That's partly due to the way other platforms like BlackBerry and Symbian found themselves in crisis with tens of millions of users. ((and hundreds, perhaps thousands, of corporate buyers deciding to support its platform exclusively. What IT does matters for little.))

    The decision making process for buying computers, which began with large companies IT departments making decisions with multi-year horizons, has changed to billions of individuals making decisions with no horizons. Companies have become the laggards and individuals the early adopters of technology.

    The fundamental shift is therefore in the quantity of decision makers and the quality of those decisions. Those who buy are also those who use and their decisions will be perhaps whimsical, maybe impulsive and not calculated, but fundamentally, in the aggregate, wise.

    Ultimately, it was the removal of the intermediary between buyer and beneficiary which dissolved Microsoft's power over the purchase decision. It's not just unlikely that this situation will be reversed, it's impossible. Computing decision making has moved to the furthest edge where use has been for decades. The computer has become personal not just in the sense of how it's used but in the sense of how it's owned.