Asymco

Asymmetric Intelligence

revenue

  1. Of bits and big bucks

    Research · 90 comments

    Exactly one year ago, on January 7th, 2013, Apple announced that the App Store reached 40 billion downloads ((Unique downloads excluding re-downloads and updated)). Here are additional data points from that release:

    • 20 billion downloads in 2012
    • 2 billion downloads in December 2012
    • 500 million active iTunes accounts
    • 775,000 apps
    • sold in 155 countries
    • 300,000 native iPad apps
    • over $7 billion in developer payments

    This year, on January 7th, 2014, Apple announced a new set of data points:

    • $10 billion spent on the App Store in 2013
    • $1 billion in December 2013
    • 3 billion app downloads in December 2013
    • 1,000,000 apps
    • sold in 155 countries
    • 500,000 native iPad apps
    • $15 billion in developer payments

    The obvious:

    1. 225,000 apps were added in 2013
    2. 200,000 native iPad apps added in 2013
    3. App download rate for December increased by 50%
    4. No new countries were added in 2013
    5. $8 billion was paid to developers in 2013 (more than in all previous years put together)

    The less obvious:

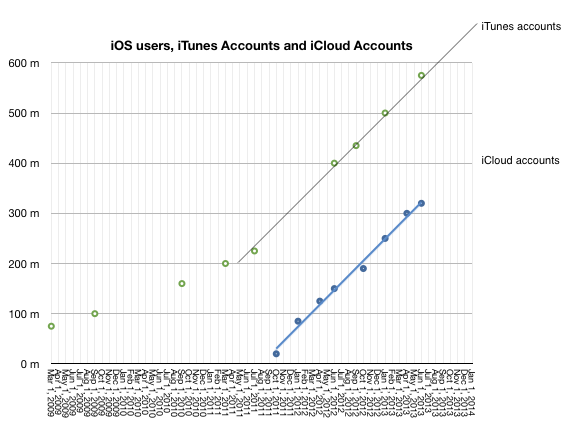
    1.  No update on iTunes accounts this time but there was a mid-year update (June 10th) which put iTunes accounts at 575 million. iTunes accounts have grown linearly since mid 2011 so it's quite probable that the current total is above 650 million. 
    Screen Shot 2014-01-08 at 1-8-9.28.41 AM
    1. Given mid-year updates to earnings/revenue and the October 22nd update that 60 billion total apps were downloaded and the May 15th update that 50 billion total apps were downloaded it's possible to estimate with confidence that there are now 68 billion total apps downloaded and that were about 27 billion app downloads in 2013. This is an increase of 35% in the yearly download rate. As noted above, the December growth alone was 50%.
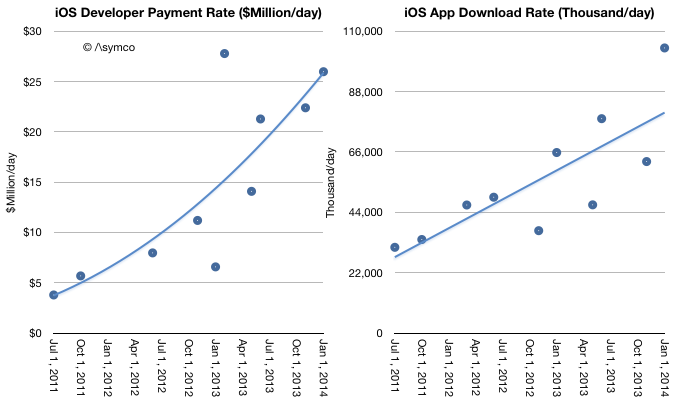
    2. Given mid-year updates on developer payments, and download rates we can estimate revenues per app have increased. As in-app purchasing has taken off it's no longer meaningful to assign a "purchase value" to each download. The rate of payments to developers is increasing faster than the download rate. Currently $26 million is paid out every day while about 100 million apps are downloaded daily. Note that the trend lines below are arbitrary: 
    Screen Shot 2014-01-08 at 1-8-9.41.18 AM
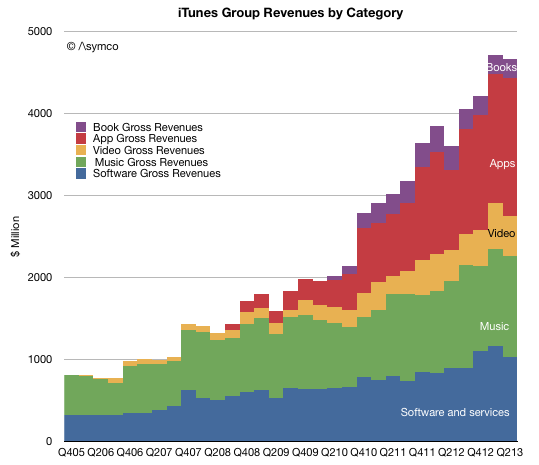
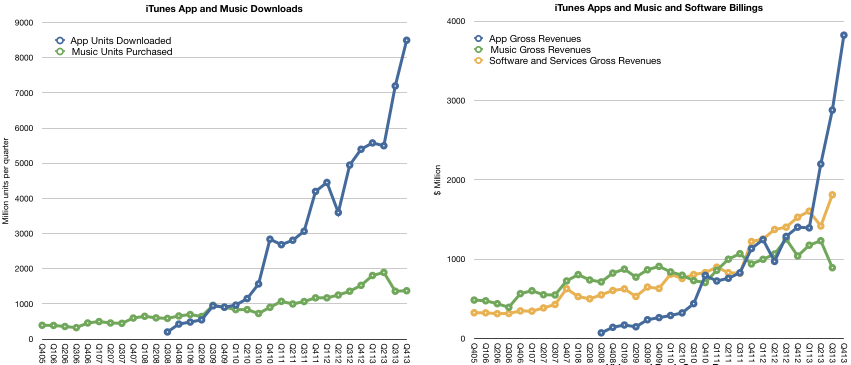
    1. As other reports have noted, there was a decrease in music downloads in 2013. This is also evident when backing into a download total for music given the earnings data and the above evidence of app growth. My estimates below may be overly generous for music unit downloads as they also assume lower pricing. Overall gross music revenues through the iTunes music store ((Excluding new iTunes radio and revenues from services such as Match)) are flat for the year and may even have begun declining precipitously. App revenues are more than compensating for this. 
    Screen Shot 2014-01-08 at 1-8-9.50.37 AM
    1. The iTunes content economy is grossing about $17.5 billion/yr. Apple's own software and services (reported as part of the iTunes segment) add another $6.2 billion/yr. The combined total of $23.7 billion/yr. is slightly lower than what Apple net sales were during its fiscal 2007 year or what Amazon sold in 2009.
    2. A complete report on the iTunes economy and pro-forma iTunes income statement is available for purchase at store.asymco.com.

    So much for the data. What is really happening?

    First, it's tempting to look at music and suggest that music downloads are suffering from streaming, just as it was tempting to suggest that CD buying was suffering from piracy (and later, downloads.) But this is falling into the trap of defining a product's use by the metrics used to measure transactions. These metrics are but a proxy for what consumers are actually doing with their time.

    Consumers have a fixed time budget, a more rigid constraint than their spending budget. Competition for a slice of a consumer's time budget is far tougher than competition for a slice of a consumer's wallet. So what's amazing is that apps have successfully grabbed a share of this time budget. I believe that the reason they succeeded is that they initially fit into niche time slices that were previously unoccupied. ((Interestingly, this was how music, especially digital music as enabled by the iPod, gained traction))

    Downtime or "boredom" was filled with app interaction. This includes some social media consumption. These are not immersive experiences. They are "casual",  inconsequential and trivial. At first anyway. And that's the rub. As apps enter a consumer's world they initially take on non-consumption, which is easy to beat. But as the experiences become increasingly compelling they "move upmarket" and compete more aggressively with existing media consumption patterns.

    For instance, one might allow casual gaming to take root in non-consuming contexts such as commuting, waiting, and escaping time niches. But if the experience becomes addictive, the gaming takes over time previously spent watching TV or using console games. The same can be observed for app-based experiences of social media, shopping and chatting.

    This is the insidious march of a disruptor. It gains a foothold in a context where it has no competition and then relentlessly gets better, eventually displacing the far better suited alternatives. This is what I believe is happening with apps. They are asymmetric in their competition with established media and as a result they are easily ignored and brushed off as irrelevant competition. That is until the incumbent media sees a sudden drop in consumption. Even then, the culprit blamed is not the upstart but some structural issue.

    Music would appear less vulnerable to this app-based substitution because it's an eyes-free experience and can be easily consumed concurrent with another activity. There is however, a subtle de-emphasis and hence devaluation of the experience as it fades into the background. The "job it's hired to do" changes.

    Second, and relatedly, the other meta-observation is that apps are media. They are produced, marketed and priced in ways analogous to other media types. This has implications for the artist/producer/creator. For them movement into apps is natural and effortless. It's how developers moved into them without thinking twice. Trouble is that this transition is not at all simple for those who distribute media.

    I tweeted that the media industry deplored the shift of "digital pennies for analog dollars" ((Original quote was made by Jeff Zucker, president of NBC Universal, in 2008 in reference to the future of TV)) as the packaging of their product changed. The angst and trauma suffered by the media industry when dealing with what could be seen as a trivial change in the encoding of content are the stuff of lore and legend. Moving to apps could be even more troubling. Mainly because there is already a distribution channel in place. And it's owned by a set of companies whose motives and business models are completely different.

    The app economy shows that there are big opportunities in "digital pennies" and that the figures are beginning to match even the "analog dollars". In fact, I suspect eventually digital pennies will dwarf analog dollars. The trouble is that these pennies will not be earned at the same control points. Bits are already big bucks. They're just not the bits we are used to.
     

  2. Dark Matter

    Research · 84 comments

    Benedict Evans explains well the problem with measuring Android tablets. There are no reliable data collected because many of the devices are invisible through the regular, measurable channels:

    • There are no firms which report their shipments
    • They are not sold through retail chains which normally are sampled in the US and Europe (NPD and GfK respectively.)
    • They don't show up in browsing or ad transaction data
    • Google Play statistics are missing most of the activations since they are not sold as bona fide Google-sanctioned Android.

    The only measured statistic happens to be component shipments. Items such as screens, CPUs or perhaps memory might be visible to market analysts. It's therefore tempting to add up tires manufactured to determine what's getting sold in auto dealerships.

    But it's also hugely problematic.

    Before we go into that rat's hole, I want to re-visit my original criticism for market analysis based on device attributes. When the iPad was new it was famously labeled a "media tablet" by Gartner and excluded from being counted (and hence compared) with PCs. This created an implicit signal to the analyst's clients to ignore the entrant as irrelevant.

    That actually accelerated their demise (and the revenue prospects for the analyst).

    In contrast to that exclusion--of a clear and present danger based on an arbitrary definition of form factor--the analyst who defines categories of products purely on the definition of their components is guilty of the same sin.

    Snowing the audience with irrelevant comparisons is just as bad as withholding relevant comparisons. This is explicitly asked of witnesses: to tell the truth, the whole truth and nothing but the truth. The "nothing but the truth" means the exclusion of irrelevance.

    The correct approach is to identify which devices are comparable (and thus in the same category) based on the jobs they're hired to do. If a tablet overlaps considerably in the work it does with a PC (e.g. browsing, email, media play, and other applications) then they should be considered comparable. If a tablet does nothing that a PC does or nothing that an iPad does (e.g. no browsing, email, apps or ecosystem activity other than piracy) then they should not be considered comparable.

    Which brings me back to the question of what these dark matter "Android tablets" actually do.

    To answer I want to recall another "dark matter" technology that seems to have gone largely unnoticed but was exceptionally popular. This was the VCD or Video CD. It was an alternative to the DVD without the licensing and DRM overhead it entailed. It was extremely popular in Asia as a way of not only buying but also sharing video content. The cost of content was a fraction of sanctioned versions, essentially taking the role that mass-copied VHS had in previous years.

    The "job to be done" was to enjoy video content cheaply and conveniently for the equivalent of pennies a day. A job very similar to what we think of as cable TV today.

    These devices and discs were largely invisible mainly because they did not exist in economies which adopted protected DVDs and because the content consumed did not hit against any databases that tracked consumption. Nevertheless there might have been hundreds of millions of these devices sold and billions of discs viewed.

    Now we are in a situation where devices whose primary purpose is to watch video content (cheaply and conveniently) are being counted. By their counting, their implicit competitiveness is asserted. But it means nothing if they are not hired for the same jobs. In fact it misdirects attention.

    Sometimes these "low end" devices do grow up to swamp the higher-powered alternatives with good enough functionality. That is the innovator's dilemma for low end disruption. But in some cases they don't because other factors are at work. Because ecosystems have complex multi-sided markets and because regulations and channels and consumer behavior conflict with the technical specification.

    For this reason the VCD did not "disrupt" DVD or grow up into a Blu-Ray equivalent that caused Hollywood to crumble. It faded away as an anomaly.

    Whether the dark matter Video-only Android device will come to swamp the iPad will depend not on just volume shipments in select geographies. It will depend largely on the ecosystems built around it. The ecosystems of VCD were largely unsustainable because there was no value placed on the content itself. The value chain did not strive to sustain the technology. When something better came along, it got dropped.

    In contrast, content-based value chains sustain technologies which keep the revenues coming. And we can measure this revenue.

    You don't need to look too hard for that in tablets. Apple states it quite frequently: total payments to developers.

  3. What's an Active User worth?

    Research · 86 comments

    Apple has sold 700 million iOS devices. Google claims one billion Android device activations. Microsoft has about 1.5 billion Windows users and Facebook about 1.19 billion. LinkedIn has 259 million users and Twitter has 232 million. Amazon has 215 active account holders and PayPal 137 million.

    Markets place a value on these users implicitly when company shares are priced. For example, Twitter whose users are worth about $110 or FaceBook's $98 and LinkedIn at $93.

    This consistency suggests a universally accepted value per social media user but what is the value of an ecosystem user? Apple, Google, Microsoft and even Amazon aspire to enable ecosystems which should be seen are more valuable than mere communities. Ecosystems enable a higher level of economic activity because they are unbounded by the medium itself. Any number of media can be created. Or so the theory goes.

    If we could determine a value for an ecosystem user we could test it against the going value of a social media user. Fortunately we have enough data to do so.

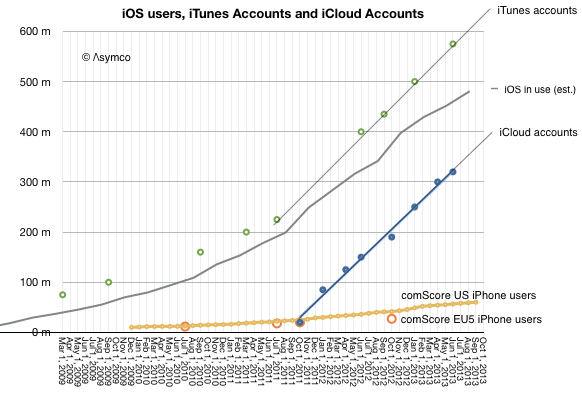
    The total number of iOS devices sold per quarter allows us to measure the install base of device users. With some assumptions regarding the retirement and attrition rate we can get the following history:

    Screen Shot 2013-11-11 at 11-11-11.52.34 AM

    Since the total number of iTunes accounts is updated with some regularity I've added it to the graph. I've also shown on the same graph the total number of iCloud accounts. For calibration, I included survey data showing the number of iPhone users in two regions (US and EU5).

    These combined graphs give us an upper bound of active users (iTunes accounts) and a lower bound (iCloud) calibrating our device-based estimate. The regional iPhone data offers some additional test on growth.

    The result is "about 500 million" ((482 million by my count but with quite a bit of margin of error)) with a growth of about 11 million per month.

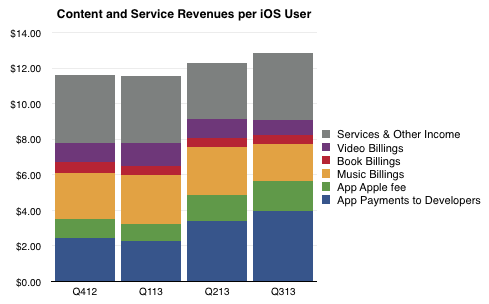
    So if we know with some confidence that there are about 500 million active users as part of the iOS ecosystem, how do we know how much value they generate? The answer is in the consolidated iTunes revenues as reported by Apple: $4.26 billion/quarter. With some attention to the reported media retail and purchases, the following picture of the average iOS user's quarterly spending emerges:

    Screen Shot 2013-11-11 at 11-11-11.50.23 AM

    The bottom line is that in the last 12 months the average iOS user contributed  about $48/yr to the ecosystem via Apple's own properties. They also bought the device and paid for cellular service in most cases. They may also have engaged in quite a bit of browsing and online purchases which fed other ecosystems. But as far as Apple is concerned, it transacted about $48 per user.

    As Twitter revenues last year were $317 million, the Twitter user today generates about $1.36 of revenue per year or one thirty-fifth of what an iOS user generates through iTunes and iCloud alone. And note that the number of iOS users is about twice that of Twitter.

    Of course one could argue that the iOS user's participation is not profitable for Apple. It does obtain massive cash flow from iTunes which finances its fashionable data centers and bandwidth but it does not presume to value itself primarily through this revenue.

    Or at least the market doesn't think so. We don't hear much about how Apple is worth so many dollars per user. ((I suppose the corollary to this is that Apple users are disloyal or fickle or fleeting, and quite contrary to observed behavior.))

    The paradox is that while the device which enables this commerce is where Apple guides the consumer's perception of value, markets discount devices and bid up services. In other words, users continue to pay for the devices which delight them enough to participate in services (especially the monthly billable kind) but markets walk right by these shiny baubles and and shower money on services which have negligible sales and even fewer profits. There must be some serious misdirection going on here. The question is who's being fooled.

  4. How many years does Apple have?

    Research · 167 comments

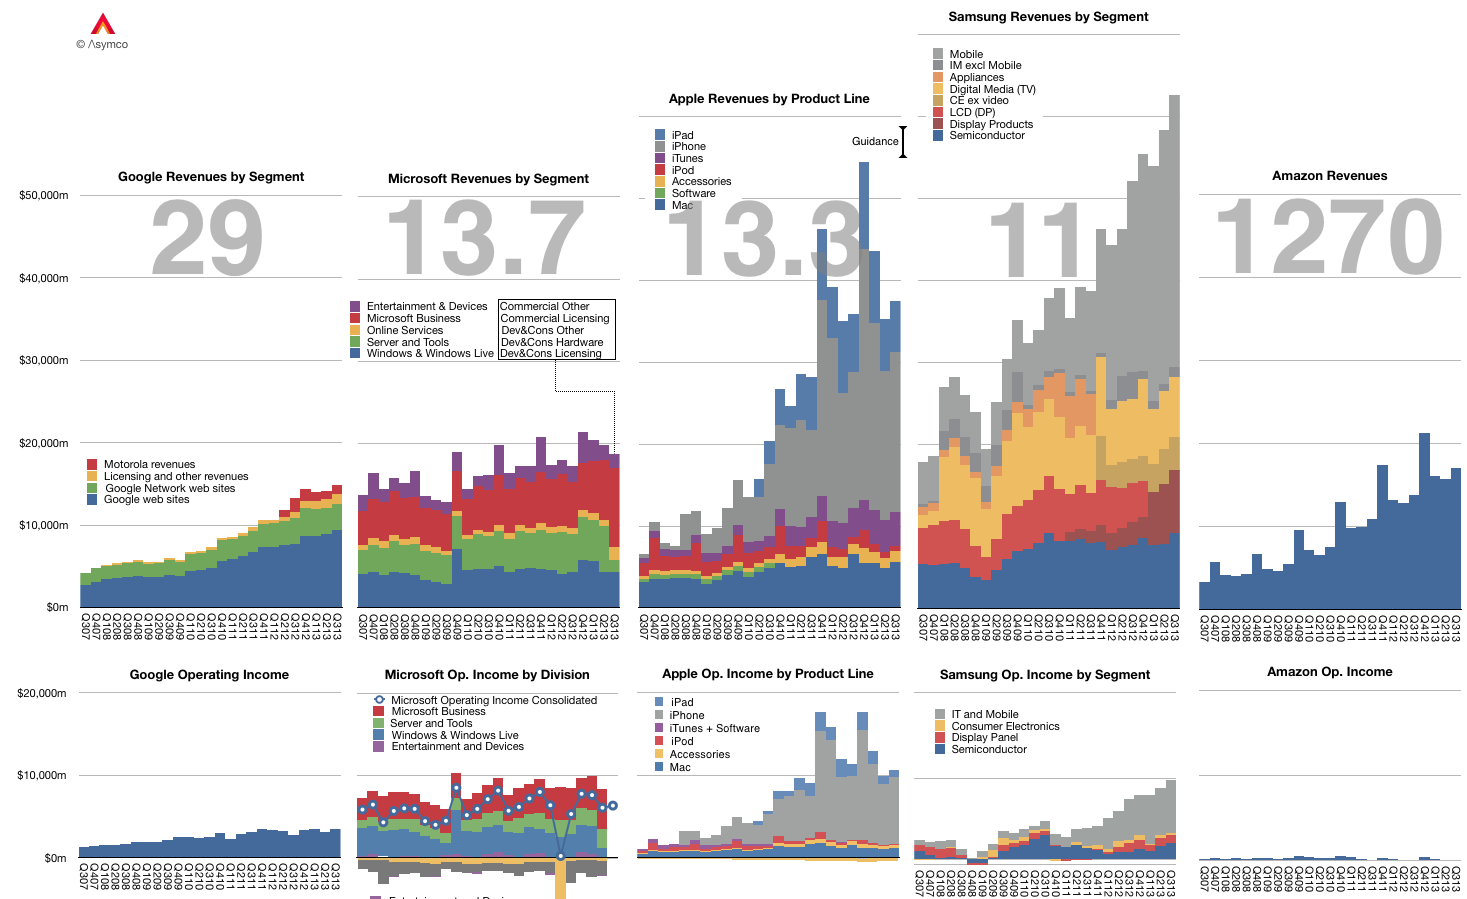
    The graph below shows the Revenue and Operating Income for a select group of companies. The large numbers represent the share price to earnings (trailing twelve months) ratio (P/E or PE ratio).

    Screen Shot 2013-11-06 at 11-6-2.56.25 PM

    Of course the P/E ratio hides a lot of subtlety. It mostly fails to account for the fact that earnings are largely a matter of opinion. A company can defer income (as Apple and Microsoft do), it can invest earnings (as Amazon does) and can otherwise avoid declaring it since it's taxable.

    A better measure is the Enterprise Value to Free Cash Flow ratio (EV/FCF). It reflects a "harder" measure of performance in the form of free cash flow. It is not a matter of opinion but a fact. Enterprise Value also excludes cash which is a measure of past performance.

    Nominally both P/E and EV/FCF measure the valuation of a company. They give what amounts to the number of years that current performance can be expected to last. For example a P/E or EV/FCF of 10 can be read as "If I purchase a share today, I should expect the company to pay me back in earnings in 10 years." Any earnings after 10 years are essentially "profit" for the investor.

    Inverted these ratios are a measure of Yield or how much of the total investment is paid back in a given year. In the example above, the Yield would be 10% or "If I purchase a share today, the company will pay me back 10% a year in earnings."

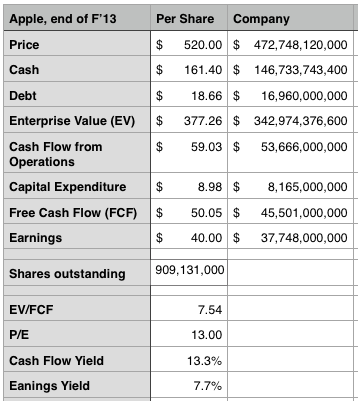
    Relying on P/E is troublesome since, as mentioned above, it's deceptive. We get into difficulty when P/E and EV/FCF differ greatly. If a company has minimal cash and declares all free cash flow as earnings then the ratios are the same. However, consider how different these two ratios are for Apple:

    Screen Shot 2013-11-06 at 11-6-3.11.50 PM

    The P/E ratio is 13 while the EV/FCF is 7.5. ((It would be very interesting to have both ratios available for all the companies in the graph above.))

    This means the investment horizon is nearly half of what P/E suggests. (The cash flow yield should give pause). Put another way, the market suggests that Apple has 7 more years of current profitability and not 13. Note that the P/E ratio for the S&P 500 is above 19.

    As Apple's deferrals are increasing investors should look again at what the company's worth. We had similar confusion when the company was deferring most of its iPhone revenue.

  5. Do ads work? The ad budgets of various companies

    Research · 59 comments

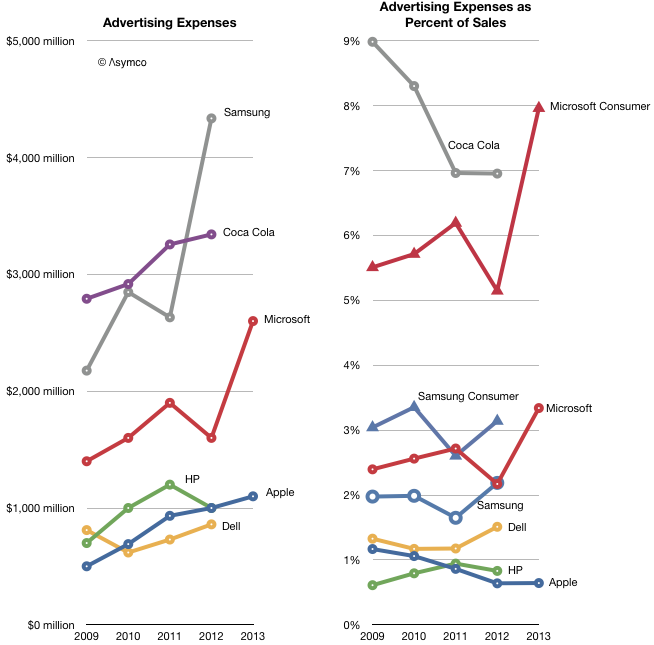
    Microsoft spent $2.6 billion for Advertising in the fiscal year ended June. Apple spent $1.1 billion in its fiscal year ended October.

    Other companies will report their full year ad spending later but their previous years' spending is shown below.

    Screen Shot 2013-11-04 at 11-4-4.55.03 PM

    I added a second graph showing the percent of sales that each ad budget represents. Note that Coca Cola retains the crown as the most prolific advertiser when it comes to budgeting. ((Think of it as 7 percent of every Coke purchase going to pay for the ad that presumably got you to buy it.))

    However, Microsoft is climbing into a region of 3 to 5% of sales. What's even more striking is that we can isolate the revenues which are actually being targeted by the ads: consumers. Microsoft's Business and Server and Tools divisions may have some ad budget but it's likely to be much smaller than the Windows, Entertainment and Online divisions.

    When the ad budget is measured as a percent of consumer sales, Microsoft suddenly looks like the biggest spender overtaking even Coca-Cola. ((Note that Samsung can also be similarly split into consumer vs. total.)) I don't know what to make of this. It seems extraordinary that Microsoft needs the same level of effort to sell software (and some hardware) as Coca Cola does to sell soft drinks. Coca Cola spends heavily to preserve brand value for what is essentially a commodity product. Is this the way to read Microsoft's marketing?

    It's also interesting that Apple spends the least (nearly) in absolute terms and fractionally less (one twelfth) in relative terms. This is in contrast to the alternatives above. The stronger, more differentiated the product, the less it needs to be propped up by the ad.


  6. Owing how much to how few?

    Research · 7 comments

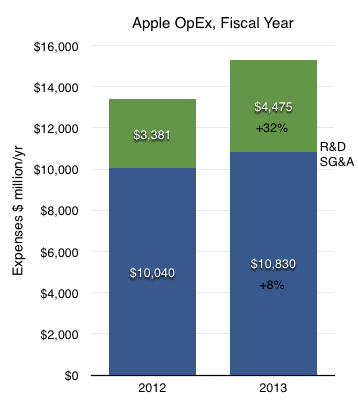
    For the year ending October Apple's R&D costs were $4.475 billion. These costs have been rising. Though, as the company explains, not faster than net sales:

    The growth in R&D expense was driven by an increase in headcount and related expenses to support expanded R&D activities. Although total R&D expense increased 32% and 39% in 2013 and 2012, respectively, it remained fairly consistent as a percentage of net sales.

    [My emphasis]

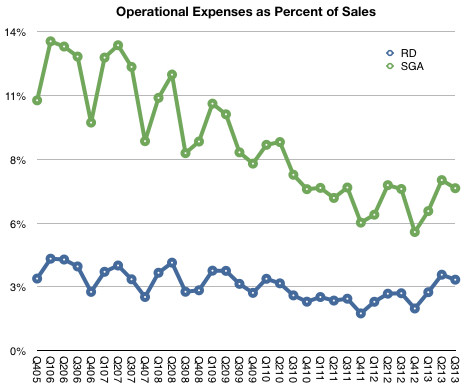
    We can see this in the following graph:

    Screen Shot 2013-11-01 at 11-1-4.37.48 PM

    R&D has remained very nearly 3% of sales since at least 2005.


    SG&A Expenses barely grew however:

    The growth in SG&A during 2013 was primarily due to the Company’s continued expansion of its Retail segment and increased headcount and related expenses, partially offset by decreased spending on professional services.

    The change in R&D and SG&A on a full-year basis is shown below.

    Screen Shot 2013-11-01 at 11-1-4.42.06 PM

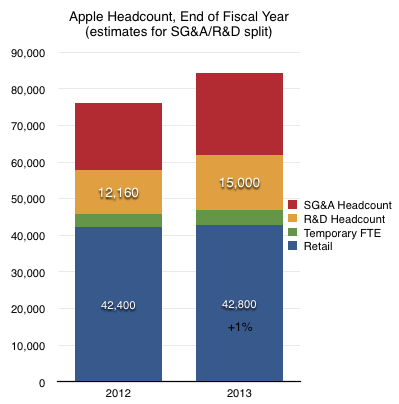
    I emphasized the mention of increases in headcount. We cannot know with any precision what portion of last year's $15 billion in operating expenses went toward wage expenses since there are other costs such as advertising ((Apple's advertising expenditures for fiscal 2013 were $1.1 billion or 10% of SG&A or 0.64% of sales.)) commissions and public relations in the case of SG&A and outside services, equipment leases, in the case of R&D. However, it's more likely that wage expenses are a far larger proportion of total R&D than they are of SG&A.

    My estimate, based on wage rates, is that there are approximately 15,000 R&D staff at Apple.

    Screen Shot 2013-11-01 at 11-1-4.42.49 PM

    If we divide sales by this number we get $11.4 million in sales per engineer.

  7. The newly integrated company

    Research · 25 comments

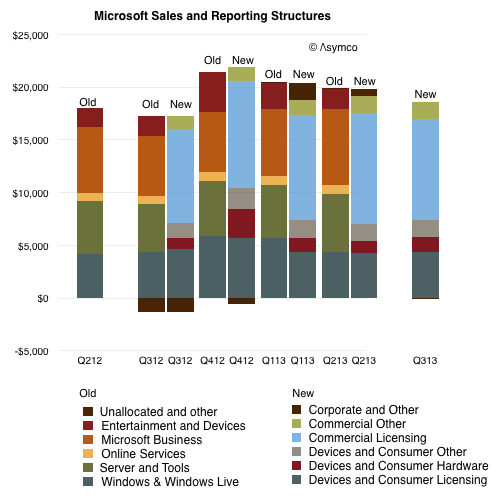
    During the first quarter of fiscal year 2014, we changed our organizational structure as part of our transformation to a devices and services company. As a result of these changes, information that our chief operating decision maker regularly reviews for purposes of allocating resources and assessing performance changed. Therefore, beginning in fiscal year 2014, we are reporting our financial performance based on our new segments; Devices and Consumer (“D&C”) Licensing, D&C Hardware, D&C Other, Commercial Licensing, and Commercial Other.

    The previous reporting segments were:

    • Windows & Windows Live
    • Server and Tools
    • Online Services
    • Microsoft Business
    • Entertainment and Devices
    • Unallocated and other

    The new are:

    • D&C Licensing: Windows OEM licensing, Consumer Windows, Consumer Office, Windows Phone (including related patent licensing)
    • D&C Hardware:  Xbox 360, second-party and third-party video games, and Xbox LIVE subscriptions; Surface; PC accessories
    • D&C Other: Resale, including Windows Store, Xbox LIVE transactions, Windows Phone Marketplace; search advertising; display advertising; Subscriptions including Office 365 Home Premium; Studios including first-party video games; retail stores.
    • Commercial Licensing: Windows Server, Microsoft SQL Server, Visual Studio, System Center; Windows Embedded; volume licensing of Windows; Microsoft Office for business (Office, Exchange, SharePoint, and Lync); Client Access Licenses;  Dynamics, Skype.
    • Commercial Other: Enterprise Services, including Premier product support services and Microsoft Consulting Services; Cloud Services, comprising O365, other Microsoft Office online offerings, Dynamics CRM Online, and Windows Azure.

    From Microsoft's FY14 Q1 10Q via Microsoft Investor Relations - Press Releases

    The mapping between the old and new is not straight forward. There is overlap between D&C Licensing and the old Windows and perhaps between Entertainment and Devices and D&C Hardware but there are many gaps. There is also some overlap between the old "Business"/"Server" segments and the new "Commercial" but, again, they cannot be matched.

    I show the difference between the two structures in the way revenues are allocated below, using color to try to show similarities.

    Screen Shot 2013-10-25 at 10-25-11.25.07 AM

    Given the re-stated quarters it's possible to compare one year's historic performance at a segment level. For example, the company states that "Devices and Consumer revenue grew 4% to $7.46 billion" while "Commercial revenue grew 10% to $11.20 billion".

    Since we don't have data older than one year, our ability to assess the company over longer time periods will be drastically reduced and a new picture will take a long time to emerge.

    There is however one aspect of the new structure that needs to be appreciated right away: the allocation of costs has changed fundamentally. The company explains:

    Cost of revenue is directly charged to the D&C Hardware segment. For the remaining segments, cost of revenue is directly charged in most cases and allocated in certain cases, generally using a relative revenue methodology.

    We do not allocate operating expenses to our segments. Rather, we allocate them to our two segment groups, Devices and Consumer and Commercial. Due to the integrated structure of our business, allocations of expenses are made in certain cases to incent[sic] cross-collaboration among our segment groups so that a segment group is not solely burdened by the cost of a mutually beneficial activity as we seek to deliver seamless experiences across devices, whether on premise or in the cloud.

    [my emphasis]

    In that brief paragraph Microsoft has formally and in a financially binding way declared itself to being a functional organization. ((Welcome to the club.))

    The mechanism seems banal: operating costs are no longer assigned to product divisions but to two large buckets. In practice this means that profitability (P/L) cannot be assessed or assigned to individual managers. The lack of P/L responsibility means that incentives from top to bottom have to be re-engineered. If this goes wrong, the Assets ((read: people)) of the company could evaporate.

    If the assets go, then processes and priorities are for naught.

    In other words, what the company is undertaking is a priority shift (to a  functional structure to create integrated experiences) which requires a process change (whereby employees work according to new incentives) while preserving the fragile assets the company depends on (a motivated and skilled base of employees.)

    This makeover is as ambitious as a re-org gets and the context, scope and target are as difficult as they can be. This is, after all, the largest software company operating the the most dynamic industry whose multi-sided markets are notoriously volatile due to disruptive forces.

    The challenge also suggests why Ballmer left and who should replace him. A priority transplant operation requires a different set of skills than those held by the manager who created the processes for the previous set of priorities. That's the manager's dilemma: even if you foresee the changes needed and push for them to be enacted, your reward might be to be replaced by someone who can make the changes happen.

    Those who envision and persuade for change are rarely allowed to enact it.

  8. The value of zero-priced software

    Research · 129 comments

    Apple's latest product launch (new OSX, iPads, Macs and iWork/iLife) came with a change in pricing for software. OS X and iWork and iLife and updates are now made available free on new Macs and, in the case of the suites, on iOS devices as well.

    Recall also that iOS updates are now free as well and that OS X had been reduced in price from about $129 to $29 with Snow Leopard in August 2009 and to $19 with Mountain Lion in July 2012. The iSuites have also dropped in price over time so the pattern of evaporating software prices is long-running.

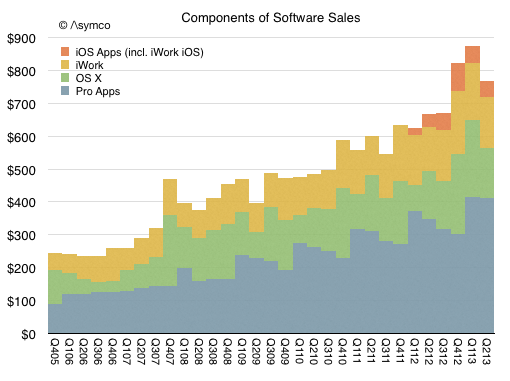
    But how fast and what is the impact? The historic performance Apple's Software business is not easily determined since it was always blended with additional businesses. Until September of last year, Software was reported as part of "Software and Services" and since then as part of "iTunes, Software and Services." Some assumptions allow the following picture to be drawn:

    Screen Shot 2013-10-24 at 10-24-5.07.03 PM

    One additional wrinkle to the Apple software story is that OS X and iWork/iLife are not all the software titles available. Apple's software includes Pro apps as well as the non-free OS X server. The non-free software US prices are:

    • Aperture: $79.99
    • Final Cut Pro: $299.99
    • Motion: $49.99
    • Compressor: $49.99
    • Logic Pro X: $199.99
    • MainStage 3: $29.99
    • OS X Server: $19.99
    • Apple Remote Desktop: $79.99

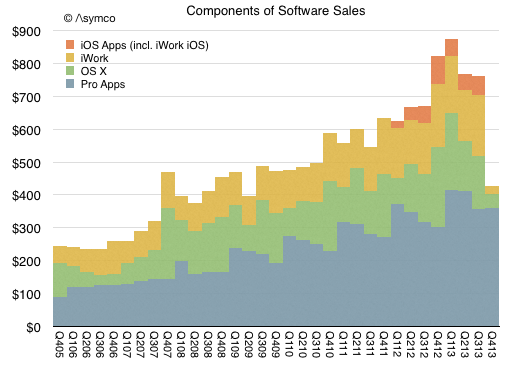
    Given that and additional assumptions can lead to the following picture of the components of Apple's Software sales (in $ million/quarter).

    Screen Shot 2013-10-24 at 10-24-5.08.54 PM

    Given this picture of the software business and the change in pricing, here is my forecast for the third and fourth quarters (in $ million/quarter):

    Screen Shot 2013-10-24 at 10-24-5.21.30 PM

    The foregone revenues could be as much as $450 million from what would have been received with existing pricing model.

    So the question that naturally arises is whether this is "worth it". Whether by offering free software hardware or service revenues rise.

    Perhaps. Certainly service revenue in the form of iCloud might rise with more usage of iWork and iLife. But I don't think that this is the calculus underlying the decision. Remember that Apple does not have a Profit/Loss accountability. It's not necessary (and perhaps not even preferred) that a division balances costs and revenues. ((The graphs in this post (and the preceding 1900 on this blog) were created using Numbers.))

    Fundamentally Apple remains a systems company where software is a key element in its definition of value. That is not changing. What is changing instead is the bundling of application software with the systems software and the system itself. The presence of iWork and hassle-free updating of that suite (and the same for the OS) means that utilization rates will increase.

    I believe the logic for Apple is that usage of the products determines their value and therefore placing powerful software in the hands of more users means they will value the entire system more. This leads to the notion of greater "stickiness" or "lock-in" but also to higher satisfaction and loyalty, rate of upgrades and even more third party purchases and yet more usage.

    This is the virtuous cycle platform custodians seek to engender. This is what Apple is trying to build and the transition of apps into the system bundle is part of this re-enforcement.

    One wonders how long before Apple's approach becomes the norm for other platforms.

  9. Estimating HTC's post-traumatic life expectancy

    Research · 82 comments

    In May 2012 I wrote:

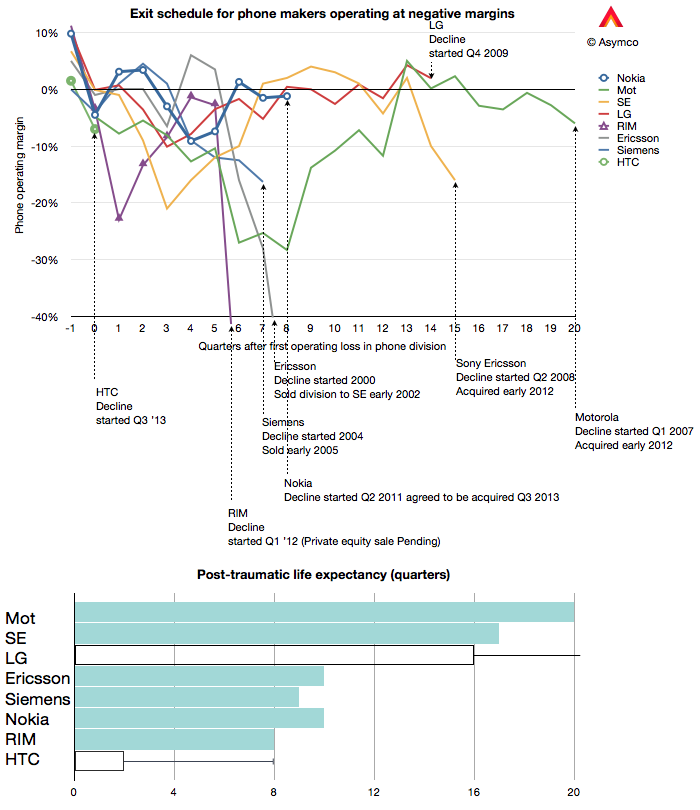
    The pattern may be that companies either have short post-trauma lives of about two to three years or relatively long post-trauma lives lasting 4 to 5 years. What determines this life expectancy and how long do RIM, Nokia and LG have?

    via Post-traumatic life expectancy of phone vendors | asymco.

    These comments came right after BlackBerry (then RIM) announced a loss and thus entered what I called the "post-traumatic" phase of its existence. ((The analysis began earlier, in June 2011)) The observation I have been making is that once a company begins to generate negative operating margins from phone sales, that phone business never recovers.

    The question then becomes one of gauging how long they have before the business is sold, dissolved or merged. Since that update, both Nokia and RIM have tentatively agreed to be sold. If the sales go through then we can update the graphs as follows:

    Screen Shot 2013-10-04 at 10-4-11.01.11 AM

    [Graph note: solid bars in the second graph indicate companies which exited and thus the duration of life post-trauma. Hollow bars indicate the companies have entered post-tramuatic period but have not yet exited. Lines extending from the hollow bars indicate life expectancy henceforth.]

    It turns out that Nokia and RIM did indeed have "two to three years" of life left under the same ownership. Two years to be precise. But as Nokia and RIM change hands (and are thus re-classified in the graph above) HTC enters the schedule. ((Note that there are many companies not listed which also exited. I simply did not have data for Palm, Panasonic, NEC, BenQ, Alcatel, Hitachi, Casio, Fujitsu, Handspring or Danger or many other asian brands which are no longer in this business.))

    HTC has just confirmed that they have lost profitability for the first time since going public in 2002. As the clock begins running the alarm is now set to a much tighter 2 years. The implication being that HTC will change ownership or control no later than mid 2015.

    But there is a post-script to this story. LG, you may note, has not exited phones. In fact, it seems to be recovering nicely. Doesn't that give hope to HTC?

    I don't believe it should. The caveat to this short post-tramuatic life expectancy hypothesis is that it applies mostly to companies which derive the bulk of their sales from phones. Companies which are conglomerates or which can offset losses from phones with cash flows from other businesses tend to live longer.

    This does not mean however that LG's survival is assured. The factors at work in the phone business place continuing stress on the weakened while favoring the strong only temporarily. The dynamics are nothing like those in consumer electronics or in the computer industries. Reversals of fortunes are breathtaking.

    Sic transit gloria mundi.

  10. The figurative sales of iPhones and BlackBerries

    Research · 32 comments

    The most interesting juxtaposition in market data happened this week.

    Apple announced 9 million units of the iPhone 5s/c sold in their opening weekend while BlackBerry recognized 3.7 million smartphones sold in the three months ended August 31.

    I will state these data points with a different emphasis:  while Apple explicitly reported, both in a press release and in an SEC filing, Sales of 9 million units, BlackBerry reported recognition of revenues on 3.7 million units.  At the same time BlackBerry also reported sales to end users of 5.9 million units.

    So, did Apple sell 9 million iPhones in three days? What about units ordered and not delivered? Which of these units will show up in the company's income statement? Conversely, did BlackBerry sell 3.7 million or did it sell 5.9 million smartphones in three months?

    The answer is dependent on what constitutes a sale. I suggest re-reading the Sold and Shipped: A Brief Introduction post from last year. Understanding is complicated by many factors, not least of which could be intentional signaling by management. We may never come to a perfectly matched comparison of the two companies' situations but our job as analysts is to see through the signals and obfuscating language and interpret a pattern. A pattern that extends over a time and helps us learn.

    My observation is one of contrast. The juxtaposition this time is that Apple emphasized sold and not shipped while BlackBerry sold more units to end users than it recognized revenue. These signals reflect precisely the inverted fortunes of the two companies.

    For BlackBerry the higher sold than shipped recognition was due to a product launch failure. Units which were shipped (and recognized as revenue) last quarter did not sell and the company is not only writing off the inventory but has drastically reduced its deliveries of new units in order to drain inventory. The company explains:

    During the second quarter the company recognized hardware revenue on approximately 3.7 million BlackBerry smartphones. Most of the units recognized are BlackBerry 7 devices, in part because certain BlackBerry 10 devices that were shipped in the second quarter of fiscal 2014 will not be recognized until those devices are sold through to end customers. During the quarter, approximately 5.9 million BlackBerry smartphones were sold through to end customers, which included shipments made prior to the second quarter and which reduced the Company's inventory in the channel.

    The company is essentially saying that due to the unusual circumstances of a product launch failure, they will change how they account for their business. They don't have the confidence that units shipped will actually sell and will not recognize them since they fear they will have to write some off. They are signaling: They are being far more conservative, not reporting shipments alone because those shipments could essentially be value free.

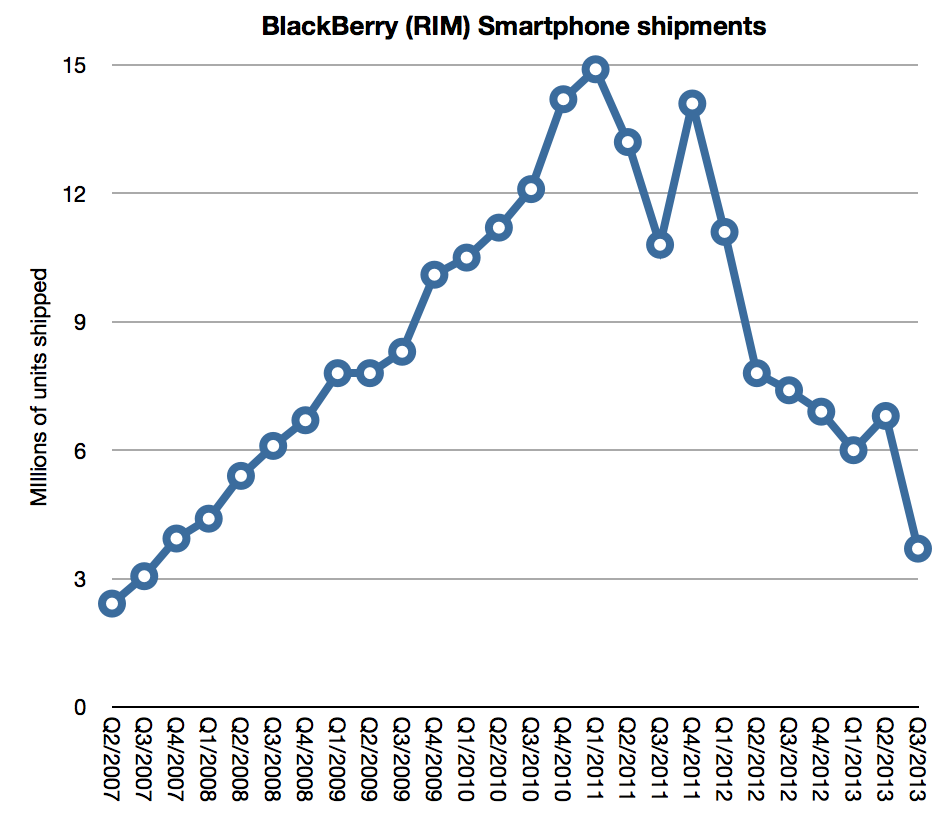
    When seen as a pattern, the new figure on recognized revenue units needs to be shown relative to the history of recognized revenue units.  

    Screen Shot 2013-09-27 at 9-27-9.59.29 AM

    You can see the instability in volume recognition in the graph as a clue. Product launches cause erratic changes in what was previously a seasonally stable business. This is, essentially, the company being thrown onto its back foot. It is staggering from an unexpected blow and resetting expectations.

    Now note the contrast with Apple. Apple provides every quarter shipment data on all its products. This is consistent with generally accepted accounting principles and consistent with reporting from other companies. ((Though many, e.g. Samsung, Google, refrain from reporting shipments any shipment data at all.))

    Apple also offers "channel inventory" data on select products. This inventory data, when coupled with shipment data, offers insight into how many units are actually purchased by end users. If Apple runs a tight ship then its inventory is relatively low but if it has a reliable customer base that of its channel is also low. Moreover, if it can predict sales well then it avoids overfilling the channel and having to take a hit while draining it.

    In that context the way the company reported the 5c/s launch is signaling optimism:

    On September 23, 2013, Apple Inc. […] announced that it has sold over nine million new iPhone 5s and iPhone 5c models, just three days after the launch of the new iPhones on September 20.

    Apple expects total company revenue for the fourth fiscal quarter to be near the high end of the previously provided range of $34 billion to $37 billion, and expects gross margin to be near the high end of the previously provided range of 36% to 37%.

    The SEC filing language above refers to the following press release:

    Apple® today announced it has sold a record-breaking nine million new iPhone® 5s and iPhone 5c models, just three days after the launch of the new iPhones on September 20

    “This is our best iPhone launch yet―more than nine million new iPhones sold―a new record for first weekend sales,” said Tim Cook, Apple’s CEO. “The demand for the new iPhones has been incredible, and while we’ve sold out of our initial supply of iPhone 5s, stores continue to receive new iPhone shipments regularly. We appreciate everyone’s patience and are working hard to build enough new iPhones for everyone.”

    The reporting of sales after a launch weekend has been a staple of Apple's communications about product for a long time. Therefore the evaluation of this performance should be made in comparison with previous launches.

    But it's not necessarily a statement of end user purchases. Nor is it a statement purely of shipments. The term "sold" as used in a press release is not an accounting term and it is not something which is meant to be audited.

    However, none of that matters. The signal is what should be observed. By deliberately and repeatedly using the word "sold" Apple is expressing confidence that demand for its products is strong. Sure, there is channel inventory in that 9 million unit number but there are also ordered devices which have not been shipped and thus are not counted as sales. There are also depleted store shelves and people angry about not getting their desired phone model. Apple knows this, Tim Cook is making it clear they know this. They have excellent visibility into the distribution of their products. They have excellent inventory management. They are typically conservative in their financial reporting.

    So why would anyone interpret Apple's release as a negative signal? If you want an example of a negative signal, look at how BlackBerry reported its launch performance.

    When interpretation of a signal is very different from the literal statement, it says more about the interpreter than about the company.

  11. S is for Service

    Research · 96 comments

    One of the enduring mysteries of the iPhone has been its lack of a portfolio. After six years it seems that Apple has finally acquiesced that there should be one, albeit currently limited to two items. The second enigma is related to the price, namely why does Apple ask so much for its phones? At an average sales price of $600 it's a shocking premium to the average phone, and with a six year run, a shocking resistance to the corrosive effects of competition.

    The obvious answer to why Apple asks so much is because it can. Anybody would if they could. That's a poor question. So the right question should be: why does anybody pay this much? One could answer that few do and it's not a mystery that some feel better paying more simply because they can. But those who pay Apple's prices are, mainly, not consumers. They are operators. Exactly 270 of them.

    So then let's re-ask the question: Why do so many operators pay so much for Apple's phones? We can't answer that with the psychological slurs usually directed at the brand. Surely Operators aren't competing in beauty contests or need to soothe their collective egos. The decisions operators make on whether to range a phone are driven by hard economic realities: ARPU, churn, network costs, depreciation, ROI, etc. Some clearly can't make the iPhone fit their economic models and indeed about two thirds of them don't. But the most prominent ((Arguably the most important)) do. DoCoMo, the largest in Japan just did after holding out for five years. Verizon held out for years, as did T-Mobile. China Mobile's acceptance also seems imminent.

    But that still leaves the question of why are those operators who do carry the iPhone willing to pay so much for it? I only assume that their decision process is likely to be rational. Mainly because we have a large enough sample but also because there is a lot of money at stake requiring quite a bit of internal consensus and vetting before committment. We have to conclude that operators place the orders because they obtain value from the iPhone even when it's priced at a premium to the average alternative.

    The question which follows then is how do they obtain value? I've argued that this follow-the-money process leads one to conclude that the iPhone helps in moving users to higher revenue data services. These are more profitable services for operators and the subsidy model creates more loyalty and thus reduces churn and creates a stable cash flow which can then be leveraged through debt to upgrade networks and attract yet more loyal iPhone users.

    Therefore the iPhone is "a data service salesperson" receiving a large commission (in the form of a price- and hence margin premium) for doing what few others can do. In that sense the iPhone is hired by the operator to do a unique and valuable job and is paid well for doing it.

    This answers the question of why Apple can get away with charging so much for its phone: because operators love it. The entire product depends on a reward system and for years we've heard fears that it's going to end. But it hasn't. Operators love subsidies and they've been honing them for long before the iPhone showed up. ((Recall that the first iPhone was sold without subsidy and with a separate, secret revenue sharing plan. It did not last because it was cumbersome and because operators convinced Steve Jobs that their way was better.))

    But this is not the end of the money trail. The premium is initially paid by the operator but they tend to get most of that payment back from the consumer. In other words the subsidy that inflates the iPhone price is at least partly if not mostly paid by the consumer in the form of a higher phone bill.

    You won't see it itemized on your bill, but it's likely that $10 to $15/month from a subsidized phone service plan goes toward paying for your phone.

    So in a way, Apple has managed to place itself on many people's monthly phone bills. It's a nice place to be. It's nice for the same reasons operators like post-paid customers: predictability. It's also nice because recurring services are a better business model than products; they have higher levels of loyalty and are more "sticky".

    But this placement is not transparent. It smacks of misdirection. The link is not made in the mind of the consumer that they are paying for a phone through their service plan and many see it as a thinly veiled con. The value of the iPhone to the user may be evident through its use but the payment for that value is not.

    But in many ways this is similar to how many services are valued: through bundling. We pay for the value of a great retail experience through a higher price on items purchased. But we still associate that price with the good sold not with the place where it was bought. We get great value from Google's services but don't know how to quantify the cost of their peering into our minds. In fact the whole Internet and all business plans that are built on it depend on a subtle "something for nothing" type of misdirection. The Internet runs on the arbitrage between a consumer service market where everybody consumes but nobody pays and a separate data market where nobody consumes and everybody pays.

    The iPhone could thus be finally understood as a complex service business. It captures value through the phone bill but delivers value through a screen. A misdirection magic trick which many have tried to pull off. It's essentially tapping into the $1.3 trillion communications market, skimming profits by delivering the "content" which lights up the wires.

    It's great except it does not work everywhere. Not yet at least. The complexity of services means that they are usually found in more advanced so-called service economies and rare in less developed so-called goods economies.

    Economists have observed this process and even have a name for it: servitization: The process whereby almost all sufficiently advanced products are indistinguishable from services.

    As a service, the iPhone's strengths are easier to understand. Its weaknesses as well. Services simply don't work in economies which don't have robust institutions of credit, capital intensive infrastructure and distribution networks.

    It's also the reason why Apple is so slow to penetrate all markets. It's not in the business of selling phones. It's in the business of enabling and creating services.