Asymco

Asymmetric Intelligence

revenue

  1. Margin Call

    Research · 97 comments

    During the fourth quarter 2012 Apple's margin fell to about 38%, a level not seen since two years earlier and down from a peak of 47% in Q1 2012. Does this lower margin foretell lower prices or a loss of competitiveness?

    Obviously not.

    Gross margin is a function of Sales (aka revenues) and Cost of Sales. Gross margin as a percent is calculated with the following formula: (Sales-Cost of Sales)/Sales. If dealing with a single product, Sales itself is the product of shipments and price/unit but since cost of sales is also a product of shipments and cost per unit, the shipments numbers cancel each other out and the gross margin reduces to the ratio of (Price-Cost)/Price.

    So a margin drop can only be caused if one of three things happened:

    1. Prices dropped
    2. Costs increased
    3. Both prices dropped and costs increased.

    We can easily find out which of these was the cause in the fourth quarter because we have volumes and prices for all of Apple's products. We can also derive total costs based a total gross margin. These are illustrated in the following retina-friendly diagram.
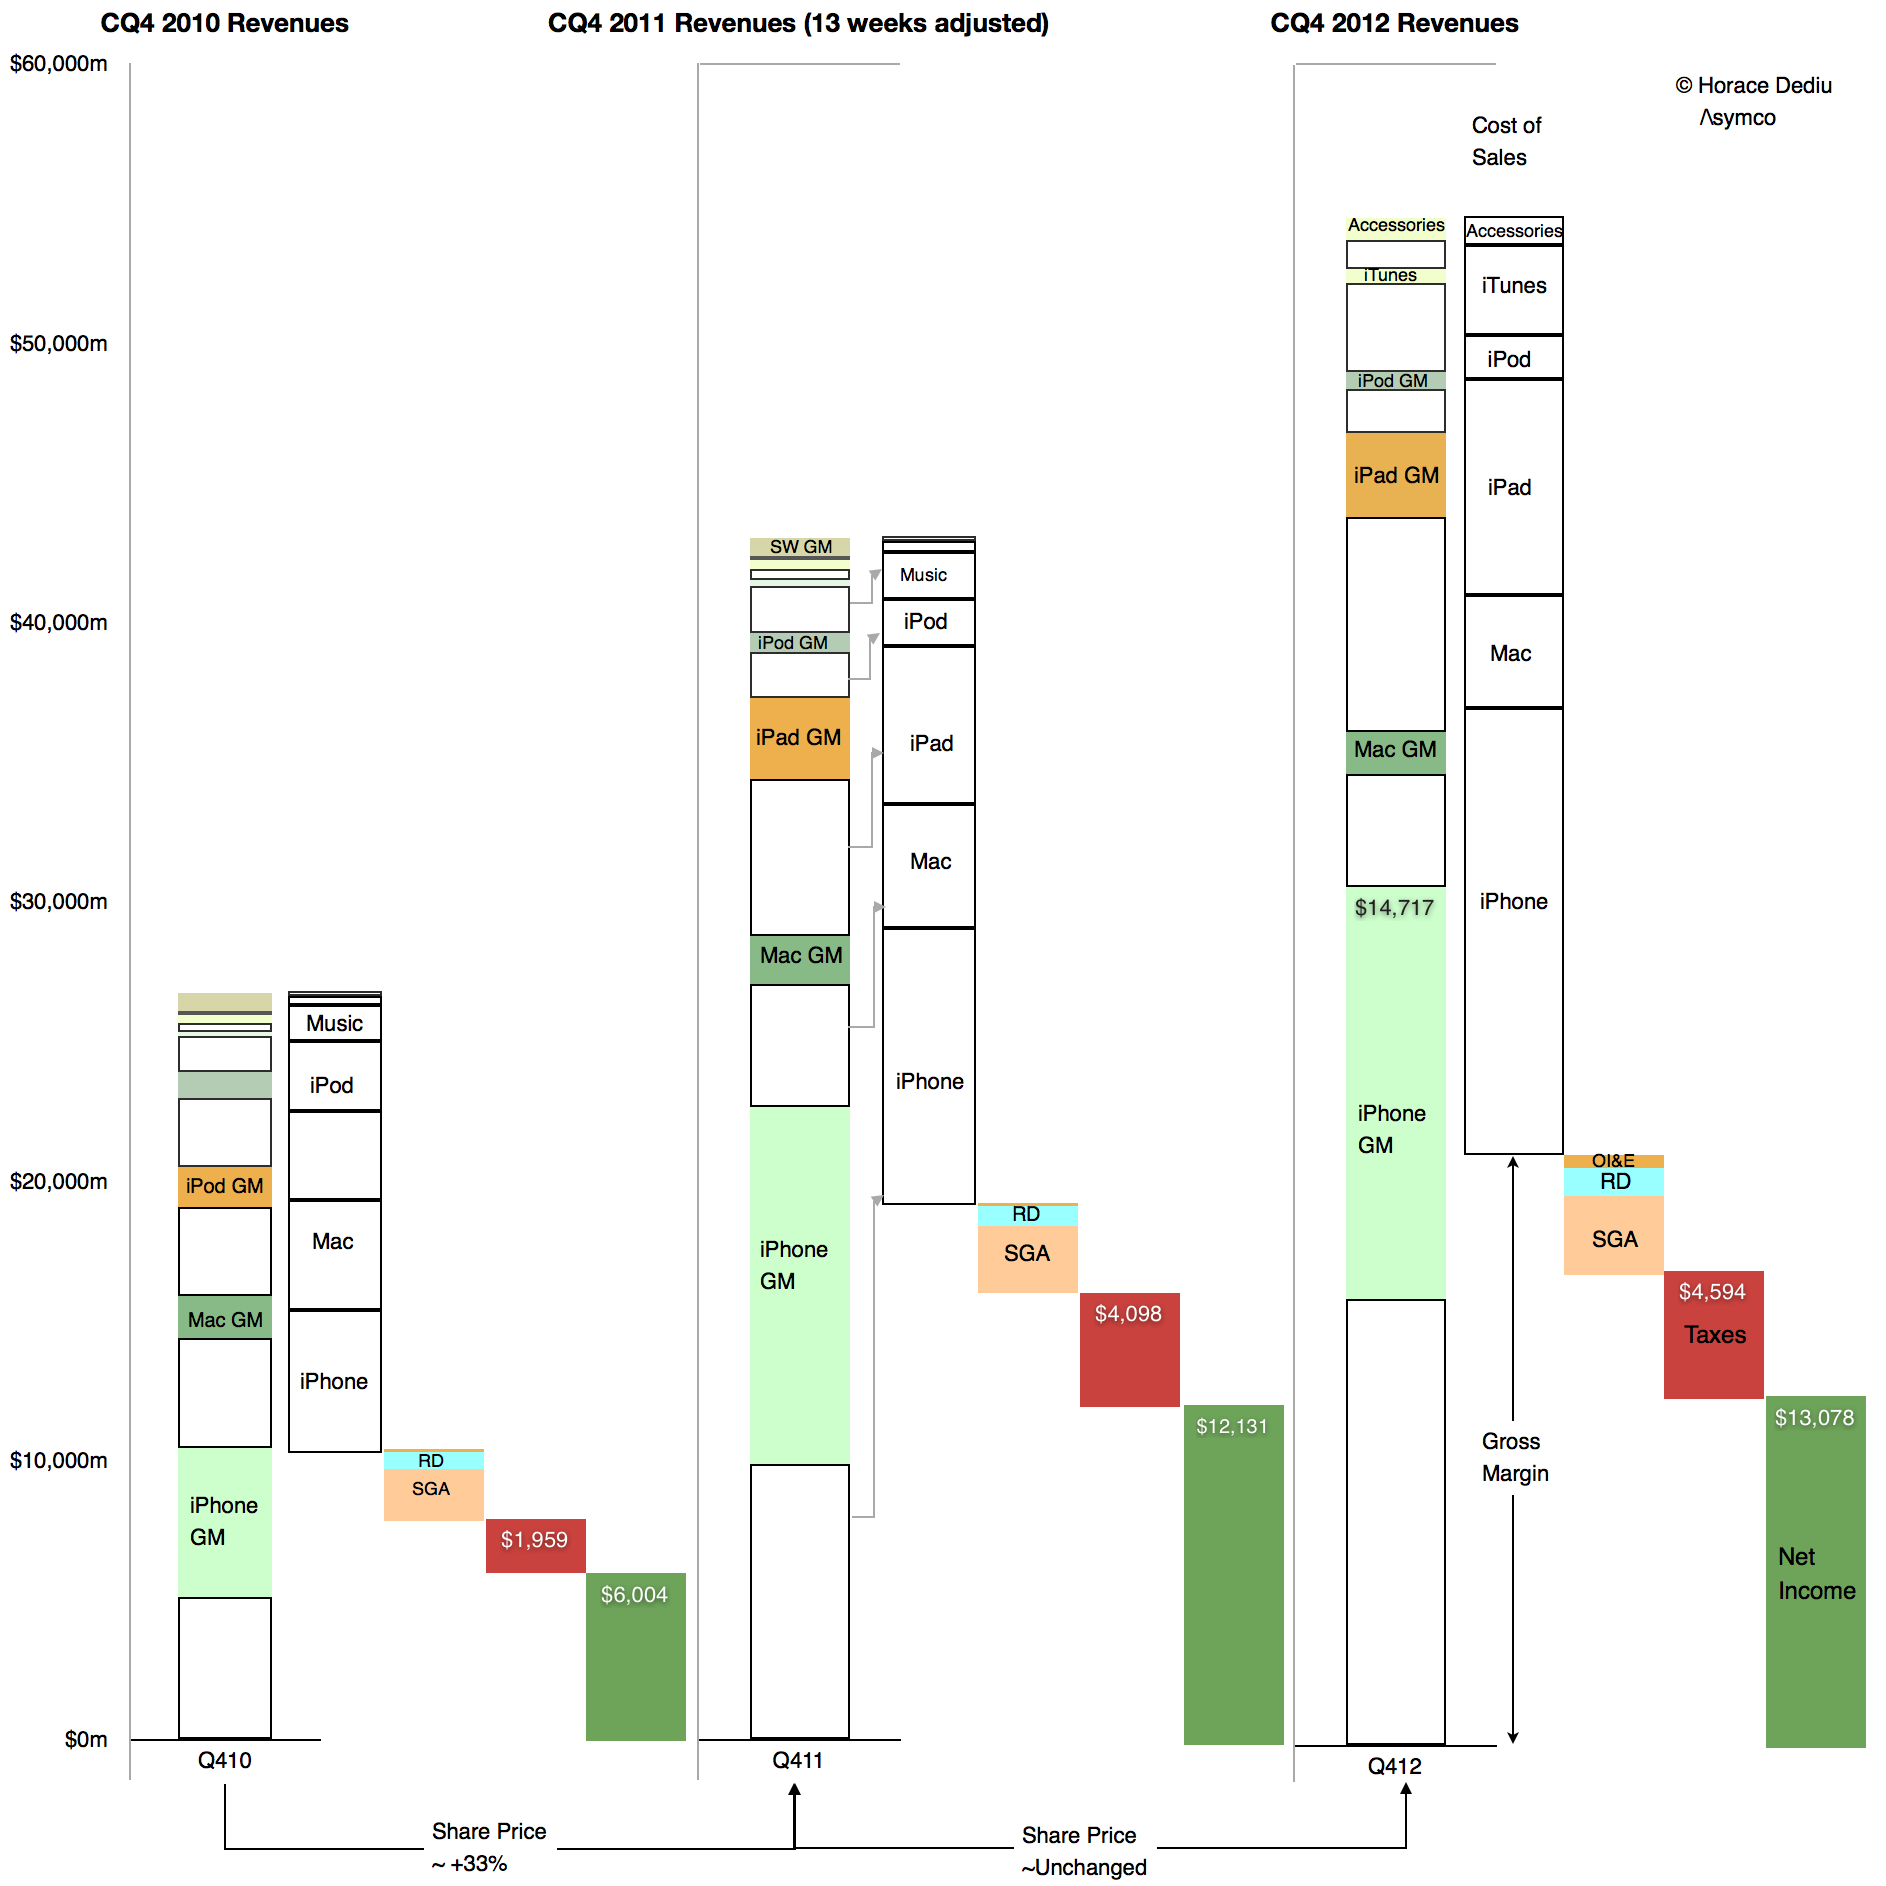
    Screen Shot 2013-02-05 at 2-5-11.25.16 AM

    The diagram shows Revenues, cost of Sales, Operating expenses, Taxes and Net Income relative to each other for the fourth quarters of 2010, 2011 and 2012. Of interest is the difference between 2011 and 2012. Note how the 2012 Gross Margin (absolute, not as a percent, identified with the arrow) did not change much from the year before. As Taxes and Operating Expenses did not change much either, the earnings were quite flat y/y.

    However note also that total sales increased quite a bit. As the gross margin (absolute) remained steady and sales increased the margin as a percent fell. But the cause is that cost of sales also increased. They increased faster than sales increased.

    Relative to adjusted 4th quarter 2011 Sales increased by 27% while Cost of Sales increased by 30.5%. Margins shrank in late 2012 because the products were more expensive to make.

    It's simple arithmetic.

    We can at a glance see that the cost of sales increased as a proportion of sales. Therefore the margin decreased as a percent of sales. The cause is higher costs, not lower pricing.

    In fact, pricing analysis was already performed and showed that they largely held steady (iPad being the only decline). If pricing is unchanged then competitive issues are not to blame. The supposed link between lower margins and some mythical loss of competitiveness can be easily disproved.

    But there's more.

    There is an easily observed cause to changes in production costs. Consider  the opposite effect in the sequential change from the fourth quarter of 2011 to the first quarter of 2012:
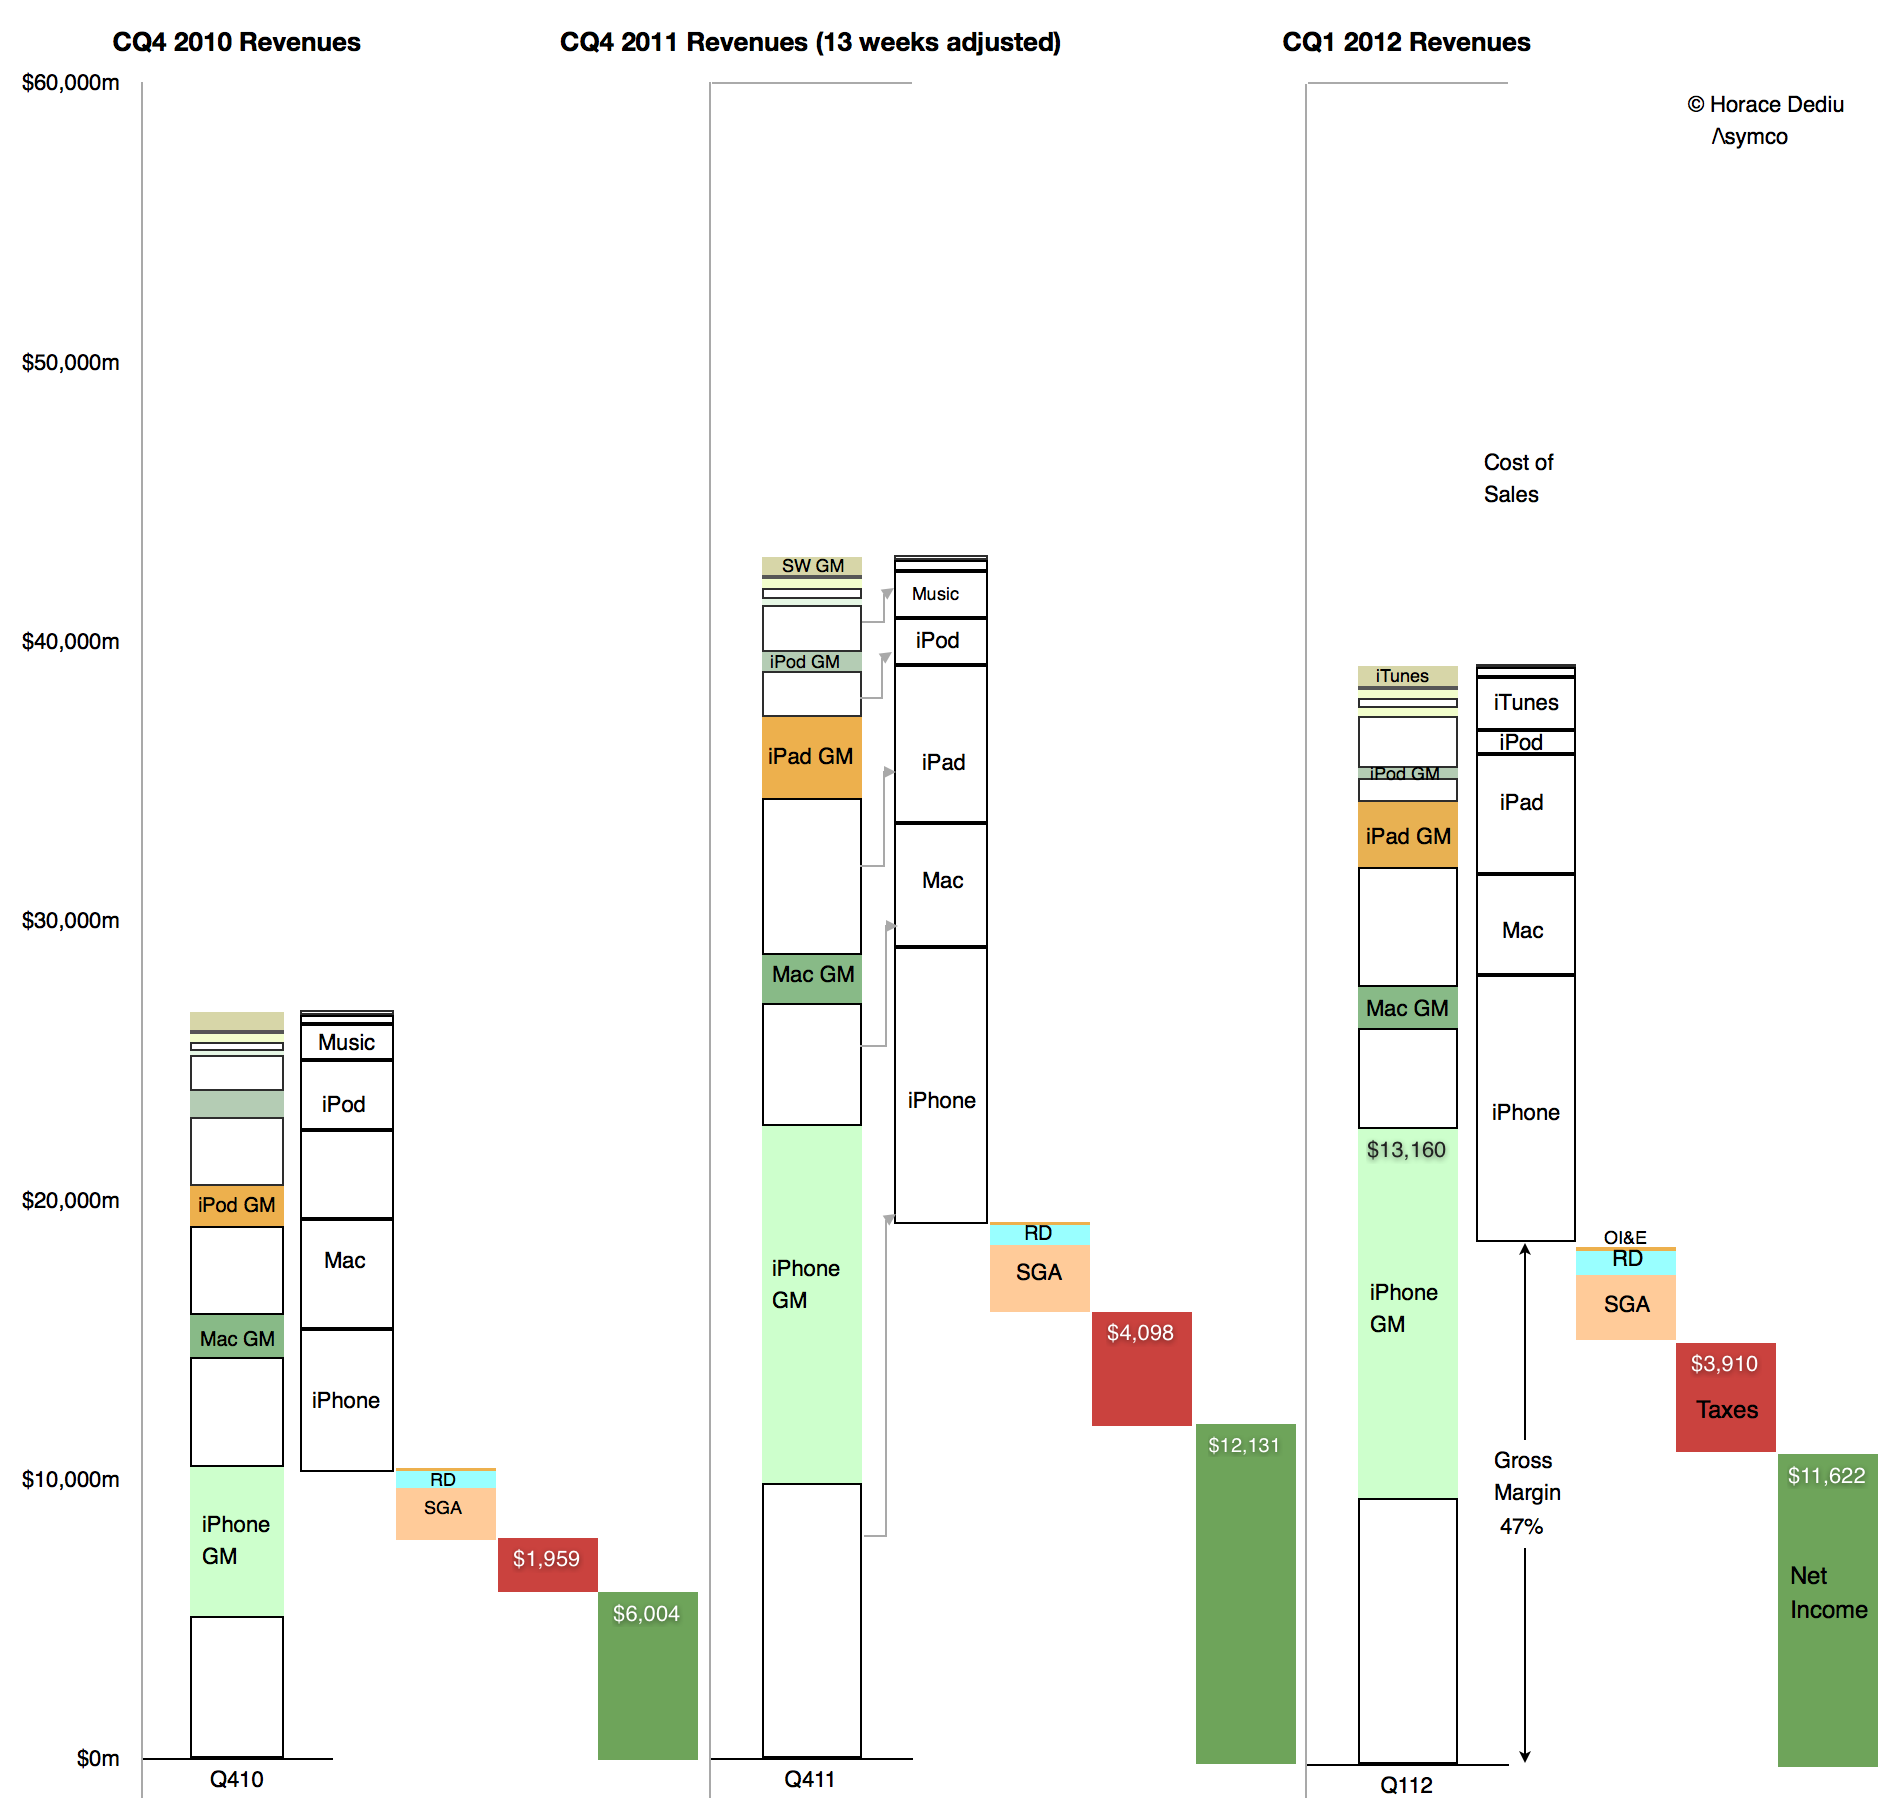
    Screen Shot 2013-02-05 at 2-5-11.36.46 AM

    Here we can see how sequentially sales fell but gross margins rose. Again, the change in absolute Gross Margin was slight but the reduction in cost of sales was out of proportion of the reduction in sales. Cost of sales fell by 13% while sales fell by 9%. The result was an increase in gross margin from 45% to 47%. The cause was that the cost of production fell.

    Obviously. Because, as everyone knows, costs of production fall as output increases. It's due to something called the learning curve. It's something that has happened for all of Apple's (or anyone else's) product launches forever.

    What is not obvious is the effect this has on the share price whose changes are shown at the bottom of the first diagram. It's a case where one margin's fall has caused quite a few margin calls.
  2. Apple's Calendar Fourth Quarter 2012 Growth Scorecard

    Research · 20 comments

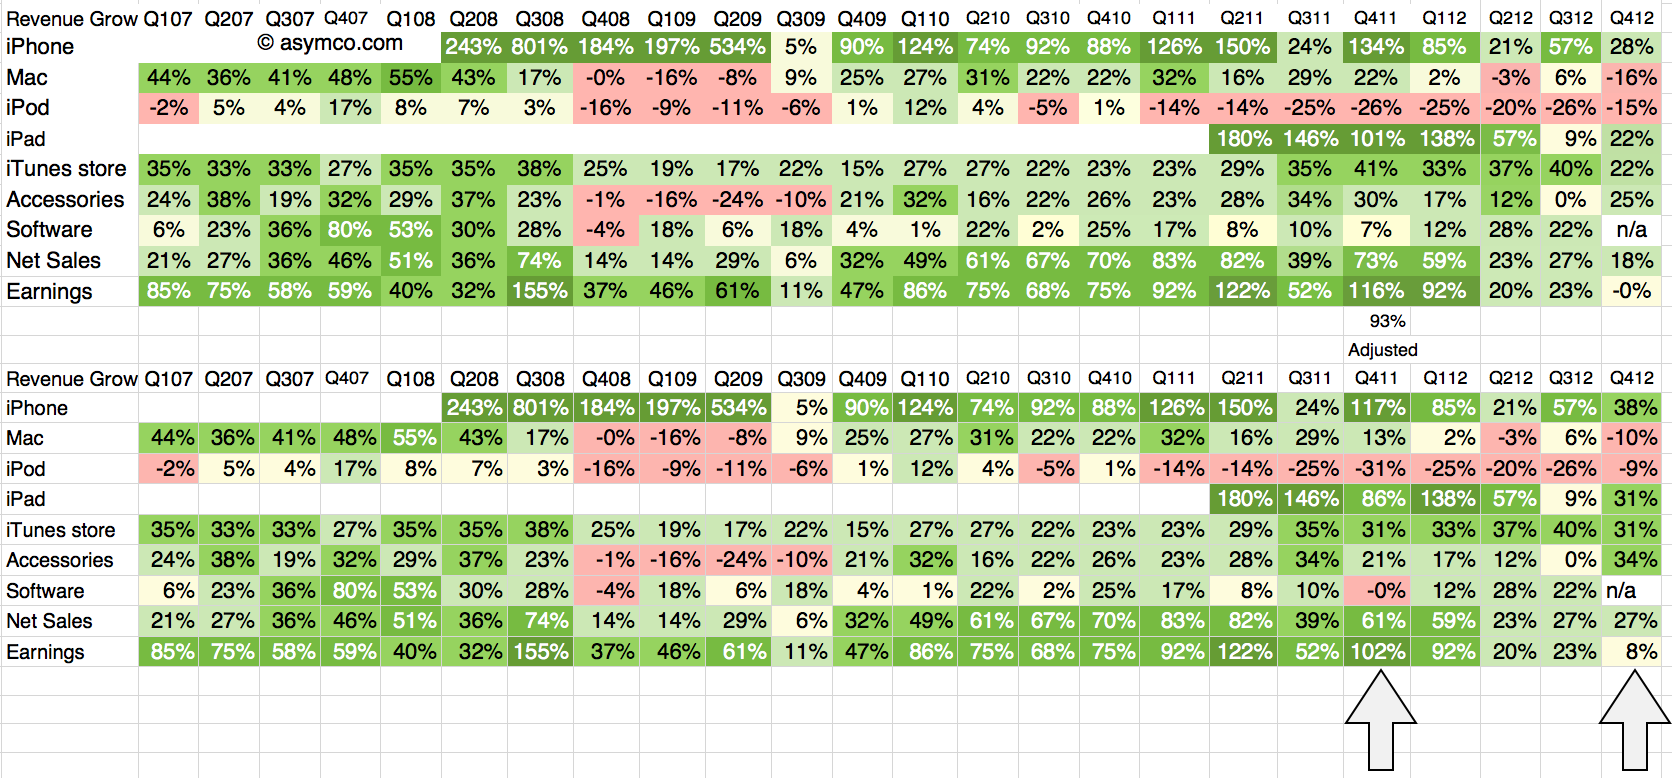
    The fourth quarter of 2012 was 13 weeks in duration while the fourth quarter of 2011 was 14 weeks. The difference implies that a comparison of revenues should be done with an adjusted 93% of the 2011 values. The growth for 4Q 2011 relative to 4Q 2010 should also be adjusted on this basis.

    The following tables show the unadjusted and adjusted growth rates. The adjustments apply to the bottom table and the columns highlighted.

    Screen Shot 2013-02-04 at 2-4-7.19.18 PM

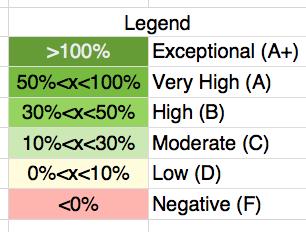
    As in previous scorecards, I used the following color scheme to "grade" the performance.

    Screen Shot 2013-02-04 at 2-4-12.14.53 PM

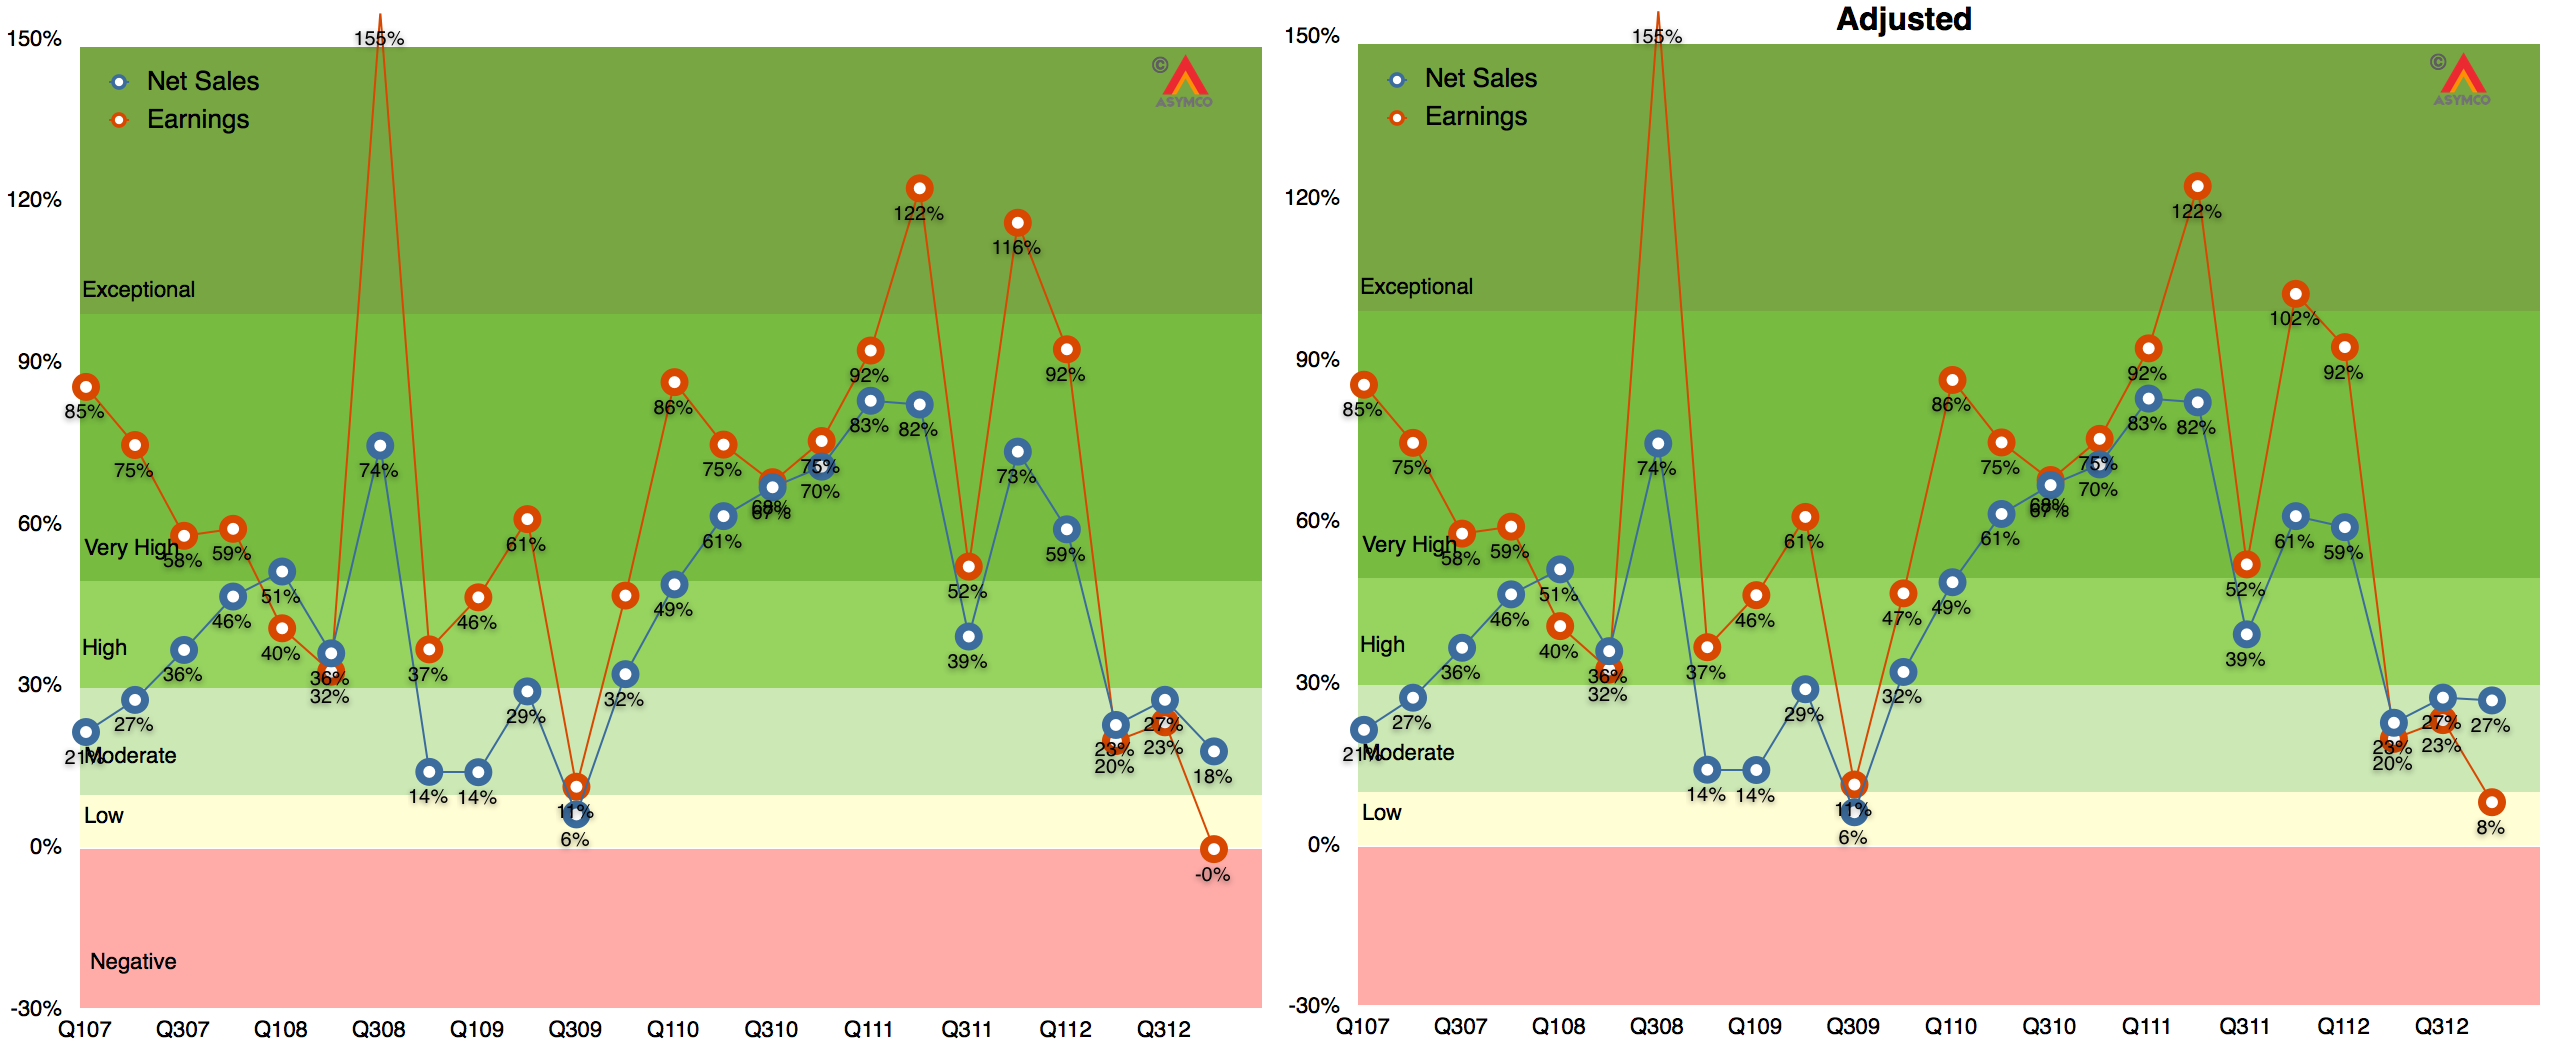
    The adjustment brings growth in sales to a respectable 27%, well above the 18% unadjusted level. In fact, using the color map grading system four lines increase their rating from "Moderate" to "High" growth: iPhone, iPad, iTunes, Accessories all move from the 20's to 30's  percent growth.

    The bottom line moves from 0% to 8% growth but it's still low relative to historic performance. That had to do with margins; more about that later.

    The graphs showing Revenue and Earnings growth with and without adjustments are shown below:

    Screen Shot 2013-02-04 at 2-4-7.21.34 PM

    Note that iPad, iPhone, Accessories and iTunes/Software are based on re-stated figures.

    Note also that the adjusted 2011 growth rates do not change dramatically with only iPad changing from Exceptional to Very High.

  3. The job the iPhone is hired to do

    Research · 94 comments

    In the latest quarterly report Apple changed how it reports product revenues. In previous quarters the iPhone and iPad were reported including accessory revenues while iPod accessories were reported under "Music" revenues.

    "Under this new format revenue from iPhone, iPad, Mac and iPod sales is presented exclusive of related service and accessory revenue […] revenue from all Apple and third party accessory sales is presented as a single line item [Accessories.]"

    Apple provided a document showing re-classified product summary data.  By measuring the difference between original revenue and re-stated revenue per product we can determine how much service and accessory revenue was being attached to each product.

    I did this for two quarters as a sample:

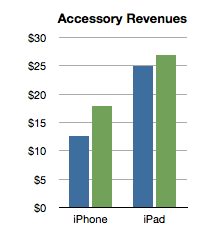
    Screen Shot 2013-01-24 at 1-24-2.16.14 PM


    The analysis shows that the iPhone has been receiving about $15 of accessory attached value and the iPad about $25. Interesting trivia, but how is this insightful?

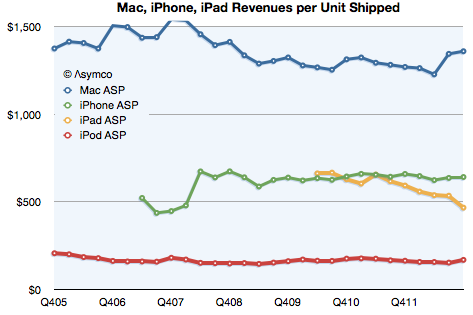
    Consider the impact on this analysis of revenues/unit shipped:

    Screen Shot 2013-01-24 at 1-24-2.31.52 PM

    The iPhone obtained about $642 revenue/unit (shown above as the last datum in the green line). That compares slightly lower with last year's $659/unit. However, the latest quarter is on the new basis and the data in the chart above shows old basis.

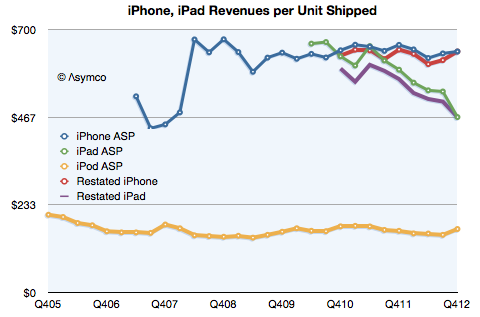
    Here is the data with re-stated iPad and iPhone ASP:

    Screen Shot 2013-01-24 at 1-24-4.29.37 PM

    On a re-stated basis, without the extra revenue from accessories, the iPhone "ASP" (Average Selling Price) from a year ago becomes $646 (which, again, is not what is reflected in the graph). This is almost exactly the same as the current quarter. The iPhone "ASP erosion" therefore goes from 2.6% to only 0.7%.

    Similarly, the iPad shown at $467 in the latest quarter does not drop from $593 last year but from $568. Its ASP erosion becomes 18% rather than 21%.

    Interesting resilience with the iPhone and slightly better support for the iPad price. What does it mean?

    Pricing power is the most important indicator of differentiation and it implies an ability to create value in excess of cost. Not only that but it also indicates whether a product is being "commoditized" by over-serving the market and being substituted by lower priced alternatives.

    In the case of the iPhone the tenacious retention of its ASP indicates that the point of over-service has not been reached. Buyers are not yet switching in significant numbers to the older, cheaper variants available from Apple. If they were we would see evidence in the price first due to the change in mix.

    Contrast that with the iPad where there is a far more marked erosion. That's due to the introduction of the mini which is good enough to substitute for the larger version for many of the jobs it's hired to do. We can safely argue that the iPad is good enough in smaller form factors and addressing larger markets.

    But why isn't this happening to the iPhone? Why isn't the iPhone n-1 "good enough"? Surely consumers can do almost the same tasks with an iPhone 4S as they can with the 5. Why are they still buying the new phone?

    The clue comes from the fact that the consumer is not the only buyer. It's  operators who buy and re-price the product. They are hiring the product to sell broadband and the newest variant is still the best hire to do that job. This observation is crucial to understanding the growth dynamics of the iPhone and consequently, of Apple itself.

    I repeat what I've mentioned before: The iPhone is primarily hired as a premium network service salesman. It receives a "commission" for selling a premium service in the form of a premium price. Because it's so good at it, the premium is quite high. Also because it's so good, it gets bought in large batches which allow Apple to schedule production efficiently.

    This understanding gives us a solid basis from which to evaluate its growth potential.

  4. What's up with text messaging?

    Research · 21 comments

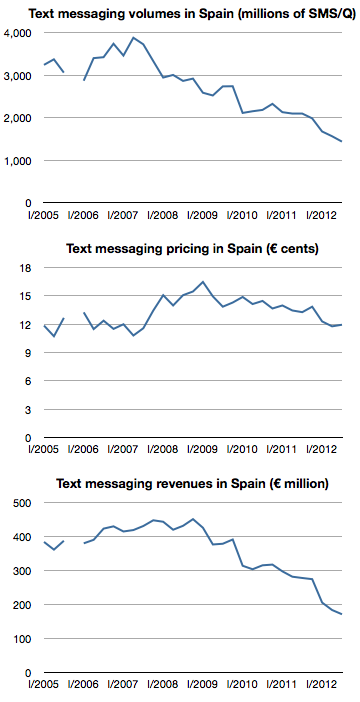
    The following graphs show text messaging volumes, pricing and revenues for SMS in Spain.

    Screen Shot 2013-01-18 at 1-18-2.40.39 PM

    After peaking at the end of 2008 at about €450/quarter, revenues have fallen by 60% to about €171 million in the third quarter of 2012. These figures represent almost 100% operating profit for operators so the impact is felt directly in the bottom line.

    The culprit is IP-based messaging. Services like Whatsapp, iMessage and even Facebook offer "free" messaging to users who have a smartphone and a data plan. I've been told that 97% of Spanish smartphone users have Whatsapp installed. In some markets this "free" messaging is offered via BlackBerry Messaging.

    The decline in SMS is coupled with a vast increase in IP-based mobile messaging. Whatsapp reported that it set a record of 18 billion messages processed over New Year's Eve. In October Apple announced that iMessage had delivered 300 billion messages during the preceding 12 months.

    Globally SMS traffic is still rising. It's expected to reach 9.6 trillion in 2012, but at least one analyst forecasts  that SMS’s share of global mobile messaging traffic will fall from 64% in 2011, to 42% in 2016.

    The data from Spain suggests that the drop may happen more quickly than anticipated.

  5. The iPhone MOQ

    Research · 21 comments

    [Kaoru] Kato, president of NTT DoCoMo Inc., said that the firm would want to add the iPhone to its lineup of serviced smartphones if it could form a mutually beneficial contract with Apple, Inc.

    Apple requires that carriers servicing its devices sell a fixed amount per year. Katō said that his company could handle such quotas if iPhones accounted for approximately 20%-30% of its overall smartphone sales.

    via NTT DoCoMo President Interested in Servicing iPhone — BrightWire

    When thinking about an iPhone launch, especially with a new operator, the crucial question is what is the minimum order quantity (MOQ). Some of the iPhone production is sold direct (as in the case of orders coming from Apple's online store) but the majority of units are sold via operator who order in batches.

    This issue came to light when Sprint's order was leaked in late 2011.  I discussed the order size at the time and put it in context. I concluded that Sprint MOQ was on average 7 million/yr., ramping with 4, 6, 9 and 12 million over a four year period.  I concluded that this was not a particularly aggressive gamble.

    Data published since then shows that Sprint actually sold 6.3 million during the first year, well ahead of my expected minimum order of 4 million and above even the expectations for the second year of sales. So far then Sprint and Apple gauged minimum demand quite accurately.

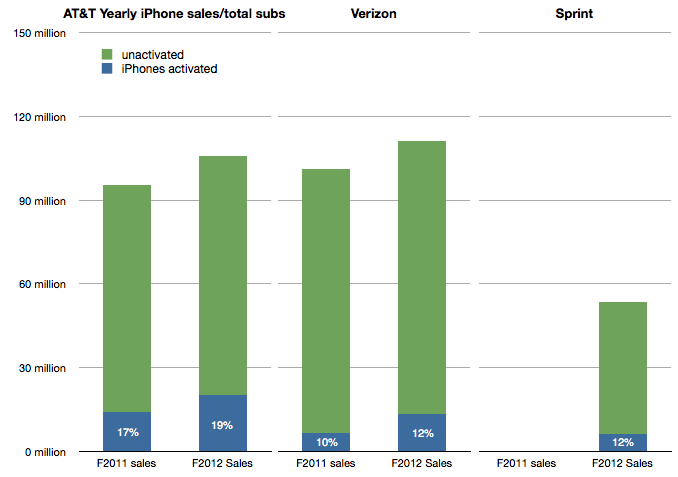
    I also showed that the Sprint MOQ was probably indexed off their sub base. I suggested that, based on subs data at the time, Sprint was committing to roughly 13% of its subs buying an iPhone every year. This was indexed off the data showing that 17% of AT&T subs were buying iPhones every year and 10% for Verizon. (I also assumed that this run level would be ramped over time).

    The updated totals for the 12 months ended October 2012 are 19% of AT&T subs purchased an iPhone, 12% for Verizon and 12% of Sprint. The performance is shown in the following graph:

    Screen Shot 2013-01-17 at 1-17-3.33.10 PM

    Which leads us to think about how the MOQ for the iPhone is calculated. If we assume Sprint and Verizon performance is typical it would imply that an operator like DoCoMo would be required to purchase iPhones at the rate of about 10% to 12% of its sub base each year, modulated to some degree by a ramp.

    NTT DoCoMo had 60.7 million subs in September 2012. 10% is about 6 million. Is Mr. Kato's quote above of 20%-30% of smartphone sales consistent with this?

    In an earlier interview (in July) Mr. Katō also stated that the target for smartphone sales in the year to March 2013 was 13 million. 30% of that would be 4 million units.

    This suggests that the iPhone MOQ for DoCoMo is only about 6% of subs. (4 million) Perhaps this is the basis of negotiation for an iPhone deal. Apple may have held out for 10% subs/yr. with Sprint on the basis of performance of the iPhone in the US but might be willing to settle for 6% subs/yr with DoCoMo, at least for the first year.

    The MOQ figure as percent of subs for China Mobile would also be an interesting point of debate.


  6. Cracking the China code: Microsoft vs. Apple

    Research · 87 comments

    In 2011 Microsoft's CEO bemoaned that revenue in China was about 5% of what it obtained in the US. Yesterday Apple's CEO suggested that revenue from China will overtake the US in the near future.

    The contrast is even more stark when one considers the time and effort each company has made in China. Microsoft has been investing and promoting itself in China for decades while Apple barely had any presence 3 years ago.

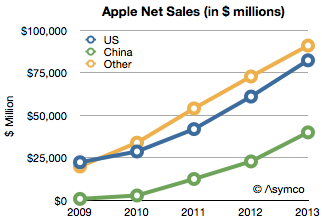
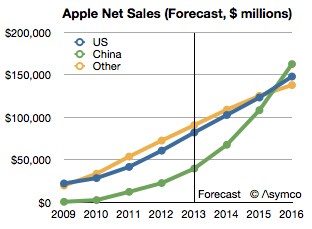
    To put a finer point on this I show below Apple's sales by region:

    Screen Shot 2013-01-11 at 1-11-10.08.26 AM

    Apple's China net sales in fiscal 2009 were only 769 million. In 2012 they were $22.8 billion. That is a figure greater than US sales three years earlier. Put another way, China sales grew in three years as much as they did in the US in 33.

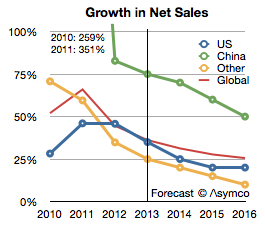
    The growth rates were astronomical: over 250% in 2010 and 350% in 2011. In 2012 the growth slowed to 83% but that is still almost twice the US or the global average. The growth rates are shown in the following chart:

    Screen Shot 2013-01-11 at 1-11-10.09.19 AM

    I added an estimate for growth into the future moderating to 50% for China and 20% for the US. If that happens then China will become the largest market for Apple by 2016 as shown below.

    Screen Shot 2013-01-11 at 1-11-10.10.46 AM

    The reason for this growth is, of course, the iOS product lines. Growth started when the iPhone was introduced and surged with the iPad and every time updates were released.

    The contrast with Microsoft now comes back into focus. China and the US have a roughly equal number of PCs but the mobile users in China exceed the US by a factor of three to one. The pool of users is so great that Apple obtained its growth even with reaching only 30% mobile network distribution coverage.

    Without a mobile portfolio Microsoft is severely hampered. Of course, Microsoft is trying and has made several attempts to place its Windows Phone in the hands of Chinese users. It's a tough sale however because Microsoft must work through partners. They need to get vendors to license the OS and the operators to range the devices and retailers to push it. Given the flood of "free" Android variants they are having trouble even starting down that long road.

    But more fundamentally, Microsoft's software licensing business model is severely limited in China because what it offers is not what is valued. Both on the PC or on the mobile device, what China values is the tangible. Software can be made valuable only if it can affect the purchase decision of hardware and it can do so only if it's sold as part of an integrated product. With Surface, Microsoft shows that it understands this. What does this imply for a Microsoft phone?


  7. Getting to know the meaning of sisu

    Research · 13 comments

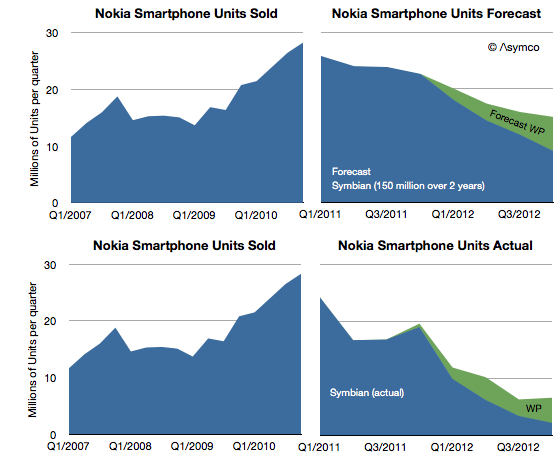
    Nokia announced 4.4 million Lumia smartphones were shipped in Q4. That's about 14 million since the Lumia line was launched a year earlier. It isn't however nearly enough to replace the lost sales from Symbian. One year earlier Nokia shipped 19 million Symbian phones in the fourth quarter and the year before 28.3 million. The history of smartphone sales from Nokia is shown below:

    Screen Shot 2013-01-10 at 1-10-6.23.00 PM

    I repeated the forecast I drew up in February 2011 when the platform switch was announced. That forecast was based on the company stating that 150 million Symbian phones would still be shipped. Symbian fell far more rapidly than I (and Nokia) expected and to date only 98 million have shipped. The last quarter's 2.2 million seems to be so low that it will be hard to imagine the platform lasting more than a few quarters.

    My forecast for Windows Phone was 15 million (through Q4/2012) and the 14 million actually shipped is not far off. However, note that the sequential growth into the fourth quarter was lower than the same period last year. For the holiday quarter Nokia received almost no boost. If there is reason to be optimistic it's that there wasn't a decline in overall smartphones into Q4.

    The overall result is that Nokia remains in an operating loss status and it's going to be very hard to recover. No phone vendor has successfully recovered to date. The company managed to book a €50 million one-time payment for IP rights (presumably from RIM) and is sustained by royalties and platform support payments from Microsoft. But even so it's barely breaking even.

    The prospects for Windows Phone may be improving however. Operators in the US continue to talk about it. We don't have a split for AT&T's push this past quarter and estimates suggest that 80% of smartphone from AT&T were still iPhones but Verizon will also push the platform and there are suggestions it's doing well in Germany. HTC has also launched some WP flagship phones and may have had a good December as a result.

    That translates into steady progress. But the growth of Android and iOS continue as well. Windows Phone needs to continue to persevere in adverse conditions for years to come. The Finns know a thing or two about that.

  8. A more complete picture of the iTunes economy

    Research · 59 comments

    As it did yesterday, on occasion Apple reports the cumulative total downloads and payments to developers. Since this is done in variable time intervals, it makes analysis of the value of the app store difficult.

    But not impossible.

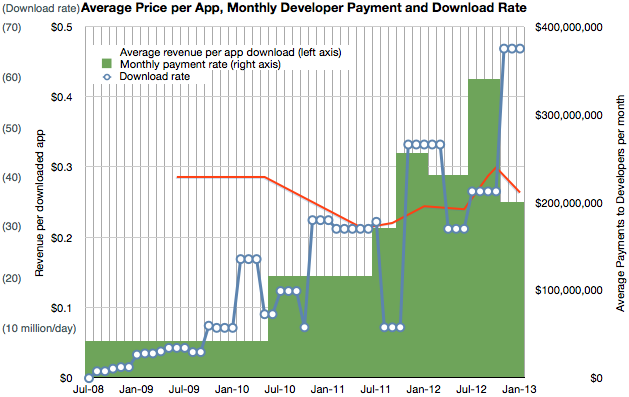
    The provision of developer revenues means we can determine the pricing of apps. The pricing of apps and the download totals allows us to determine the revenue of the store. Using the time stamps of the reports allows us to determine these quantities over time.

    I've combined the data we have so far into the following graph.

    Screen Shot 2013-01-09 at 1-9-3.17.11 PM

    It shows three quantities (on three separate scales) at a monthly resolution:

    1. Download rate (in millions/day, interpolated from download totals)
    2. Payment rate to developers (reported change in payment to developers/reported time interval)
    3. Resulting revenue per download (in red, trailing average over a 10 month period)

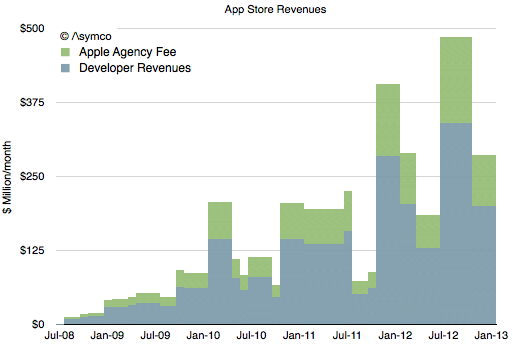
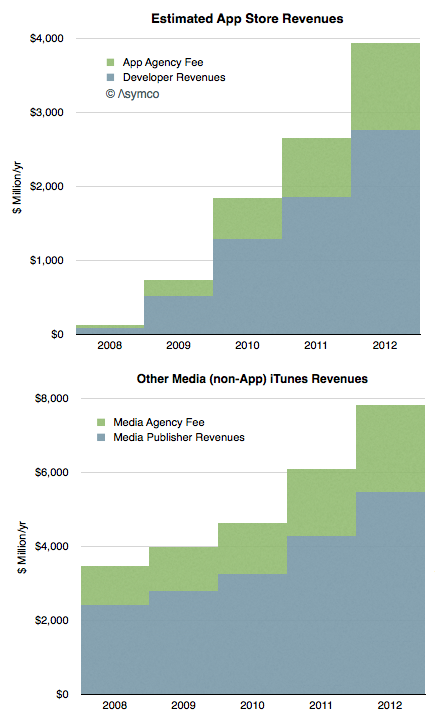
    Having a price and quantity of app downloads allows for a complete picture of App Store revenues over time, shown below:

    Screen Shot 2013-01-09 at 1-9-3.22.02 PM

    Note that I've separated the developer revenues from Apple's own revenues. The blue area should total cumulative developer payments (to a degree of error.)

    The green area above is what Apple includes in its financial reports as part of "Music" revenues. If we annualize these App Store revenues we can strip them out and show them separately from "other media" revenues.

    Screen Shot 2013-01-09 at 1-9-3.25.04 PM

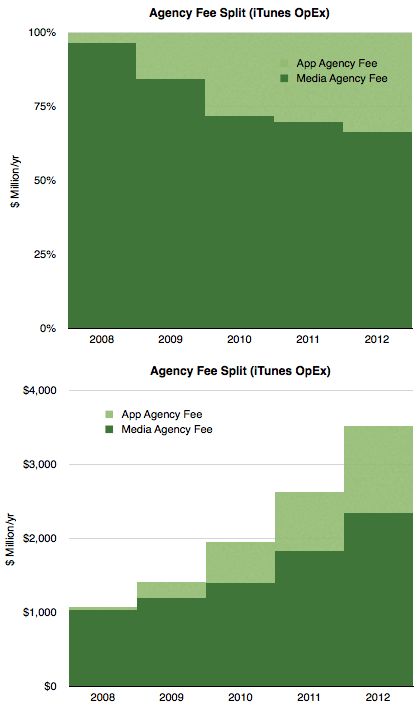
    Concentrating on the green areas which represent what Apple "keeps" we see the following split:

    Screen Shot 2013-01-09 at 1-9-3.28.55 PM

    Considering that Apple reports the iTunes store to being "slightly above break-even" then we can summarize the chart above as the operating expenses for the store.

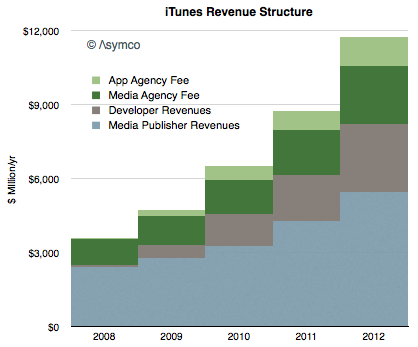
    Finally, taking into account all the information above we can draw a complete picture of how revenues flow through the App Store:

    Screen Shot 2013-01-09 at 1-9-3.34.23 PM


    Here are some conclusions:

    • The iTunes economy defined as gross revenues transacted through it is now about $12 billion/yr.
    • Over the last five years content owners (media and app) received a total of $24 billion while Apple spent about $10 billion to create those sales
    • Seen as a retail business, iTunes costs about $3.5 billion/yr to operate. This includes merchandising, payment processing and "shipping & handling".
    • Total revenues have risen steadily in a range of 32 to 38% compounded over the last 4 years.
    • Apps are now a third of all iTunes revenues, (about $4 billion/yr) having taken that share in only 4.5 years.
    • Non-app media still make up 2/3 of iTunes in terms of sales value but their growth is now 28% vs. about 50% for apps.
  9. Estimates for Apple’s first fiscal 2013 quarter

    Research · 130 comments

    I've postponed my estimates for the fourth calendar for a long time. The reason is that there have been conflicting data to deal with and I've been hoping for some clues to give clarity. Unfortunately, even though I waited, I have not received many clues. Here are the challenges we have to deal with in this quarter:

    1. Management gave very low guidance for the quarter's earnings and sales. Normally this should not be a concern since the long-term pattern has been for them to "sandbag" significantly. For example last year's fourth quarter was guided at $9.3 EPS while the company delivered $13.87, a 49% "beat" to their guidance. However Q2 and Q3 beats were only 7% and 13% respectively and if we assume a similar number (10%) for Q4 we get about $13/share which would be a year-on-year decline in earnings (down from $13.9). This has not happened for many, many years. Management explained this through a lengthy set of reasons including a shorter quarter (13 weeks vs. 14 weeks), new product launches, currency fluctuations, deferrals and unfavorable component pricing. Then again, similar explanations were used in the past with no reflection in what actually happened.
    2. Management also launched a large number of new products. This normally leads to a surge in sales. In fact, 80% of revenues would come from a new portfolio of products. Having such a broad launch quarter into a holiday, would normally imply huge growth. Not only is this a critical launch quarter for many products but they also rolled out the iPhone to more markets more quickly than ever: 100 countries in three months. The broad roll-out implies a steeper ramp in production and thus more volumes. This would also contradict the lowered expectations from the CFO. However...
    3. Production was constrained. It was quite a long time before waiting times decreased for the iPhone--longer than what we saw last year. In the earnings call Tim Cook said "It's difficult to predict when supply and demand will balance, but I'm feeling very confident on our ability to supply quite a few iPhones". This again implies significant acceleration but did they achieve the targets? He did also announce that they met their target of 100 countries during the quarter but it's not clear if this was as quickly met as they would have liked.
    4. Margins are complicated. Launch quarters have lower margins typically and this is well understood. However, we have new products in the form of a new iPad at a new price point as well as the new iPhone which may have had some difficult manufacturing issues (i.e. yield). So how much faith do we put in the perennial pessimism in guidance?
    5. There was a vast increase in CapEx in the prior quarter. Normally CapEx spending "leads" production and is in proportion to it. However, the surge in Q2 and Q3 seemed to be unmatched by vast new production, at least that's what we are led to believe by both consensus and by management guidance. Did this CapEx differ in character from previous CapEx? Was it more "strategic" and less "tactical"? Will the disconnect continue?

    There are also the deeper questions:

    • Why there are no new operators being signed? The addressable market has not increased in the last 6 months. Why?
    • Is there a faster product cycle in the works? Is there a shifting of gears to a new product development process?
    • What's the nature of the relationship with Samsung as a supplier? Is their replacement characterizing the new type of CapEx spending?

    All these currents make this quarter doubly difficult to forecast. And it does not help that it comes on the back of two weak quarters which were argued away as exhibiting transition effects.

    So I'm very uncomfortable with my forecast and find it hard to defend this quarter. I considered not publishing one at all because it gives too much confidence when none is warranted. However, I received so many requests to publish that I relent and offer the following:

    • iPhone units: 55.5 million (50%/62%)
    • Macs: 5.0 million (-4%/+3%)
    • iPads: 24.4 million (58%/70%)
    • iPods: 11.2 million (-27%/-22%)
    • Music (incl. app) rev. growth: 25%/38%
    • Peripherals rev. growth: 10%/19%
    • Software rev. growth: 5.5%/14%
    • Total revenues: $60.0 billion (30%)
    • GM: 39.8%
    • EPS: $15.74 (13%)

    I included two growth figures (in parentheses). The first is a straight y/y value and the second is adjusted by assuming there were 13 weeks last year (and that sales were evenly distributed over those weeks).

    [We'll get a chance to go over this forecast and what is actually reported at Asymconf. Don't forget to sign up.]

  10. How much do maps cost and what are they worth?

    Research · 68 comments

    How much does it cost to have the world's best maps?

    The answer may seem simple: $8.1 billion.

    That was the cost to Nokia in cash for buying Navteq in October 2007. It would seem that buying that asset (or another one like it) is a cut-and-dried solution to anyone needing a mapping "solution". But it's not an answer that is either complete or explanatory of how mapping solutions are valued.

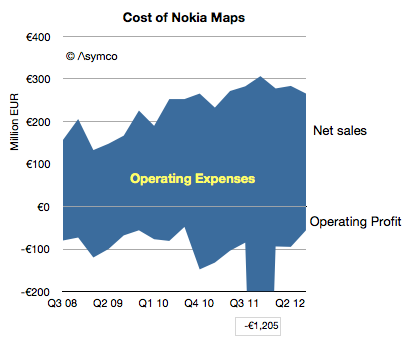
    Navteq was not priced as a database for an app. It was a business which was expected to create licensing revenues and profits[1]. The actual price for this business net of cash was $7.7 billion but the following graph shows the net sales and operating profits since Nokia began reporting its performance:

    Screen Shot 2012-12-18 at 12-18-3.13.12 PM

    The blue area represents the difference between sales and costs and hence the operating expenses--the payments needed to "keep the lights on".

    These total expenses over the 4.25 year time frame totals €6.5 billion. The total operating losses equal €2.6 billion. Therefore, as far as Nokia's shareholders are concerned, they paid $11 billion for Nokia maps, to date.

    What do they have to show for it?

    Nothing. The entire company is now worth only about $15 billion. It's hard to imagine maps being worth 73% of Nokia. What Nokia hoped to get for the product was some value in its devices. As other issues intruded, that value has not been realized. Nor has any external licensing revenue been realized. Net external licensing revenues are actually decreasing.

    The situation looks even even uglier when the maps asset can be seen as costing €1.5 billion every year. Why would anyone want to be in this business?

    I bring this up because, apparently, everyone wants to be in this business.

    Via Twitter I received a suggestion (rumor?) that Google spends about $1 billion every year for maintaining their maps. (Using a conversion from Euros to Dollars yields a Nokia maps burn rate of nearly $2 billion/yr.) Furthermore, there seems to be a burning desire for Apple to also burn this money.

    If so, then Apple might have to start spending $1 to $2 billion/yr to merely maintain a data set. That would be a minimum of an additional 7% in operating expenses.

    Why would they do that?

    If Apple cannot buy or license quality data, there may be no choice. Maps have become a hygiene factor for a platform. Not having them makes a platform repulsive but having them offers no attraction.

    Another way of looking at the maps asset is like a component in a phone. A vendor needs a certain class of processor, memory or screen or battery. Not having a minimum level of functionality makes the product uncompetitive but having it does not guarantee success.

    What's worse, the market may have been cornered—there may be no suppliers. Unlike hardware components, the maps component is not a commodity with a market of suppliers. The work needed to maintain the maps is a commodity but the aggregation and consolidation of the data is valuable and those who have gained control over the data and they are not likely to license it to any competitors for strategic (i.e. political) reasons.

    So we have a perverse situation of a very costly, unprofitable asset requiring duplication of maintenance effort by politically motivated actors imprisoned by their own strategic interests.

    If so then it fits perfectly with the mobile telecom industry. Like mobile networks, maps are very expensive and worth very little.

    ---

    Notes:

    1. The revenues that Navteq was obtaining during the 2008/2009 time frame included that from customers such as Verizon, Garmin, Advertising, Traffic services, Microsoft Windows Live services. For the six months ended on December 31, 2008, Europe accounted for 44% of NAVTEQ’s net sales, North America 43%, Middle East & Africa 8 %, Asia-Pacific 2 %, Latin America 2% and Greater China 1%.

    —

    If you want to learn more about how to analyze technology industries and the evolution of value chains, consider participating in Asymconf.

  11. Calibrating launch performance for the iPhone in China

    Research · 59 comments

    When the iPhone 5 launched Apple promised availability in 100 countries before the end of year. This was a very aggressive plan given the gradual release of previous products. Last year the iPhone 4S only arrived in China (along with 21 additional countries) on January 13th. This year it was almost a month earlier.

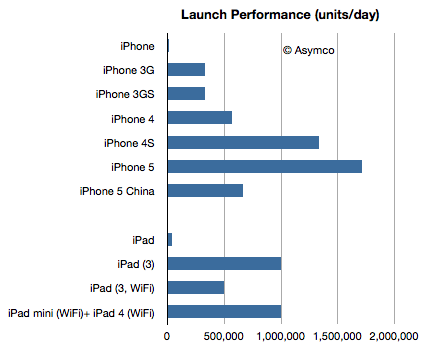
    Apple also announced for the first time this year first weekend sales for China: 2 million. This is, as far as I know, the first weekend sales data for a single market outside of the US. The time span was three days and therefore the daily sales rate was 2/3 million per day.

    The following chart compares the launch performance for the launches which Apple reported:

    Screen Shot 2012-12-17 at 12-17-2.44.04 PM

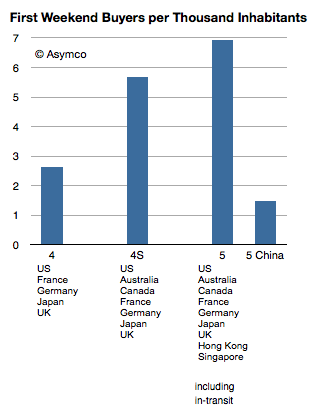
    If we normalize by population, the launch performance shows about 1.5 iPhones sold per 1000 inhabitants.

    Screen Shot 2012-12-17 at 12-17-2.47.07 PM

    It's a lot less than what we saw with the iPhone in the US and the first tranche of launch countries. But it's not far from the 2.6 achieved by the iPhone 4. The pricing and 3G penetration in China are far less favorable making this even more impressive.

    According to ISI's Brian Marshall, the iPhone achieved 1.5% penetration of the 3G subscriber base or 15 iPhones per 1000 3G subscribers. If we assumed the same basis (3G subs) that would make the iPhone 5 twice as popular on launch in China than in the US.