Asymco

Asymmetric Intelligence

revenue

  1. Below the Surface

    Research · 83 comments

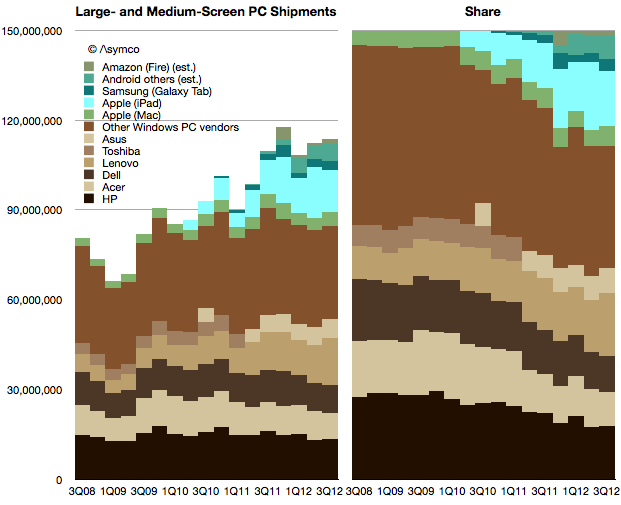
    Early data shows that the PC market has not experienced a "pop" from Windows 8. Market watchers have been anticipating this pop since every previous version of Windows has led to a surge in shipments. PC vendors have also been hoping for this to lift their volumes. Volumes have been stagnant for a while, as the following chart shows:
    Screen Shot 2012-12-13 at 12-13-3.45.58 PM

    If we combine the traditional PC and tablet markets—what I refer to as "large and medium screen PCs"— there has been growth. However the growth is all due to the tablets. When seen in a share split (blue tablets vs. brown Windows PC's) the shift toward tablet computing is clear.

    The question is whether Microsoft will be successful in shifting to this new computing model? Microsoft's problem is not that it has difficulty offering an operating system for tablets. The problem is that the economics of both systems and application software on tablets is destructive to its margins.

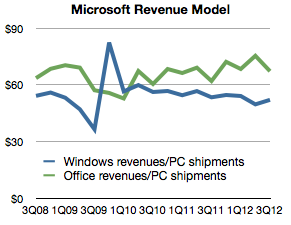
    A PC has for several decades been "taxed"[1] with a Windows and Office license. The exact figure is imprecise because of subscription accounting used by Microsoft, but we can take Microsoft revenues for Windows and Office and divide by PC shipments to get an average.
    Screen Shot 2012-12-13 at 12-13-3.47.14 PM

    This view shows how Windows revenues per PC have held steady for the last three years and Office have moved up slightly. In the latest quarter Windows "captured" $52 per PC shipment and Office "captured" $67.

    The problem for Microsoft is that pricing systems software at $50 and a suite of apps at $67 for a tablet that costs $200 to the end-user is prohibitive.

    Firstly because an OEM could not justify paying $50 to Microsoft while competing with another vendor whose (Android) software license costs nothing. It implies an increase in his bill of materials without the ability to charge more for the product and hence a reduction or elimination of margin.

    Secondly because consumers (or IT buyers) would have a hard time justifying $67 for an Office license for every tablet when most apps are either free or under $10. (Apple charges $9.99 each for iOS versions of Pages, Numbers and Keynote which can be installed on several devices.)

    The economics of tablets imply a "commoditization" of system and application software. So what's Microsoft to do?

    The answer is Surface where the software margin is captured in hardware. This explains the pricing of Surface. The price isn't significantly below what Apple charges because Microsoft wants to capture a comparable (30%+) margin. On a $500 product that amounts to $150. After subtracting hardware operating and distribution costs we can get pretty close to the $120 it currently obtains from a PC.

    This also explains the lack of appetite for "partnerships". OEMs which would normally compete on hardware would have to deal with zero margins (or less) after license fees and would be encouraged to cut corners and shave costs, compromising the experience and causing the platform to suffer.

    Microsoft does not like the phrase "post-PC" because it implies the end of its hegemony. They like to think of the PC becoming a new form factor in which they have the same role they've always had. However, looking beyond the form factor we see that mobility itself is disruptive in the implied modularity of the PC.

    Device economics offer the explanation for an otherwise perplexing Surface strategy. The question remains how many Surface units could Microsoft possibly sell to maintain its revenues.

    --

    1. A "tax" is implied only when purchases are mandatory.
  2. The new age of Capital Intensity

    Research · 117 comments

    In the post reviewing Samsung's Capital Structure I noted that its component divisions have historically taken 90% of capital investments and that the overall capital intensity for Samsung Electronics has increased in proportion to its component revenues.

    In another post regarding the capital structures of other technology companies with different business models I noted that Apple has changed its capital structure to a significant degree over the previous three years.

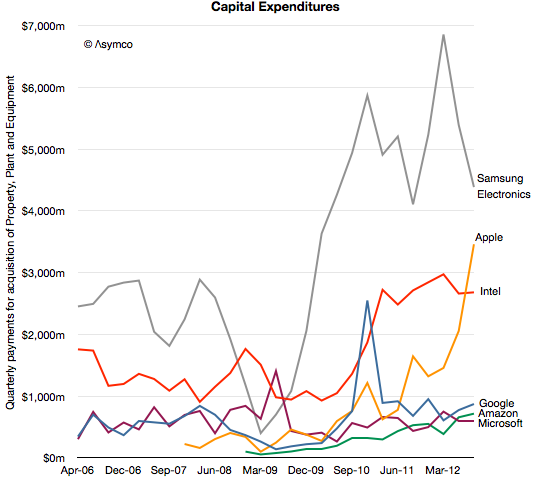
    In the following graph I combined these observations to show how capital expenditure patterns may be used to discern the underlying business model.

    I would group "cloud" or "platform" based companies like Google, Amazon and Microsoft as a cohort which, although spending significant amounts on capital equipment, do so mainly to support services. Their primary employment of capital is to sustain the infrastructure of data centers necessary to deliver the services underpinning their business models.

    I would group Intel and Samsung as "component" based companies which use capital to build production capacity that delivers, hopefully, a control point in the value chains they participate in. Note that I am assuming that Samsung Electronics' CapEx primarily targets semiconductors and displays as it did during the 2006 and 2007 period when data was available.

    Therefore, given the patterns over the last six years, it might be possible to classify a company's core business by just looking at its CapEx: The services group showing growth but relatively stable patterns and the components group showing more volatility, macroeconomic sensitivity and an overall higher level of spending, especially as a percent of sales.

    The question that pops up then is in what category does Apple fall?

    My observations for over a year have been that Apple is increasing its capital spending to such a degree that it is neither fish nor fowl. It operates data centers but presumably does not operate fabrication plants. And yet it spends more than Intel and Google combined.

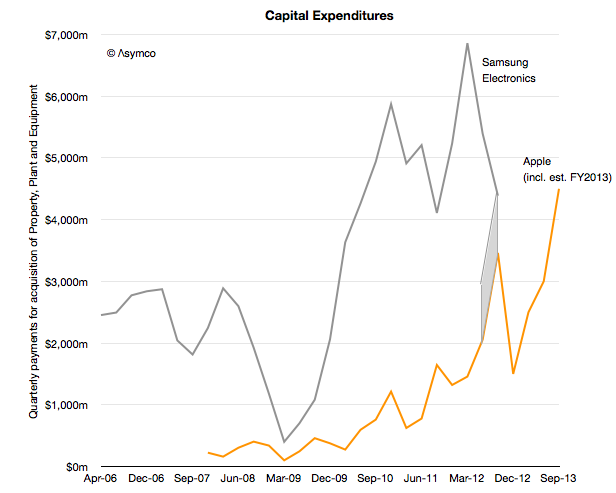
    Contrasting Apple and Samsung Electronics tells an even more interesting story. In the following graph I've added two additional items of information: First, although CapEx spending is recorded in the cash flow statement, Apple reported in its yearly (10K) report that it spent an additional $2 billion for equipment which did not pass through cash flow.
    If we were to add $1 billion to each of the previous two quarters, the graph would look like this:

    The second piece of information is that Apple projected its spending for the following fiscal year. I've added that spending in a pattern matching the last fiscal year.

    Apple is still spending less than Samsung. In its fiscal year 2012 Apple spent about $10 billion while during the same time frame Samsung spent nearly $22 billion. However, Apple has begun to bump against Samsung's spending level on a quarterly basis.

    I consider this extraordinary evidence of an extraordinary shift in strategy.

    For a year we've been debating here to what degree Apple has a "capital intensive" business and what exactly could it be spending capital on. One early hypothesis has been that it's on data centers or on real estate for spaceship campuses. These can be easily dismissed on the knowledge that they can't cost that much (and that the spending happens gradually). Another hypothesis is that the tooling for milled aluminum cases and other mechanical components is expensive and Apple has to buy a lot of it. But, again, the level of expenditure is in the league of Intel and Samsung which make vast quantities of semiconductors in very expensive plants. It's hard to imagine milling machines being cost equivalent to chip foundries.

    The comparison with Samsung, whose vast capital commitments are legendary and are its primary strategic asset puts Apple in a new light. Perhaps we can't yet call Apple a semiconductor company or even a fabricator but they are putting their "money where their mouth isn't". We can infer that it's not going where the company currently operates. The capital is being deployed almost silently and, though vast in scale, barely gets a mention from analysts. Not even a single question has been raised at any earnings call about this spending.

    So what tale does this capital tell?

    One interpretation is to apply the value chain disruption theory and ask whether Apple is acting to counter a potential disruption. In other words, that this is a specific threat response from an incumbent. There is some logic to this because  the antagonism between Samsung and Apple is so strong that it might justify a reaction of this kind.

    However, I believe that there is a more measured process at work over a long period of time. The one distinguishing advantage and attribute that Apple has  is its preference for integration. This preference is not a secret and Tim Cook repeats it often. The integration is evident with their move into retail and component design, in other words in both directions along a value chain. So my hypothesis is that this is part and parcel of an ongoing re-alignment of their role in the value chain.

    This second explanation suggests that Apple simply wants to control all the areas which affect the value they produce. First because they feel that there are areas that are not good enough and the product/experience cannot be good enough if its constituent parts are not good enough. Second because without control there are constraints to what it can do strategically.

    Whatever the reason, I read the evidence of increasing commitment and engagement in parts of the value chain as part of a continuous evolution of Apple's role. Furthermore, it's something that should be seen as a signal of a new era in how technology companies operate. We see hints of "vertical integration" with Microsoft building hardware, and Google buying Motorola and Amazon selling devices. Apple did all these things and now it casts an eye over the next frontier: components.

    ---

    If you want to learn more about the future of the technology industries and the evolution of value chains, consider participating in Asymconf.

  3. Samsung's Capital Structure

    Research · 28 comments

    Having described the Revenue, Operating Margin and cost structure for Samsung Electronics it's time to review their investment strategy.

    The Economist summarized it well:

    [Samsung's] businesses look remarkably disparate, but they share a need for big capital investments and the capacity to scale manufacture up very quickly, talents the company has exploited methodically in the past.

    Samsung's successes come from spotting areas that are small but growing fast. Ideally the area should also be capital-intensive, making it harder for rivals to keep up. Samsung tiptoes into the technology to get familiar with it, then waits for its moment. It was when liquid-crystal displays grew to 40 inches in 2001 that Samsung took the dive and turned them into televisions. In flash memory, Samsung piled in when new technology made it possible to put a whole gigabyte on a chip.

    When it pounces, the company floods the sector with cash. Moving into very high volume production as fast as possible not only gives it a price advantage over established firms, but also makes it a key customer for equipment makers. Those relationships help it stay on the leading edge from then on.

    The strategy is shrewd. By buying technology rather than building it, Samsung assumes execution risk not innovation risk. It wins as a “fast follower”, slipstreaming in the wake of pioneers at a much larger scale of production. The heavy investment has in the past played to its ability to tap cheap financing from a banking sector that is friendly to big companies, thanks to implicit government guarantees much complained about by rivals elsewhere.

    Can we find evidence of this capital intensity?

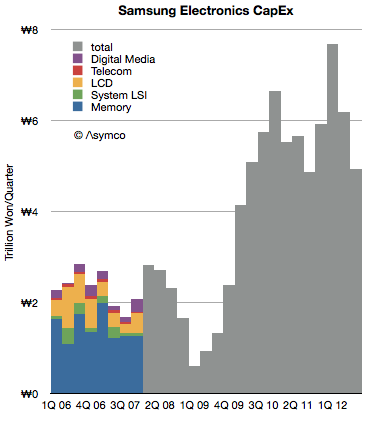
    To answer, I reviewed Samsung Electronics CapEx as reported in their quarterly cash flow statements. The following graph illustrates the data:

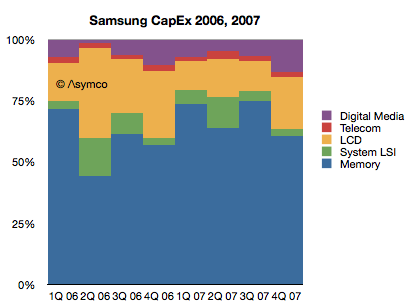
    Note that during 2006 and 2007 the company specified expenditures on an operating divisional level. Since 2008 it has reported only a total. For the years where divisional detail is available, the percent split looks as follows.

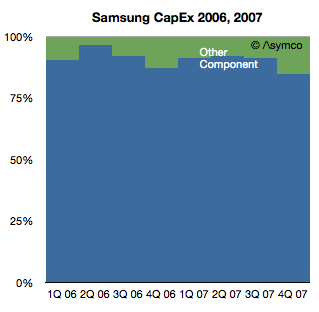
    If we combine the Semiconductor division (Memory and System LSI) with the LCD group and classify this as "components" the split looks as follows:

    Therefore, for the two years when information was available, the component divisions consumed 91% of expenditures and Consumer Electronics (Digital Media) together with the Telecom (mobile phones, mainly) were a combined 9%. The least capital intensive division was Telecom, the mobile phone group, with only a 2% allocation of capital.

    The other observation is that, after a contraction in the recession years of 2008 and 2009, CapEx expanded greatly in 2010 and 2011. [1]

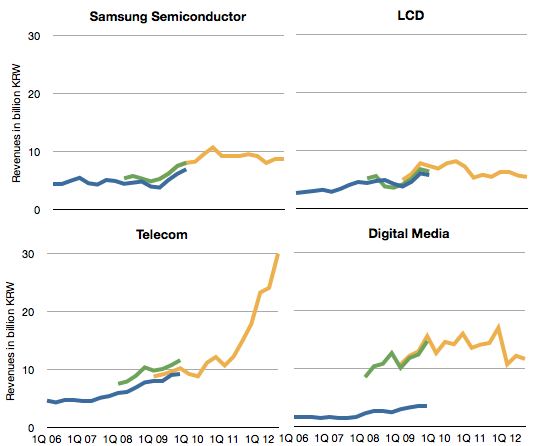
    Coincident with the growth in CapEx, the company's revenues grew dramatically as well. However, as the graphs below show, the growth has come predominantly from the Telecom division.[2]

    I calculated the correlations between each division's revenues and the growth in CapEx (total) for the time periods 2006 to present and 2008 to present and obtained the same results: The division with closest correlation to CapEx remains the Semiconductor group.

    This stands to reason. Capital expenditures are mainly in the service of semiconductor manufacturing. Semiconductors, or components in general, require more capital than assembly of devices or consumer electronics.

    However, the revenues and operating income for devices have grown far faster. Samsung's investment in capacity would have been largely profit-free had they not also been assembling the devices which capture the margins.

    One might conclude that Samsung would be better off abandoning its capital-intensive components business and focusing on the devices. However, as James Allworth points out if you only do the devices, you may find yourself vulnerable to value chain disruption. Whoever is involved "upstream" in the value chain will inevitably learn the device business from a base of "commodity" manufacturing and pose a threat.

    Now the question poses itself: Which of the usual suspects understands this?

    Stay tuned for evidence of an incumbent response.


    If you want to learn more about the future of the technology industries and the evolution of value chains, consider participating in Asymconf.

    ---

    Notes:

    1. Some of this growth is due to a new (K-IFRS) accounting standard in use after 2010, but the expansion was significant regardless.
    2. The revenues data is was reported using three different accounting methods and each is shown with a different line color: Blue is "Parent basis", Green is "Consolidated basis" and Yellow is "K-IFRS".
  4. Does S stand for Spring?

    Podcast · 78 comments

    John Sculley:

    "I think they're going through a very significant change now in terms of product cycles," Sculley explains. "Traditionally Apple introduces products once a year; now it's really introducing products twice a year. The complexity of that from a supply chain is immense, and Apple seems to be doing it well. So, I think that people are underestimating just how well Apple is run, and just how successful the company can be when it gets to that twice-a-year product introduction cycle."

    Former Apple CEO John Sculley: Apple is well-run | TUAW - The Unofficial Apple Weblog

    Suggesting that Apple is moving to a semi-annual cycle is a very provocative thing to say, but it's something I've also speculated is happening during a Critical Path podcast.  Sculley's comments prompted me to weigh the possible evidence that this is happening:

    1. All of the major products which Apple sells have been updated in the Fall. This is unprecedented. Not only were product launches scheduled in the spring, historically they had been spread throughout the year. The odds that they happen to coincide by accident are nil. Not only that but the move of iPad and iPhone and iPod and MacBook and iMac to launch all within Fall (once a year) seems risky because it leaves a vast gap for competitors to fill six months hence. Indeed, given the iPhone's launch predictability, many (most?) competing products already target launching in the Spring.
    2. Launch ramp for iPhone steeper than ever. The number of countries and operators launching the product in the launch quarter is nearly the entire distribution list. This is also the first time this has happened. Not only does it imply a very steep ramp, it indicates no channel fill will be happening past Q1. There will not be incremental sales to unserved customers as the fiscal year wears on. 
    3. Consumer anticipation. This year saw two quarters where sales were soft due to "product transitions" as awareness among the mass market of new product rumors caused growth to dry up. Too many potential buyers are now conditioned to wait for fall to buy iPhones thus sapping demand for half the year. Apple ends up with an inability to meet demand for half the year and a sales lull for the other half. Clearly this is suboptimal.
    4. Hon Hai production has shifted to locations closer to the sources of labor. This may not seem to be relevant but we have to appreciate that Apple makes up nearly half of Hon Hai's sales volume and hence labor demands. Until this shift, Hon Hai's production has depended on migrant labor which is difficult to manage. Moving production so that the labor is local means a steadier workforce with better economies from learning curves. However it also requires a more stable order book. Production for Apple has tended to be "bursty" with breakneck round-the-clock crush followed by periods of idle time and re-tooling. This is not only inefficient but it also creates strain and stress and lowers morale.
    5. Capital Expenditures de-coupled from volumes. This is a weak signal at this time and needs confirmation, but capital expenditures seem to be outpacing production. The recent bursts in CapEx may be transient or may have to do with tooling-up Samsung's replacements but it may also imply a move to a more rapid product cycle. A transition to a new operating model would require significant over-spending in advance of the shift.
    6. Rumors of 5S products in pre-production. This is the least valuable piece of evidence but it might indicate that the "S" variant is targeting spring launch. I should point out that the "facelift" model change is common practice at many phone companies. At Nokia the convention was to launch an "i" variant to a model before a bigger update. Even at Apple, the iPod was going through a re-fresh during February with a "Valentine's Day" variant being released. Then there's the case of the white iPhone 4 which seemed to take forever to launch but finally did so into an April time frame. Finally we just saw the iPad retina product go through a six month cycle.

    Admittedly, these are circumstantial pieces of evidence but they do corroborate Sculley's claim of a six month product cycle.  Put another way, if Apple is not switching to a six month cycle then there seems to be a lot of stress for no benefit.

    I would also add that this change in cycle time is an enormous undertaking. Since Apple is an integrated company, not only production but marketing, design, hardware and software engineering must be re-configured. To put it in perspective, when Ford changed its operating mode from producing one model to a flexible mass production method pioneered by General Motors, the company had to shut down for production for six months.

    The operational aspects are daunting and would affect almost all employees in the company. Therefore if it is happening it's also possible that there is some knowledge of this change dissipating outside the company, perhaps explaining Sculley's confidence in the claim.

    --

    Looking for more information on the renaissance of production and its the effect on the technology industries? Then come to Asymconf and take part in the debate.

  5. The mystery of Samsung Electronics SG&A

    Research · 40 comments

    Samsung Electronics' SG&A expenses are curiously high. Consider the following graph:

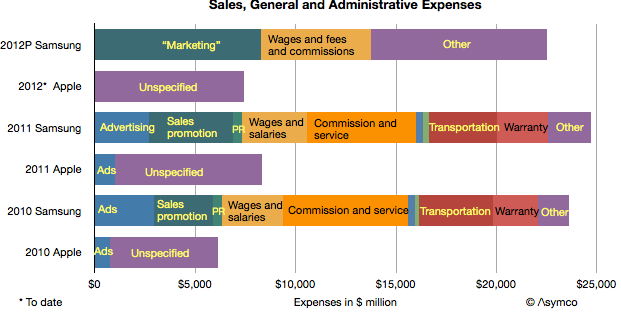
    It shows SG&A as reported by Samsung and Apple over the periods 2010, 2011 and the sum of the first three calendar quarters of 2012. Note that Samsung appears to be spending three times as much as Apple on sales and administration.

    The company offers a break-down of these SG&A costs and they are also shown (Apple does not provide a break-down except for advertising in its yearly report). The suspicion that something is not right comes from looking not only at the overall picture but the notion that Transportation, Warranty and "Other" for Samsung are higher than overall SG&A for Apple.

    Note that Apple's SG&A includes the cost to operate its retail stores. This includes the salaries and operating costs of over 300 stores.

    Considering that many of these costs are borne in the sale of products for consumers (and not borne in the sale of components such as semiconductors,)  the percent of sales of some of these expenses are:

    • Advertising: 3% of consumer sales
    • Sales promotion: 5%
    • Transportation: 4%
    • Warranties: 3%
    • Public relations: 0.5%

    Excluding wages and commissions shows a total of 15.5% of consumer sales paid in SG&A expenses. Apple's total cost for SG&A was only 6.5% overall. Advertising was 0.78%.

    I also added to the graph data for 2012 (through first three quarters.) It looks like Samsung SG&A will easily reach $30 billion this year, staying at three times Apple for another year.

    I don't have any explanation for this disparity.

  6. Samsung Electronics Segment Revenues and Operating Income in Context

    Research · 42 comments

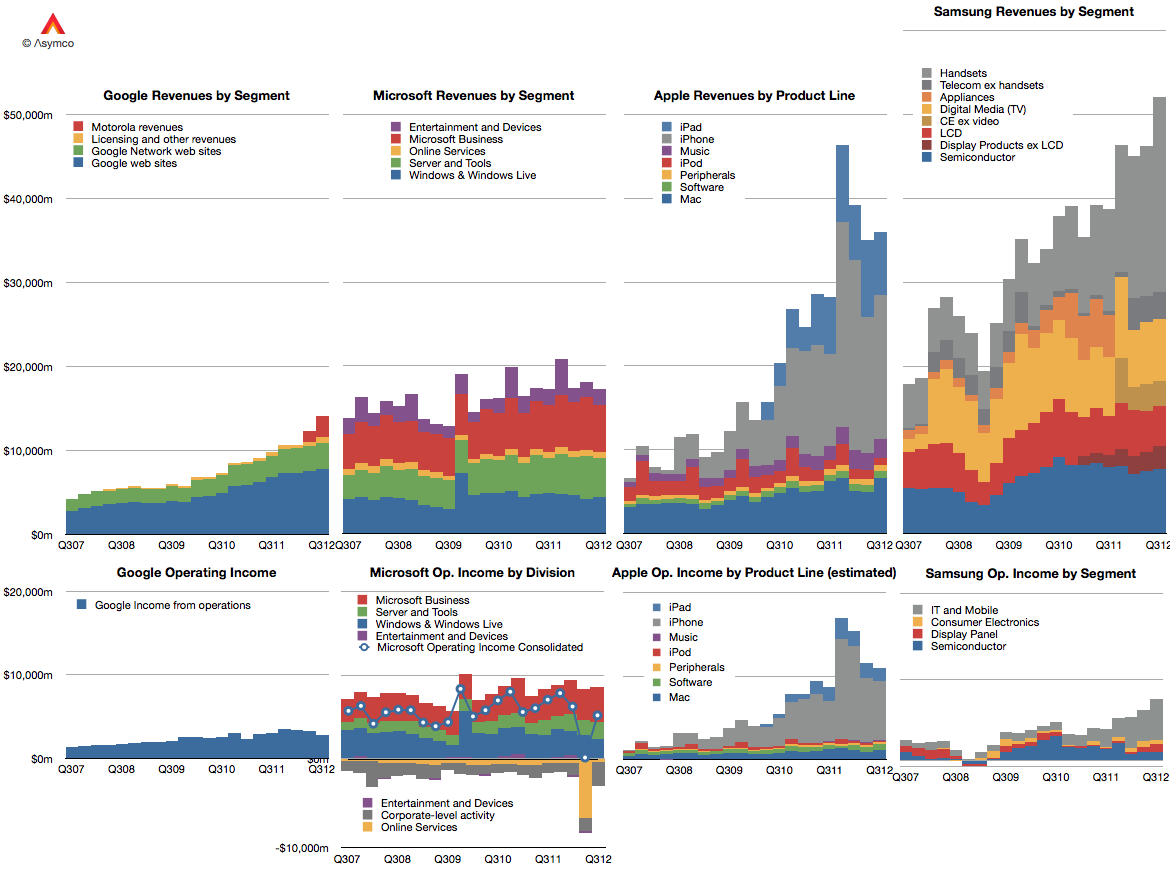
    As first introduced last week, Samsung's revenues have grown primarily due to the expanding volumes of smartphones. In today's post I convert the revenues and operating incomes to US Dollars and compare them to a set of companies.

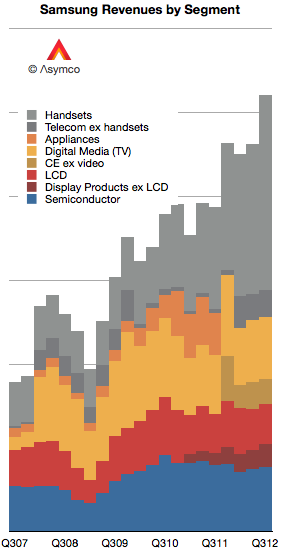
    First, I should note that Samsung has changed both the designation of its divisions and the way it reports revenue. Broadly speaking, Samsung Electronics has four major divisions:

    1. Semiconductors. This includes memory products as well as systems such as CPUs.
    2. Display products. This used to be called "LCD" but has been re-named Display Products.
    3. Telecom. This is mainly mobile phones but includes additional products and services for telecom operators and PCs. The division has recently been re-named IM (IT and Mobile communications).
    4. Consumer Electronics. This group has changed names from Digital Media and Appliances to CE. The majority of sales value comes from televisions but also includes consumer electronics and appliances.

    The company further combines Semiconductors and Display Products into a group called DS (Device Solutions) and Consumer Electronics and IM into DMC (Digital Media & Communications).

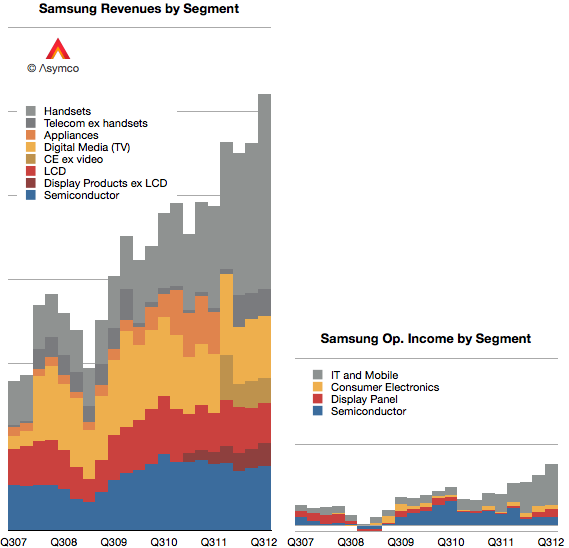
    I tried to reconcile these various nomenclatures with color coding in the following graph. Semiconductors are blue, Display components are red, Consumer Electronics are Yellow and Mobile are grey.

    Each gridline represents $10 billion.

    One more point to note about revenue recognition: Relatively recently the company has switched from reporting consolidated revenues to gross revenues. This means that current sales include inter-segment sales. So, as much as it is possible, the data above shows sales from division to division as well to external customers.

    When it comes to reporting operating income, the company offers four segment values: Consumer Electronics (Appliances, TV, "Digital Media"), IT and Mobile (including mobile phones), Display Panel (formerly LCD), and Semiconductor.

    I used the same color coding to show the income values in the same scale as the graph showing income:

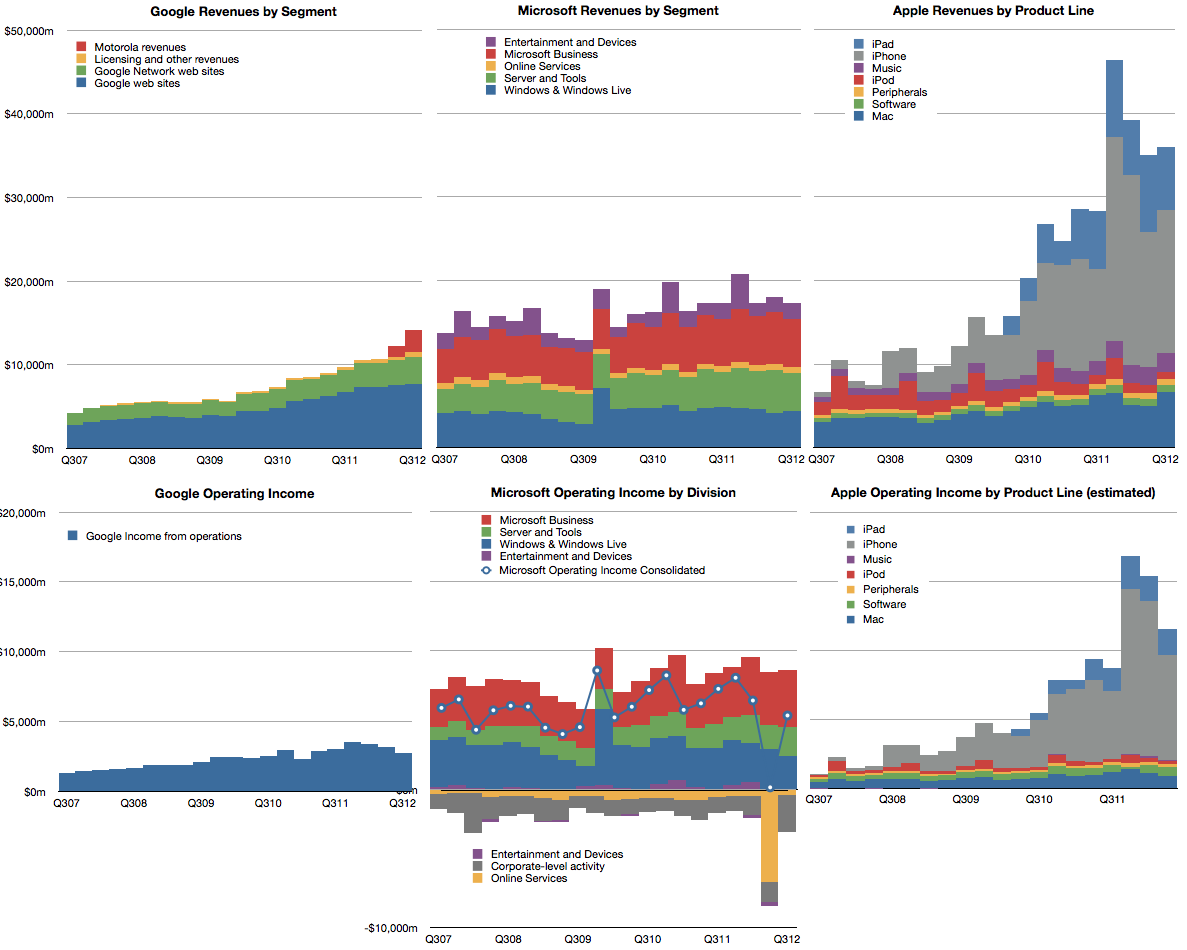
    It's now possible to compare Samsung Electronics with Google, Microsoft and Apple in terms of divisional (as a proxy for product-line) revenue and profitability over a five year period.

    At this time, a portion (majority?) of Samsung's grey area in the operating income graph represents the vast majority of profits obtained from Android across the entire ecosystem.

  7. The cost of selling Galaxies

    Research · 234 comments

    In the post "Google vs. Samsung" I compared the profits of Google and Samsung Electronics' mobile (aka Telecoms) division. It showed how Samsung has grown its mobile business to such a degree that, if sustained, could conceivably influence the way Android is controlled.

    However, we should not analyze Samsung's mobile group in isolation of the entire company. Samsung relies on internal transfer of technology and capacities of production which are quite unique for device vendors today. In other words, Samsung is a relatively integrated enterprise. Understanding the whole is necessary before understanding the part.

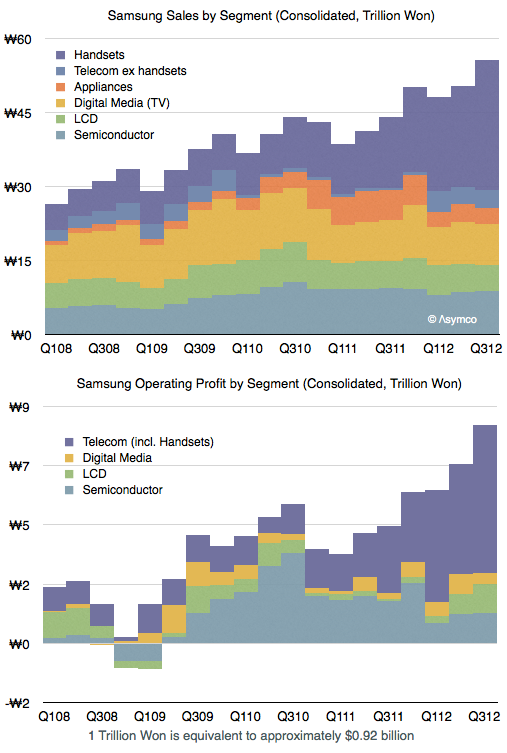
    The following graph shows the sales and operating profit for  Samsung Electronics as a composite of its divisions since early 2008.

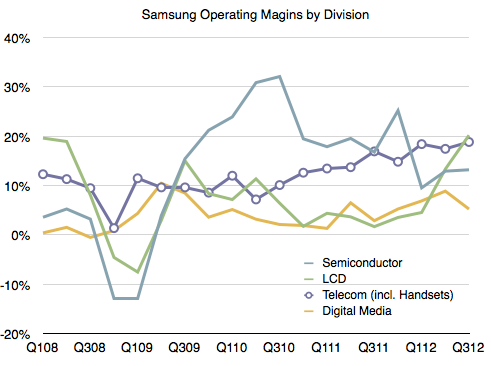
    As one would expect, the mobile group (Telecom) is the source of both top and bottom line growth. The group has also been leading in terms of margins and increasing those margins steadily. 

    The margins averaged 11% during 2007 and 17% during the trailing four quarters. This 54% increase in margin has been matched by a 55% increase in average selling price (from $151 in 2007 to $234 in the latest quarter).

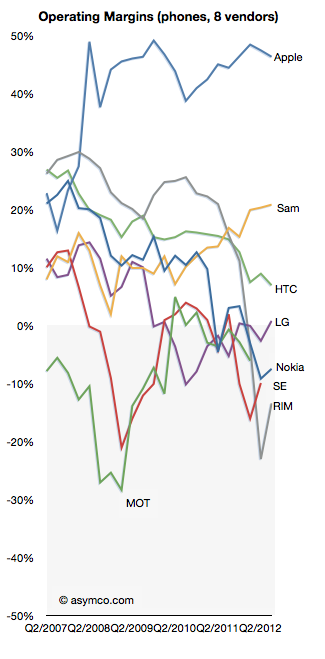
    One could argue however that a 17% operating margin from a group that is now leading in volume and price is still a bit weak. At its peak Nokia enjoyed a 25% operating margin, RIM 30% and HTC 27%. Apple's iPhone operating margin is around 45%.

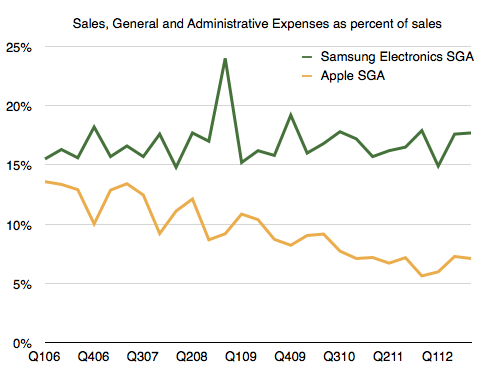
    I think a large part of the margin story is a relatively high level of spending on SG&A (Sales, General and Administrative) which includes advertising, sales promotion and commissions. In the case of Samsung Electronics, as sales has grown these expenses have grown in proportion. As a percent of sales SG&A have held relatively steady at around 17%.

    Note that as Apple's sales have grown its SG&A has grown less rapidly resulting in a smaller percent over time. We might see Apple's SG&A drop to 5% during the present quarter, an all-time low.

    So one of the more remarkable aspects of Samsung's success has been their willingness to increase promotional spending. Considering that their other divisions don't require as much "marketing expense" (semiconductors, LCD certainly, and TVs and Appliances to a lesser degree due to a smaller sales growth) we can imagine that the vast majority of this promotional spending has been in support of their mobile brands, Galaxy in particular.

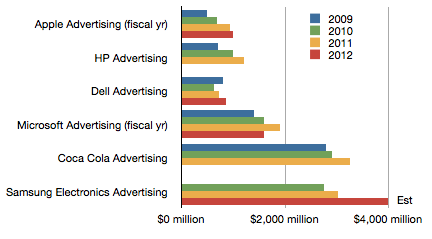
    In fact, we can obtain advertising spend data from annual reports.

    The chart above shows comparable ad spending from a cohort of technology companies as well as Coca Cola and Samsung Electronics.

    It might be surprising to note that Samsung spends considerably more than Apple and Microsoft. But it also spends more than Coca Cola, a company whose primary cost of sales is advertising.

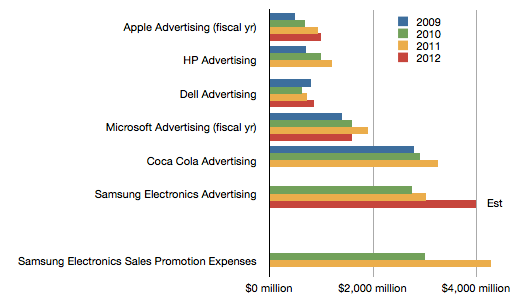
    However, advertising is not the only form of promotional spending. Samsung also pays commissions and "sales promotion". The following chart shows the value of these sales promotions relative to the ad spending budgets above.


    We don't have data on the current year since that is released after year's end, but it's interesting to note that promotions cost more than ads, which themselves are substantial relative to other companies.

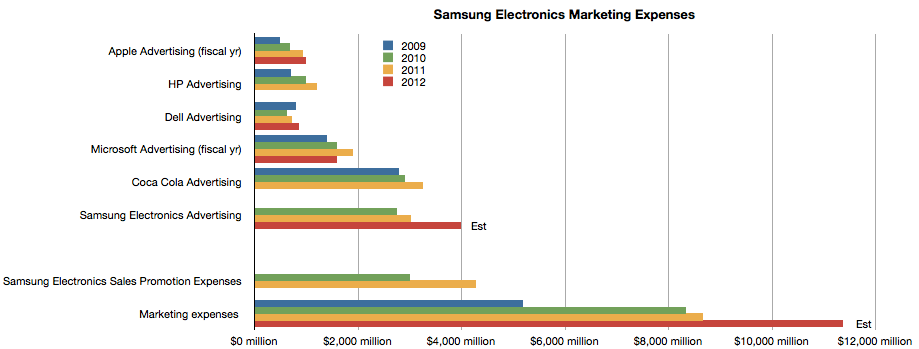
    The company also reports "Marketing Expenses" every quarter[1]. These figures appear to be the sum of Ad spending, Sales Promotions, Public Relations and a portion of "other" expenses as a part of SG&A.

    When considering all marketing expenses, Samsung Electronics' sales efforts begin to look quite astonishing.

    ---

    Notes:

    1. The data used in the latter three charts are available as a Google spreadsheet here.
  8. The Android engagement paradox

    Research · 180 comments

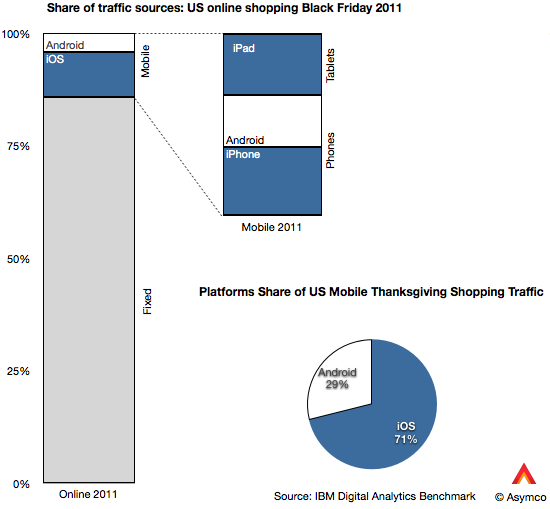
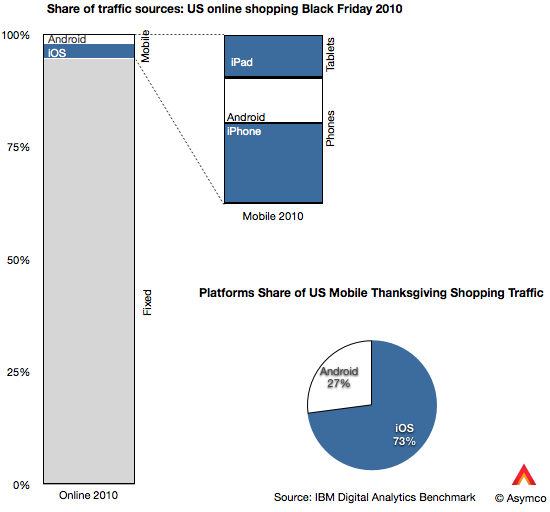
    IBM's Digital Analytics Benchmark reported US Black Friday sales and the news is reasonably good. Overall online sales grew by 17.4% while mobile grew to make up 24% of traffic.

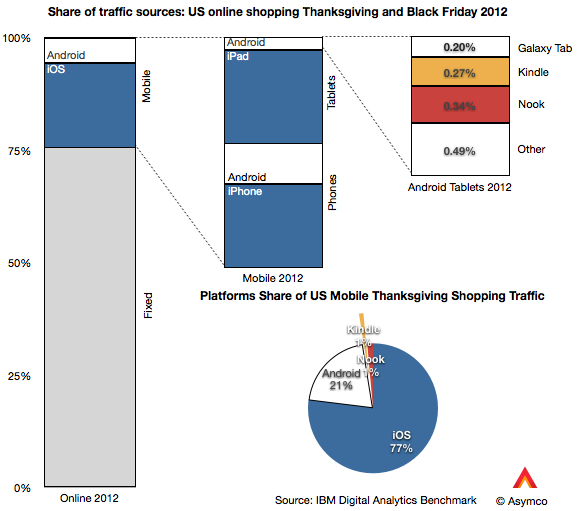
    The data goes further to show the split between device types. I illustrate this split with the following graphs:

    Of the 24% of traffic made up by mobile devices, phones contributed 13% and tablets 11% (or 54% and 46% of mobile respectively). Of the phone traffic, iOS devices were about two thirds of traffic and Android one third. Of tablet traffic, iPad was 88%, Kindle and Nook were 5.5% Galaxy Tab was 1.8% and other tablets were 4.4%.

    Overall, iOS was 77% generated mobile traffic and Android (excl. Kindle, Nook) was 23%.

    That's an interesting snapshot of the consumption of mobile devices, but is there a pattern here? I also took a look at the same data from 2011 and 2010.

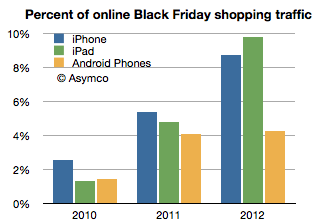
    Besides the pattern of significant mobile growth (from 5.2% to 24% of online in two years) there is the curious effect of iOS growth outpacing Android growth. Android went from 1.43% of Black Friday shopping traffic in 2010 to 4.92% in 2012. In same time iOS went from 3.85% to 18.46%. In other words, while Android is up by a factor of 3.4, iOS is up by a factor of 4.8.

    The reason is evident in the graphs above: the iPad is now the predominant mobile shopping device. You can observe the pattern in the following graph:

    Two years ago the iPad was trailing Android usage but this year it was more than twice Android usage. Curiously, the iPhone seems to also be pulling ahead of Android.

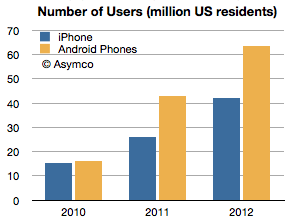
    Curiously because the number of Android users in the US has gone the other way. That data is available from ComScore, though only for phones. (ComScore data for periods ending November each year, Nov 2012 is my estimate):

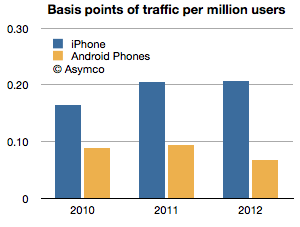
    Having the number of users and the traffic allows us to measure consumption per capita, so to speak. That is, the percent of traffic per device user:

    The ratio shown is basis points of usage (1/100 of 1% of shopping traffic) per million users of smartphones. iPhone users are about three times more engaged in shopping with their devices than Android users. Two years ago the ratio was two to one.

    Overall iPad is changing shopping habits, but it has a near monopoly in its form factor at this point. The bigger question is what is causing phone users to behave differently based on the devices they own. The phone market is more mature and has had several years of competition to be able to discern differences in platforms. The pattern is pretty clear with respect to Android: engagement is down as ownership is up. This pattern has not exhibited itself with iPhone, even though it has had a longer time in market.

    Of course, one would expect that later adopters would engage less, but I find it surprising that US Android users would behave so differently only two years after the platform began to be widely adopted. That pattern is not happening with iOS even after five years and certainly not with the iPad which is about as old as most Android brands.

    This I consider to be a paradox: Why is Android attracting late adopters (or at least late adopter behavior) when the market is still emergent? We've become accustomed to thinking that platforms that look similar are used in a similar fashion. But this is clearly not the case. The shopping data is only one proxy but there are others: developers and publishers have been reporting distinct differences in consumption on iOS vs. Android and, although anecdotal, the examples continue to pile up.

    And engagement is not a frivolous platform attribute. It is highly causal to success because it correlates with all cash flows associated with ecosystem value creation. Especially when a platform like Android depends more on engagement than "monetizing hardware."

    I'm not satisfied with the explanation that Android users are demographically different because the Android user pool is now so vast and because the most popular devices are not exactly cheap. There is something else at play. It might be explained by design considerations or by user experience flaws or integration but something is different.

    ---

    If you'd like to learn more about the Asymco method, come to Asymconf. The next Asymconf will be at the end of January near San Jose. Not only will you learn about how mobile is disrupting computing, you will also get to hobnob with the likes of Om Malik, Jean-Louis Gassée and Michael Lopp.

  9. The cost of mobile clicks

    Research · 26 comments

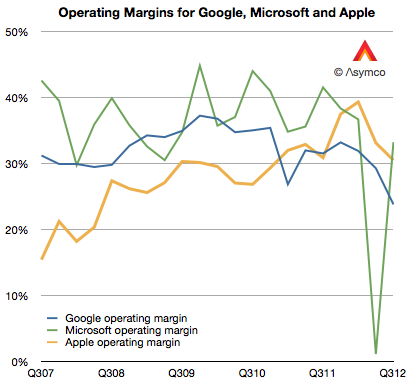
    Google's operating margins fell to 23.7% last quarter. This level is the lowest I'm aware of. From 2007 to late 2009 margin went from about 31% to about 37%.  Then from early 2010 until present they fell. The history is shown the the following graph.

    [I included Microsoft and Apple operating margins for comparison.]

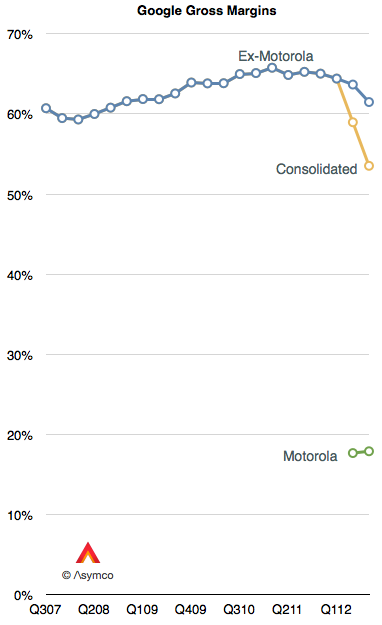
    Some of the recent decline is due to the inclusion of Motorola into consolidated earnings. Motorola gross margins were therefore 18%. Excluding Motorola, Google gross margins (Revenues-Cost of Revenues) were 61.5% of revenues.  However, even excluding Motorola, Google's core margins dropped.

    One reason for the decline in core margins is the reduction in cost per click (-16% for search and -18% for network sites.) This is what Google pays to partners for access to traffic. The trend is not new. It was first discussed in January.

    The bottom line is that an individual click is not as valuable as it used to be. Would a larger volume of mobile usage be a reason? Google won't say.

    The overall result in the bottom line is shown below. Microsoft and Apple are again put forward for comparison.

    Reminder: Register for Asymconf.

  10. Google vs. Samsung

    Research · 283 comments

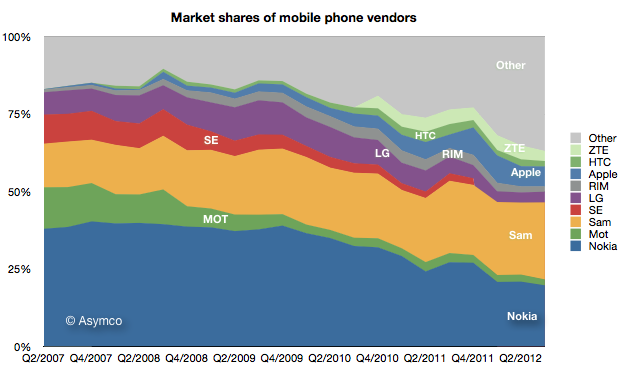
    Samsung's recent success in mobile phones has been spectacular. It overtook Nokia for the top spot in overall unit sales. 

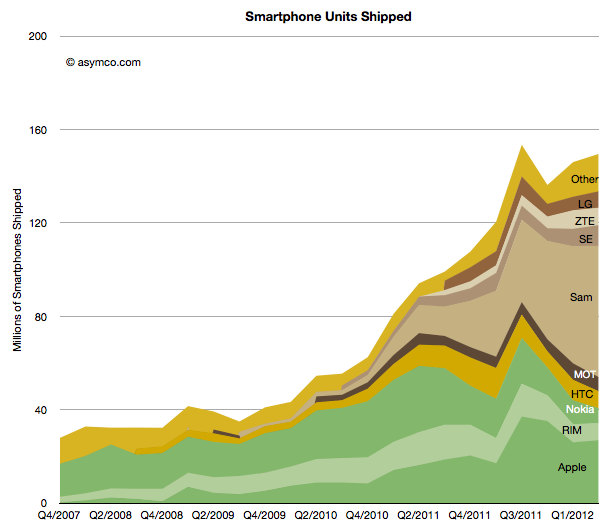
    It went from having almost no smartphone sales to selling over 50 million units per quarter in a matter of two years.

    It now accounts for nearly 40% of all industry profits.

    A key decision which made this success possible was to shift its portfolio to smartphones and to offer a large variety of such phones.

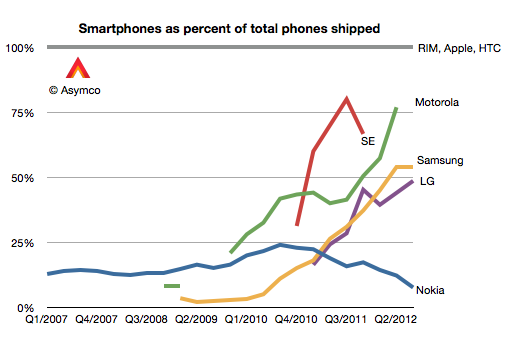
    In Q1 2010 only 3% of the phones Samsung sold were smartphones. In the latest quarter the ratio was 54%. 

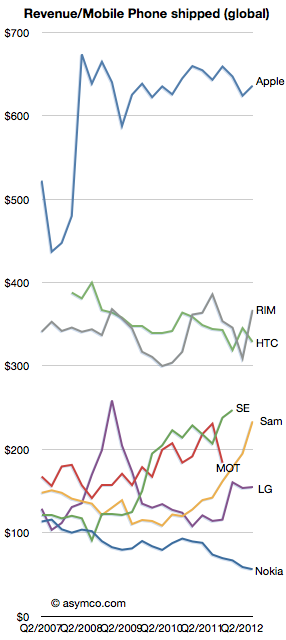
    As a result the average selling price more than doubled, from $115 to $234.

    Profit margins also soared in proportion: from 12% to 21%.

    All this plus an overall growth in volumes from 64 million to over 100 million per quarter has meant that the company is raking in enormous profits. Not only did it overtake Nokia, the market share leader for 14 years, but is making more profits than Nokia ever did.

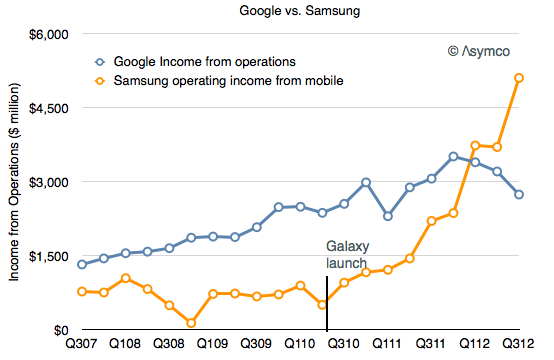
    So much profit in fact that it has overtaken Google's decisively.

    The reason I point this out is that Samsung's success is dependent on having ridden on the back of Android. Samsung's ascent can be precisely timed to their adoption of Android. The groundbreaking Samsung Galaxy launch was the Galaxy S which shipped in June 2010.

    Meanwhile, indications are that "mobile" is causing a contraction in Google's margins.

    If nothing else, Android has created a very interesting industry. There are many questions of course: Is Samsung's trajectory sustainable? Why aren't there other vendors successful with Android? Why isn't Google successful with Android? Why isn't Google's Motorola successful with Android? What would happen if Samsung soaks up so much profit from mobile that it's in a position to acquire Google and control the trajectory of their enabling platform?

  11. Minding the store

    Research · 59 comments

    Apple's Retail head was recently replaced. The hire seems to have been a mistake dealt with quite swiftly. It is tempting to think that the firing of a manager is due to a failure in their performance, measurable in quarterly reported metrics. But this is not often the case. It may be true of sales or some operations, but most strategic management decisions take months to make and years to implement before you can have the luxury of measured results. And even then the dependencies of performance are many and outside the control of specific managers.

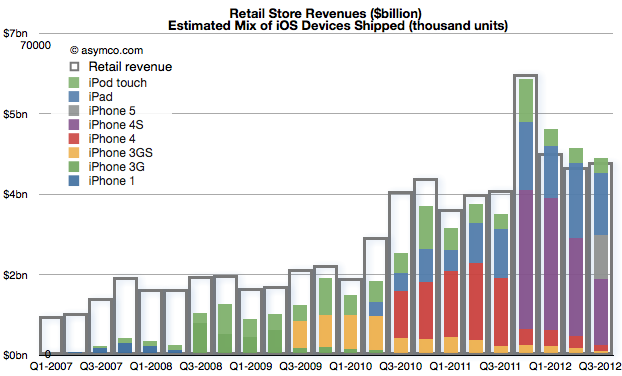
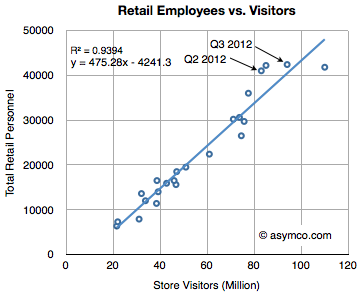
    John Browett joined Apple in April and left in October. A mere six months. How did Apple retail perform in those two quarters? Very well actually. Which is to say, as well as it has previously given the overall performance of the company. The correlation can be shown between store revenues and iOS device shipments:

    Store visits increased to 94 million in Q3, second only to fourth quarter of 2011. The growth was 21%. Year-on-year growth in revenues was about 17% for both quarters, in-line with company growth. Profits grew 5% in Q2 and 25% in Q3.

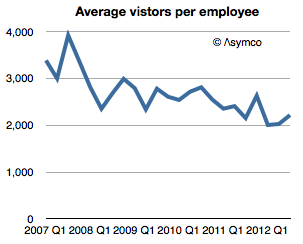
    Average visitors per employee picked up slightly but remained largely unchanged since 2008.

    Employment increased in proportion to visitors, consistent with previous quarters.

    Store openings were 9 and 18, above the recent past but consistent with historic trend.

    [It should be noted here that the lead time for a store's opening is longer than the development time of an iPhone so whatever was opened was probably planned in 2010 or so.]

    Based on employment time and cost, the "performance" of the stores were not divergent from the overall historic trend (and product launch cycles of the company.)

    If stores did not show any effect of poor management, then why was Browett fired? I suspect it had mostly to do with a mis-match of understanding of the job the stores are hired to do by consumers and by Apple itself. The company treats the stores as a sales channel but also as a communications channel with its customers. Recall when Steve Jobs was asked why they stopped attending MacWorld (and any other trade show) he answered that they had the dialog they needed with customers through their stores making.

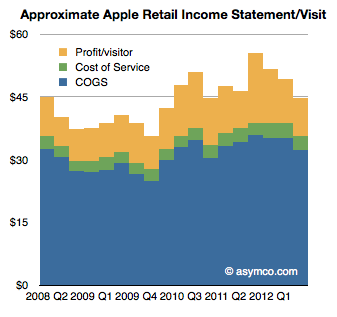
    That dialog is engaged between 100 million visitors and 42,000 employees every three months. The average time spent with each visitor is 13 minutes. Each visitor also leaves about $45 behind. As I put it earlier, the stores are the face of the brand.

    Whoever is in charge must understand this special relationship. The surprise for me is not that Browett was fired, but that if he did not understand this relationship, how was he ever hired?