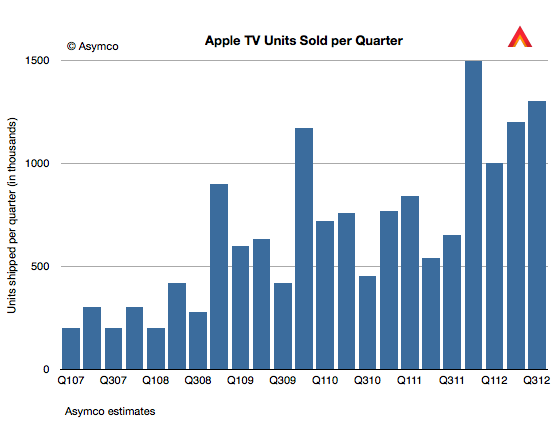
For Q4 we sold 1.3 million. That is up over a 100% year-on-year. We sold more than 5 million Apple TVs during the fiscal year, which is almost double the previous year, when we sold 2.8 million. So the business continues to do very well, but if you look at the size of revenue of this business versus our other businesses, it’s quite small and so it still has the hobby label, however it’s a beloved hobby and we continue to focus on it and continue to believe there is something more there and continue to pull the string to see where it takes us.
Five million Apple TVs per year is a half-billion dollar hobby. As such it quintupled from the first year (calendar 2007).
The value for hardware is, of course, only a part of the story. It is accounted for as part of peripherals revenue and amounts to 18% of total peripherals revenues. Last May I estimated that the installed base of Apple TVs was 10 million. I'd estimate current total to be closer to 12 million. Assuming $10/month in content sales per Apple TV results in $1.4 billion of which 30% might be retained by Apple as revenue (agency fee).
The yearly revenue thus could be as high as $900 million. Therefore it seems plausible that Apple TV is on the verge of being a billion dollar business.
It may be a hobby to Apple but I've noted before on my podcast that Apple TV is a mirror image of the Kindle business model: Sell hardware at low margins and experiment with content sales as a profit model. The "hobby" moniker means that it's not a big business but how big is Kindle or Nexus 7 for their respective owners?
Kindle may sell up to 10 million units at nearly break-even but is the average revenue per user much higher than Apple TV? What about the Nexus franchise? Is the loss on hardware leading to revenue to Google+OEMs above $10/month? I doubt it.
I can't be precise or absolute about it since we don't have data from Amazon or Google about units or from any of the platforms' margins or attach rates for content, but I'm doubtful that they qualify for more than hobby status according to Apple's definition. At least in terms of profitability, Apple TV could be bigger than either Kindle or Nexus tablets.
The iPad grew shipments at 26% y/y but "sales" as measured by sell-through were up 44%. Detail from Tim Cook's discussion:
"The June to September [sequential change] was 17 million to 14 million… as we had talked about in the July call, the June quarter contained 1.2 million increase in channel inventory and so … the comparison looks very different than our reported [shipment] numbers do… On a year-over-year basis, because of the year ago quarter having also a channel inventory build as we stock the channel to the [proper] level, the sell through year-over-year actually grew 44% and so the underlying sell through was extremely strong."
Sell-through, (or "sales" vs. "shipments") is a much better indicator of demand, obviously. Also see transcript for explanation of sequential decline (educational buying).
44% is not spectacular but it places the growth far more comfortably in the "high" bracket than the 26% units and 9% revenue growth that shipments data would indicate.
In the parlance of developers Apple keeps "throwing exceptions." This quarter the iPad surprised with a significant decline in sales growth. I placed a table showing the sales growth for this quarter as well as the previous 22 quarters at the bottom of this post.
Here is a quick review of each line:
The iPhone returned to a more customary growth rate (which I rate as Very Good--above 50%). The quarter was bound to be quirky due to it being both a transition quarter and a launch quarter. The launch of the iPhone 5 came quite late but not too late to make a contribution. It was also widely rumored and anticipated so there was slowing of the previous generation product. I expect growth to accelerate further in the last quarter of the year.
The Mac turned in a commendable 6% revenue growth (1% unit growth) on the back of the new 15" Retina screen MacBook. The average sales price increased sequentially and the mix of portables to desktops reached a new high of above 80%. More about the Mac will be written in a future post.
The iPod continued its decline. The 26% sales decline was in-line with other non-launch quarters. The company tipped its hand and let us know that iPod touch now makes up 60% of iPod volumes. At 3.2 million iPod touch units, it's a significant iOS contributor but still a declining number.
The iPad was painfully underperforming. With only 9% revenue growth, it was a complete reversal of the torrid growth of the last two years. Management blamed both anticipation of a new product and a reduction of inventory ahead of refresh of the larger screen retina. The only silver lining was that the average price decline was moderate (down about $3/unit). Overall, I'm very disappointed with the pause in the product but the new mini could change the character of the product dramatically in a way similar to how the iPod mini turbo-charged the iPod line.
iTunes had a very good quarter. It's the perennial growth engine with the most consistent performance throughout the time period shown. It was the second fastest growing line item firmly in the "High" growth bracket.
Peripherals, including Apple TV had a moderate quarter. Management revealed that about 5 million Apple TV units shipped in the fiscal year. That adds up to a half-billion dollar revenue business. Peripherals had $2.8 billion over the same time frame so Apple TV was about 18% on a yearly basis. This does not include content revenues.
Software had a modest growth of 22% but has come to be the high end of the range. Since changing the way it prices OS X updates, the era of Apple software windfalls is over. Still, at nearly $1 billion per quarter it's nice pocket change, especially as it's nearly all margin.
The overall top line (net sales) was a bit improved sequentially (+4 points of percent) but still in the "transition quarter" range of moderate growth. The company may be shifting its launch cycles and as a result we're seeing a break in pattern. As pricing for iPhone and iPad did not change very much the slowing of top line growth is entirely due to a unit shipment reduction. Again, the primary cause is transitions in multiple lines simultaneously.
The bottom line (earnings) followed the same pattern as top line (slight sequential increase in growth). There was a slight attenuation of margins (gross margins are down to 40%).
Overall, the quarter was not up to the recent level of performance for Apple. Growth was overall "moderate".
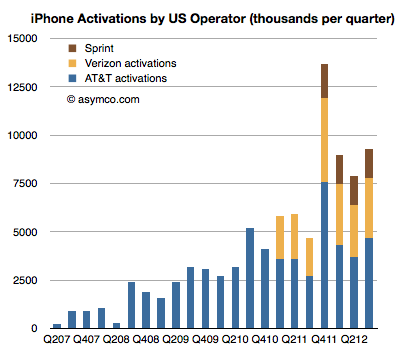
AT&T, Verizon and Sprint have all reported the number of iPhone units shipped in Q3 2012. The history of the these sales is shown in the following graph:
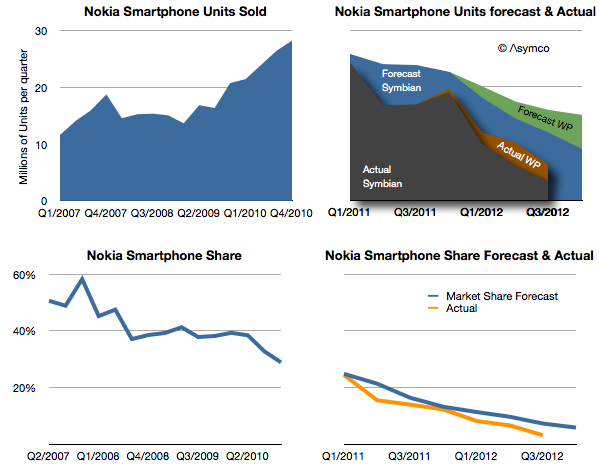
Days after Nokia announced the end of life for the Symbian platform I wrote a post titled Who will buy the next 150 million Symbian smartphones? The reference was to claim by management that before there would be a complete transition to Windows Phone, 150 million legacy Symbian phones would be sold, keeping the company financially stable before the new ecosystem took root.
I reproduce the original forecast I made below with the addition of what actually happened.
[Note that the Actual stack area chart is independent of the forecast area chart as indicated by shading.]
My forecast in early 2011 was based on the 150 million Symbian phones being sold over a two year transition period. The implication with the forecast for Windows Phone was that this would still lead to a difficult contraction of volumes.
As it turns out, only 96 million Symbian devices have been sold in the 7 quarters since the platform was deprecated. It's unlikely that there will be ever by 150 million units sold as last quarter only 3.4 million shipped. In any case, management has already retracted that claim.
What about the Windows Phone forecast? It turns out that by this point in time (Q3 2012) I had expected Lumia shipments to total 9 million. Actual shipments reached about 9.5 million, so not bad. However, the market grew faster than I had expected and overall Nokia smartphone market share turned out to be slightly lower (6.3% in Q2 vs. 10% estimated.)
The just ended quarter shares are not yet available but it's quite possible that overall Nokia smartphones could be well below 5%, and may slip to 3% during the transition period.
My warning in February 2012 was that 150 million Symbian units would not ship since I expected there would be a stigma associated with the products among distributors, even if consumers were fine with them (which they weren't).
The public execution of Symbian (and any other alternative being developed inside Nokia) will probably be a classic case study in disruption management. To wit: even if a platform needs to be led out to pasture, there are ways of managing decline other than suicide. Nokia's failure is not so much having chosen the wrong alternative to Symbian, but having chosen exclusively.
However, there's a twist. The company did not accept exclusivity of one supplier without a concession: In exchange for exclusivity, Nokia negotiated $250 million every quarter in the form of "platform support payments" from Microsoft. Nokia has to date received over $1 billion in such payments. (For the last quarter that amounts to $86 for each Lumia phone shipped.)
The tragedy comes from this $1 billion/yr not being enough. The foregone revenues from Symbian (assuming they had been able to maintain the decline to the level of 150 million units that they had originally forecast) would be about $9 billion. This means that had Nokia not knifed Symbian and had sold the shortfall units at an average price of $200 they would have received an additional $9 billion in sales. Furthermore, assuming a margin of 33% for those units, Nokia received from Microsoft one third from of what she gave up for exclusivity.
In other words, the net cost of the Microsoft exclusive relationship is at least $2 billion in operating profit.
This turns out to be the difference between being profitable and being distressed.
We will never know if this scenario would have ever happened, but the forecast management made 21 months ago suggests that at least they thought this was what they were going to get out of the bargain.
This reminds me of another article posted around the same time.
Marc Andreessen famously coined the phrase "software is eating the world." It's an apt observation. If you look back on the history of computing you're likely to measure computers sold or devices sold or users harvested or productivity gained. These things are measured because they can be measured. But the greatest cause of value created and captured has been the development of software. An ephemeral product whose value is often ignored in analytical discourse.
Software is not easily measured and it's not easily valued due to its intractable nature. Firstly, because businesses that make software tend to have weird cost structures--absurdly high fixed costs and operating margins: They operate without income for years and then suddenly are massively profitable with a minimal set of resources. They have a non-linear, "big bang" trajectory.
Secondly, software companies tend to capture revenues from something other than the direct sale of the good. Software is rarely sold. Services sometimes are sold on the basis of software but more likely audiences for services are sold to a set of bidders, or revenue is obtained in even more circuitous ways.
Thirdly, because there are curious multi-sided markets for software platforms. Charlie Kindel hints strongly at how difficult it is to understand the dynamics of software platforms. There is the prospect of lock-in of users and data. There are relationships to nurture with developers and there's the principle of an ecosystem that creates network effects. The virtuous/vicious cycles are non-linear and unpredictable even for the experts who have been at it for decades (e.g. Microsoft).
Given these difficulties, software is seldom seen as the core value proposition for a particular business. But make no mistake about it, Apple, Google, Microsoft, Facebook and Amazon are all software companies. They "monetize" or integrate software differently but software is causal to their profits. Their use of software has also made them all disruptive. Software enabled the disruption of consumer electronics, retail, computers, advertising and broadcast media.
But we have not seen anything yet. There is another class of software that is poised to lay waste to a new set of industries. The lowly app coupled with cloud-based services[1] is the termite that is set to eat the foundations of the largest of the industries still standing.
Consider the following:
Games. A software industry in itself, the app versions are attracting non-consumers and eventually will get good enough to absorb all usage and profits. Games merged with "entertainment" concepts will lead to new models of user recreation leading to new global brands that could challenge even Disney.
TV. As apps come to the big screen TV will never be the same. Not only will show creators build directly for an audience but advertisers that currently sponsor shows will produce them instead and package the result as an app.
Shopping/dining/entertainment/hospitality are changing with location services and with novel "bits to bricks" purchase options (e.g. PassBook). Increasingly services will exploit handheld devices to enable product discovery--the main job retailers are tasked with.
Communications. The observation that "phone" is just an app and that messaging can be done in dozens of ways depending on message, relationship, context or even custom is possible because apps conform to the user's needs rather than the user conforming to the tools they get from the network service provider.
Although these are enormous opportunities in themselves, this is in addition to several industries that are already crumbling (photography, book publishing, to name two).
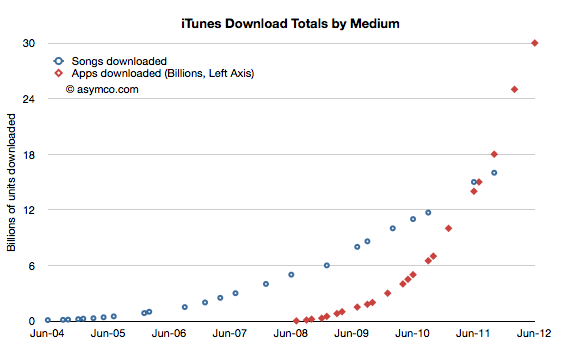
I don't need to rely on prose alone to make the point. A graph can also lend a hand.
Consider that Apple's App Store and Google Play together have had over 50 billion installs in less than four years and that the number of users of apps is at least 750 million. Furthermore, consider that apps have moved from a smartphone phenomenon to tablets and even PCs using OS X or Windows. Within one year these software capsules are going to be in use by one fourth of the global population.
Nothing has this kind of reach or engagement, not even browsers. What makes the app disruptive, even ahead of a browser-based service, is that it includes incentives for developers (or, more precisely, app producers) to get paid and to have a relationship with the buyer. These two value propositions, in isolation or in combination, are available to millions and consumable by billions. The most democratized market that can be imagined. An unbounded set of producers and an unbounded set of consumers and a persistent connection after the purchase with nothing in between them except a payment mechanism
The world has never seen such an opportunity.
The consequences are unforeseeable. Apps are a form of software that goes beyond its ancestral "application" as a product and as a business model. It's the software that will take in and assimilate everything in sight.
---
Notes:
I have a simple rule to distinguish between an app and a service. If you have to supply a username and password to an app, it's a service.
It takes money to make money. That's a cliché. But it's also true. The interesting question is how much can be gained from how little.
In previous articles I explained how Apple's expenditures of capital for equipment used in manufacturing affects their output of products. The relationship between capital in and product out should stand to reason.
The more surprising aspect of that analysis is that we get to know in advance how much Apple spends (since they tell us their budget a year before it's spent.) and therefore it becomes possible to get a rough idea of how much they will produce. And since demand has generally been higher than supply we can get an estimate of how much Apple will sell.
The only missing piece to this logic chain is to estimate how much will shareholders benefit from the capital expenditure. I'll try to establish the relationship through a build-out of graphs.
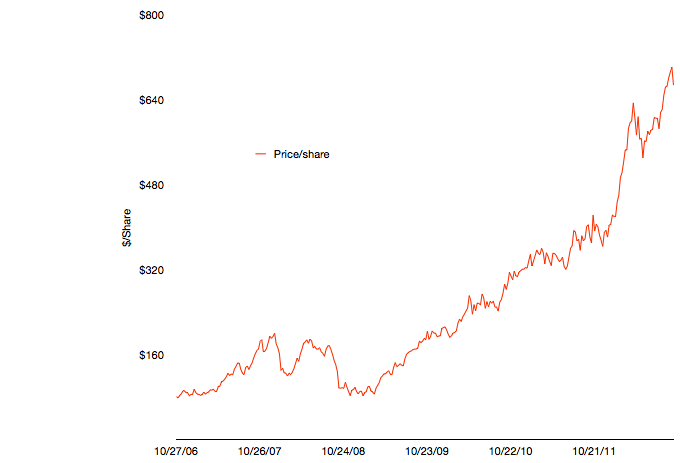
The first graph shows Apple's share price at weekly resolution.
The time frame stretches back six fiscal years. The time span includes some dramatic periods including the financial crisis and the launch of the iPhone and iPad.
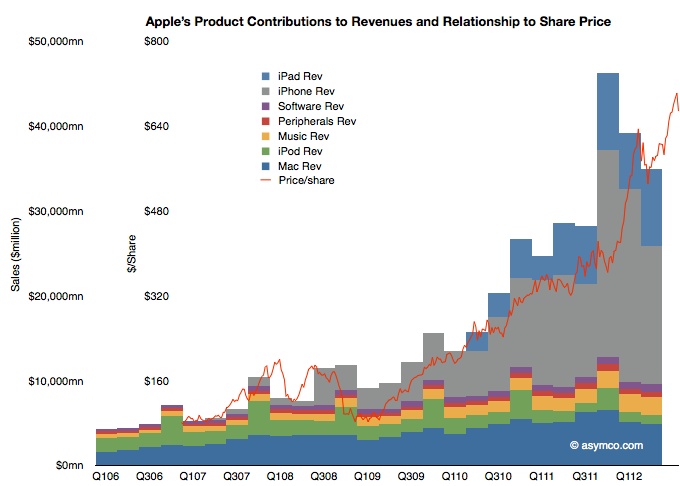
To illustrate the effect of the iPhone and iPad on this share price appreciation, I've overlaid a quarterly resolution graph showing revenues over the same time period with each product line shown separately.
Note that I've indexed the vertical scale to match approximately the highest peaks of both graphs. The two axes scales are shown separately on the left.
The relationship between growing sales and growing share price is plain to see. Note that the iPhone and iPad account for the vast bulk of sales growth and hence they are mostly responsible for the share price appreciation. Again, this should not be surprising. The scale gives an approximation of the relationship where $50 billion in quarterly revenue roughly yields a share price in the $700 to $800 range.
As I've shown in the last post on forecasting production using CapEx (focus on the last chart) iOS device shipments (mostly iPhone and iPad) correlate with capital expenditures in the previous quarter. Using the historic relationship, the next two quarters could see a significant increase in iOS unit production. The sum of the low end of the range implies about 163 million units.
If the relationship is therefore CapEx -> Production and Production -> Share price appreciation, then the transitive implication is that CapEx -> Share price appreciation.
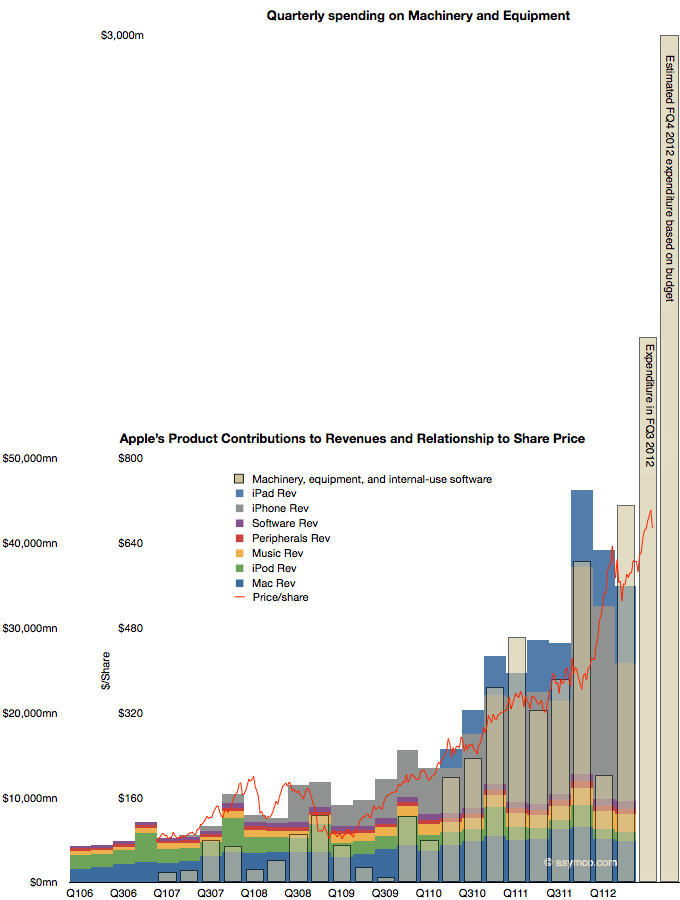
That relationship would be illustrated as follows:
The CapEx data shows the offset to the right due to the relationship with production being time shifted by one quarter. Recall that expenditures are booked ahead of output and therefore we have this apparent view into the future.
The fourth fiscal quarter's spending has just ended and the output will be produced during October-December period.
The obvious question is whether production will increase in response to spending (as it has in the past), or, put another way, will the stacked bar areas follow the beige bars and, furthermore, will share prices follow production (as they have in the past) and thus the red line will follow the beige bar.
It takes money to make money. The relationship seems to be that $1.5 billion of CapEx per quarter yields a share price of $800. With spending reaching $3 billion per quarter will the share price reflect a similar ratio?
Tim Cook is quoted as having said the inventory is not only evil but that it's fundamentally evil.
With just-in-time production inventory can be reduced, at least work-in-progress inventory. Unfortunately inventory cannot be completely eliminated. The fact remains that you sometimes need to stockpile product for launch and need to have some on hand depending which way it's sold. There is also substantial channel inventory (which is off Apple's books but still evil) that needs to be in the hands of distributors.
Tight inventory management has become a characteristic of Apple and that contributes to getting ranked number one in Supply Chain Management. So we can expect that Apple runs a tight ship. In fact we have evidence of this through the ability to track our purchases from when they ship out of a factory in China all the way to our homes.
This tracking in itself shows that when product is in high demand production is initiated on direct consumer orders not just in response to maintaining a level of inventory. So with that in mind, we can revisit the question of how many iPhones 5 the company has produced.
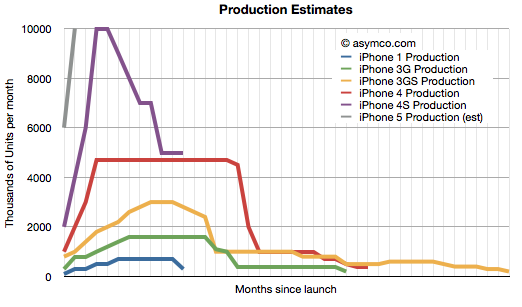
First, we need to step back and recall the method for analyzing production. I built a model which attempts to show what a typical production run for an iPhone model would look like. I first published the process in early 2011. It used the historic data from iPhone 1, 3G and 3GS to try to predict iPhone 4 production. I've updated the model to show what that would look like today.
The assumptions driving the model are:
There has to be some inventory on hand during any given month (i.e. inventory cannot be negative.)
Inventory has to be kept as low as possible. Preferably below one full month of shipments in the month. This rule needs to be broken on launch as there has to be an attempt to meet first month sales, which are usually substantial.
There is an assumed mix of older variants equal to about 10% of current model sales.
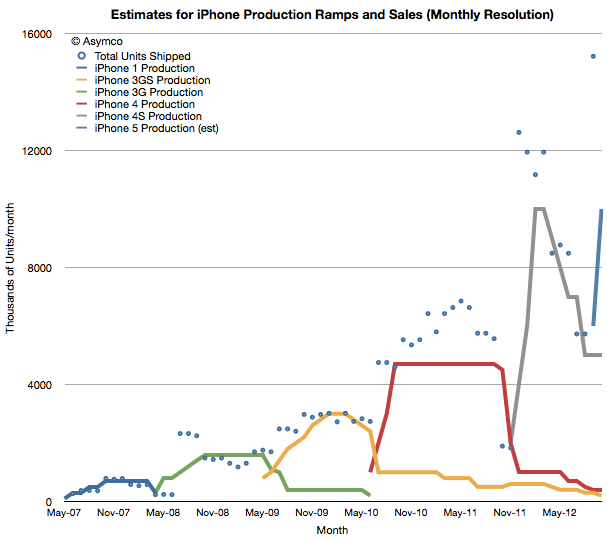
The results are shown below.
The solid lines are estimated production and the points are actual shipments (the resolution is monthly so quarterly shipment data is averaged over the months covered by the quarter and normalized for the number of days in a given month). Note that each product ramp differs slightly in shape but that overall there is a doubling of peak production. This is shown more clearly in this view where each production ramp is indexed to the same starting point.
The ramps roughly match the shipment data which assumes the JIT production method is being used. Note also that the start of production was roughly double that of the previous product run--consistent also with the spending on capital equipment (Machinery and Equipment as part of PP&E). Note also that the iPhone 4S was more "peaky" with a shorter maximum run than the 4 but that the 3GS also was peakier than the 3.
The iPhone 5 production, shown in grey, assumes 10 million units sold in September and a quicker ramp to maximum run rate. The need to have units on hand led me to assume 6 million units were produced in August and none prior to that. We don't yet know peak production or duration of peak production but my guess would be that peak will be well above 4S level, perhaps 15 million per month and that the run will be longer than the 4S.
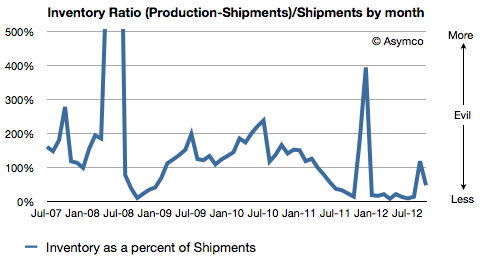
The maximum inventory on a monthly basis runs to about 6 to 7 million for the iPhone 5 but as a percent of total shipments, I'm assuming the performance is improving over time. The following chart shows this ratio:
For the sake of argument, I would create an equivalency between this ratio and the amount of evil present. My model is based on many assumptions and a mostly a work of (informed) fiction but it would not surprise me that the amount of evil is decreasing.
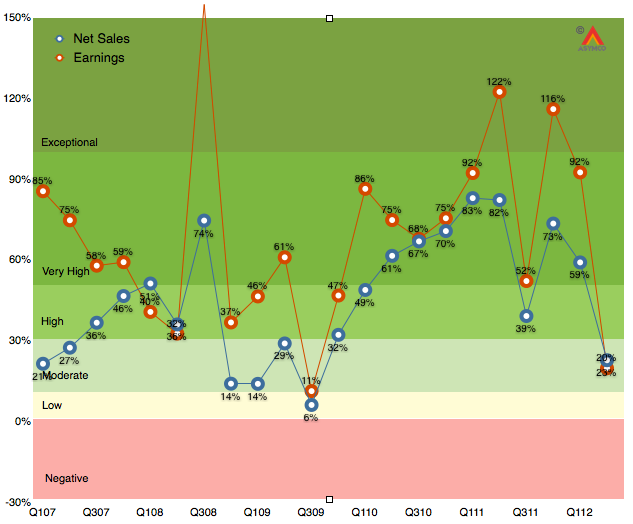
As the chart below shows, the last quarter (second calendar 2012, third fiscal 2012) was disappointingly moderate with 20% earnings growth and 23% net sales growth.
It was the first quarter since the iPhone launched that earnings growth has fallen into moderate (below 30%) territory. Much of that disappointment (to me) was the relatively low performance of the iPad following a launch quarter. The iPhone was weak as well, though that was expected. As I said last quarter, the iPhone is still the most important component but the iPad is becoming increasingly decisive in overall performance. In fact, I’m projecting that the iPad will have the same revenues as the iPhone had one year earlier.
The iPhone is going to be extremely difficult to project. On one hand we have the launch of the i5 which will account for about 10 million units in the quarter, on the other, chances are that sales were very weak prior to the launch as purchases were being deferred even more than during the last quarter.
So with these very meager clues, here are my estimates for the quarter (with y/y growth in parentheses):
iPhone units: 27.8 million (62%)
Macs: 5.6 million (15%)
iPads: 18.8 million (69%)
iPods: 5.6 million (-15%)
Music (incl. app) rev. growth: 40%
Peripherals rev. growth: 10%
Software rev. growth: 15%
Total revenues: $39.5 billion (40%)
GM: 42%
EPS: $9.75 (38%)
This earnings value would imply a trailing twelve months’ EPS of about $45.2. At the current price of $697/share the P/E would be 15.4. Cash and equivalents will probably increase to $125 billion or $131/share. Excluding cash, the P/E would be 12.5.
[Update. The EPS figure above includes a tax rate estimate of 30%. Company guidance was 25.5%. Using the company's guidance yields an EPS of 10.43. TTM EPS becomes $45.9/share and at $697 the PE is 15.2. At time of this update the share price has fallen to $665 and thus the pro-forma trailing P/E ratio is 14.5).]
We don't want to just make a new phone. We want to make a much better phone.
- Jony Ive, video at iPhone 5 launch event
Disruption theory has taught us that the greatest danger facing a company is making a product better than it needs to be. There are numerous incentives for making products better but few incentives to re-directing improvements away from the prevailing basis of competition.
This danger is more acute for technology companies. Coupling incentives with the speed of improvement in various technologies (aka Moore's law) means that over-service can come suddenly and more quickly than warnings from the marketplace. A product can tip from under- to over-shooting the market within one product cycle. One year the product is under-performing and trying to catch up to the competition and the next it's superfluous and commoditized. The dilemma is compounded by the cycle time of development which can span multiple product cycles.
Therefore, how to tell whether a product is over-serving a market is one of the most important and frequently asked questions I get asked. It's easy to see over-service in the rear view mirror when looking at a multi-year pattern. The trouble is that by the time you see the data, it's too late. How do you tell you're on the cusp of good enough, subject to imminent disruption before you get there?
I consider measuring a product's absorbability to be a marketing problem. The marketer's job is to read the signals from the market[1]. Determining absorbability comes down to reading two market signals, both of which must be met before green-lighting an improvement: (a) a product's improvements must be used and (b) a product's improvements must be valued.
If a product's improvements are not used and the buyer will not pay more for them then they are not being absorbed and the effort to develop the improvements should be redirected.
Now the problem becomes one of measurement. Of the two, utilization is easier. Data can be gathered on whether a feature is being used. Research methods exist to tell if a feature would be used even if it's not available[2]
The more difficult assessment is that of the value of a feature. You can usually only tell value by trying to price it and watching what happens. For example, you add more speed/memory/capacity and try charging more (or the same) for the product. The acceptance will be measured by sales growth and will give you an indication of whether these improvements are valuable.
If you have to add features and drop prices at the same time then it's likely that the market does not value the improvement.
But this is extremely risky. You need to wait through a sales cycle and iterate through a development cycle before you have an answer. In a space where competitors are placing opposite bets, the experiment fails even if you get the data.
How can you structure a value measurement experiment without wasting an opportunity?
Rather than dealing with hypotheticals, let's use the iPhone as a test case. As Jony Ive states, the focus for the latest iPhone was to make it better. Is this improvement absorbable? What happens if Apple's bet on being better is wrong?
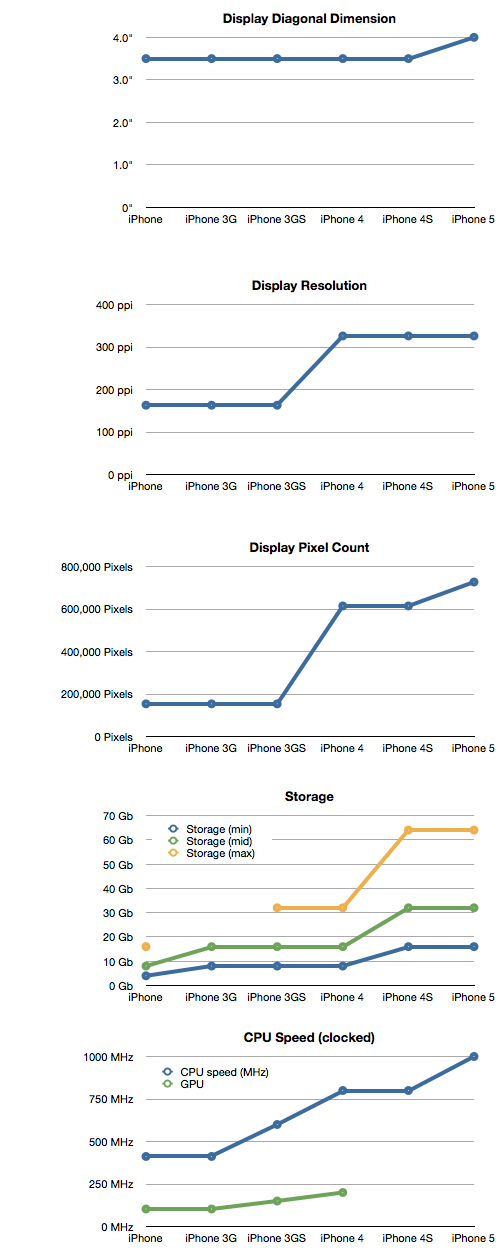
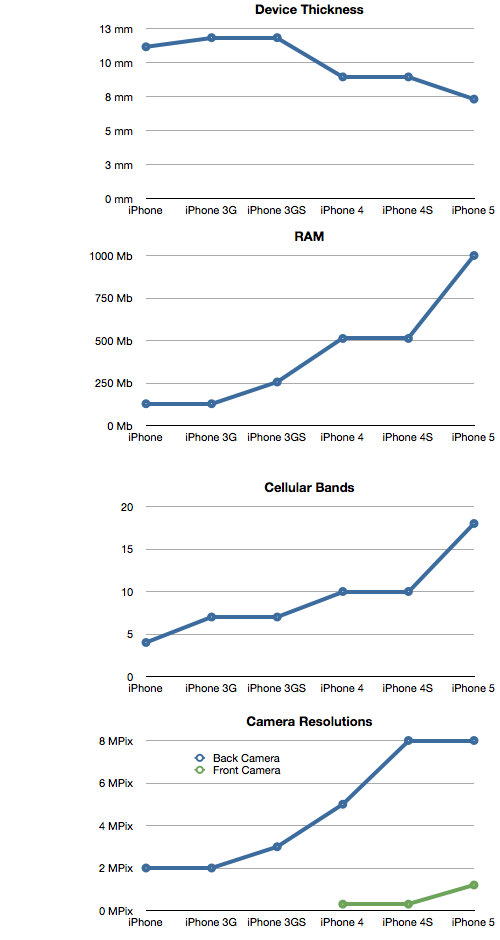
First, we can confirm that the iPhone has been on a trajectory of getting better and that those improvements have been absorbed so far. We can measure the history of performance of the product (roughly doubling every year) and we can also measure proxies for performance as I have in the following charts:
As the product has been improved along these dimensions, sales have increased and prices have held steady (even rising occasionally.)
The question is about the future: what about the latest "5" variant?
The clue to this experiment is the presence of a control group. We could test the question of absorbability by keeping a version of the product which did not improve (or got cheaper) and measuring whether it performs better vs. the "improved" version.
Of course, this is exactly what Apple does with the n-1 generation products. By ranging products which are older and at lower price points it can measure whether the improvements are valued.
If sales of the n-1 variant were to increase relative to the new version then they can understand when they are at the point of good enough. The experiment is brilliant because the margin on the older products is maintained even at the lower price point.
We don't have public data on the performance of the old vs. the new but some studies show that, at least in some markets, the older variants have, so far, been a minor part of the sales mix. The CIRP study from early this year showed that about 90% of holiday iPhone sales in the US we for the latest (4S) variant. If this pattern persists globally and for the 5 then the improvements can be said to be valued.
If the new features (as represented by the metrics charted above) also get broad engagement--data which Apple can easily obtain--then the iPhone 5 can be declared not good enough. The company can then comfortably work on improving it further.
---
Note that the marketer's job is to listen not to talk.
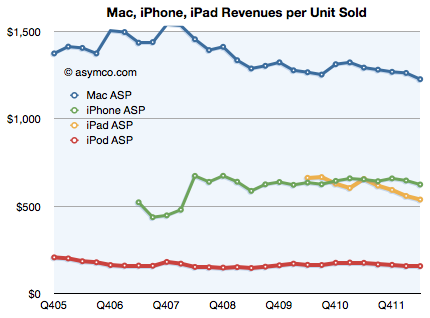
The most remarkable thing about the iPhone as a technology product is that it has been able to maintain pricing stability for over five years. As the following chart shows, the revenues per unit sold for the iPhone (as reported by the company) have held even as volumes grew exponentially.
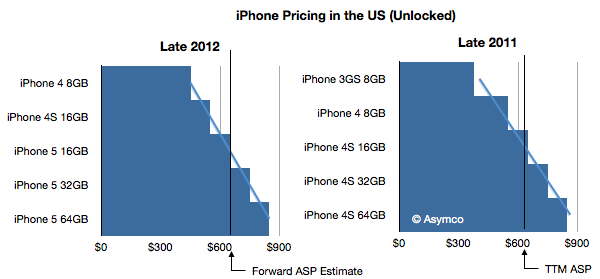
The latest version of the product should see no significant change in this pattern. I show below the price spectrum of the iPhone as available unlocked in the US (therefore assuming no sales taxes or VAT and no subsidy). I also highlighted the average revenue per unit from the latest four quarters.
The only difference between 2011 and 2012 is that the lowest priced variant is now $450 vs. $375 a year ago.
Without knowing the split between products, it's hard to tell how much impact this price increase will have. Note that the average price was very nearly the same as the 16GB variant ($643 ASP vs. $649 16G pricing). Assuming equal volumes for each variant, the average pricing for 2011 would have been $634. Therefore the actual ASP was only $9 higher than average pricing.
If we assume the same for this year (equal split between variants + $10) then the average price could rise to about $660. That would be a slight increase but it would be multiplied by many more phones sold.
In fact, going from $634 to $649 and selling 200 million units would imply an additional $3.4 billion in revenue.