Asymco

Asymmetric Intelligence

revenue

  1. The end of the dedicated portable device

    Research · 67 comments

    On October 27th, Nintendo published half year results for the fiscal year ending in March 2012. Management stated that the company lost over $900 million with a negative outlook. Nintendo cited weaker than expected sales of Nintendo DS hardware and 3DS software and Yen appreciation as the main reasons for the miss. Is this the end of Nintendo?

    Before we look more closely, here is a quick summary: The company is exclusively involved in selling game hardware and software. Their console platform is the Nintendo Wii, which will be followed by the Wii U late in 2012. The Nintendo DS and Nintendo 3DS are the company’s portable game consoles. The Wii and the DS are nearing the end of their product cycles. On the software side, the company is known for gaming titles such as Super Mario and Zelda. Nintendo also pioneered the licensing model to allow third-party developers to produce games for its hardware products.

    A closer look

    The good news for analysts is that Nintendo publishes their estimates for hardware and software unit sales. This allows us to measure management predictive accuracy. The red line (management forecast) should be as close as possible to the dark green pillars (realized unit sales in the fiscal year).
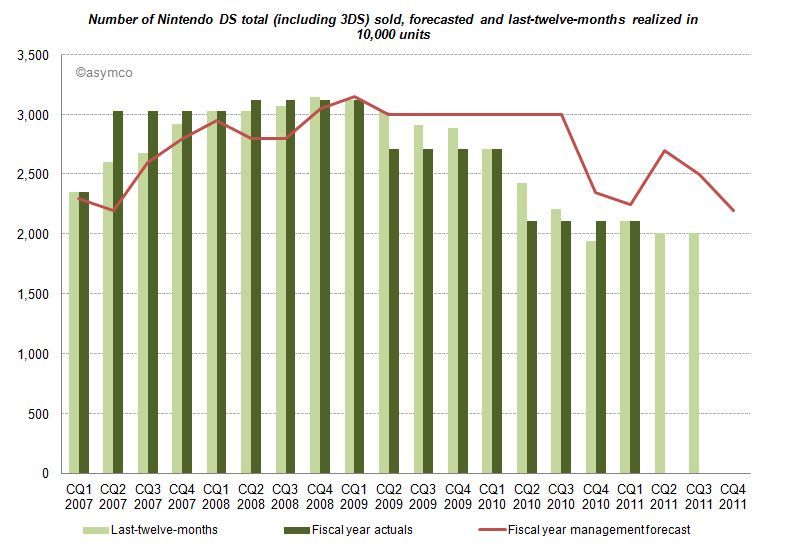
    Until CQ1 2009 devices sales grew in excess of forecasts. A similar pattern can be found for consoles and game titles. After Q1 2009 forecasts have been always higher than results, and more worryingly, the deviation between forecast and sales is widening. Management missed and lowered forecasts for two consecutive years. Management's hope for an increase on the back of initial 3DS sales in the launch quarter (CQ1 2011) did not come to pass and they subsequently lowered forecasts again in the following two quarters.

    Looking at all categories, management lowered forecasts almost continuously. The deviation remains the largest in the portable hardware business segment indicating that management was largely surprised about the development.

    What caused this reversal of fortune?

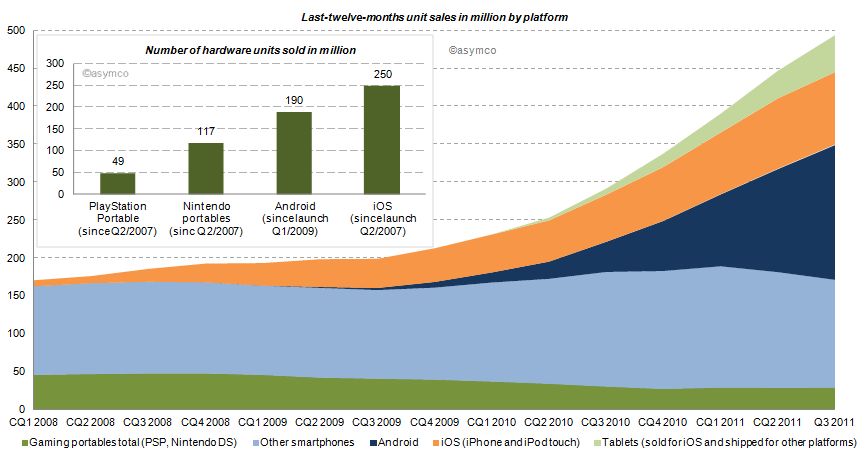
    Two years earlier the iPhone had launched and by CQ1 2009 iOS reached an installed base of about 38 million, half the number of Nintendo portables in the same period. Furthermore, in CQ1 2009 Android phones came to the market. Smartphones (light blue area of the chart below) sold before (and after) the debut of iOS, but the iPhone redefined the category and an avalanche of smarter phones running iOS and Android followed (blue and orange area). Portable gaming devices from Nintendo and Sony declined ever since: 17% in 2009, 31% in 2010 and already 16% in the last twelve months.
    How do the game players stack up?

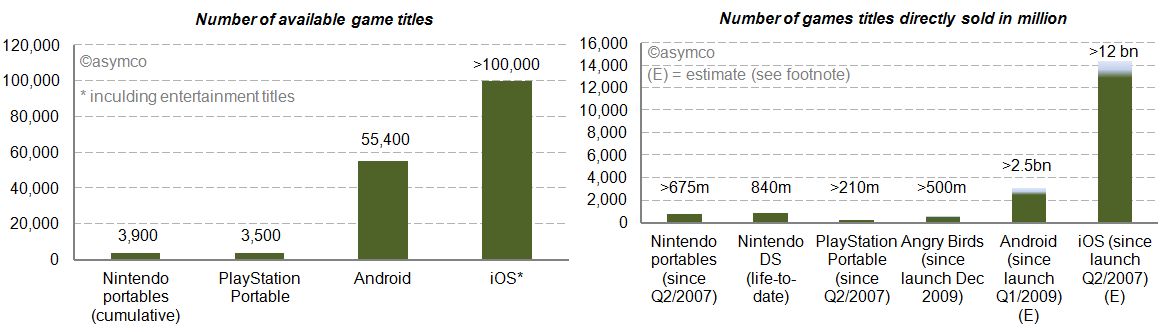
    We already looked at the installed base in the chart above. iOS and Android have outsold Nintendo portable units by a factor of 2.1x and 1.6x. Furthermore, we can see (in the charts below) that the two main mobile platforms have 14 to 26 times more game (and entertainment) titles available. Nintendo and Sony also publish unit sales of directly sold software titles. For Android and iOS we know the cumulative app download statistics. By taking the share of Septembers’ paid and free app downloads as a proxy, we can conclude that also by this measure Android and iOS dwarf Nintendo and Sony [1]. The reach of iOS and Android is further underlined by the more than 500 million downloads of Angry Bird game titles - first released only two years ago - for any platform having sold more than twice the amount of Sony’s cumulative portable game titles and almost as many as Nintendo’s cumulative games titles since Q2/2007.
     

    Who else has skin in the game?

    Besides Nintendo, Sony, Apple and Google, who else is making a push into mobile gaming? Before investigating, let’s first have a closer look at Sony. Sony, just like Nintendo, is also active in stationary gaming segment with the PlayStation franchise. The Sony group also has access to entertainment most notable through Sony Pictures Entertainment and Sony Music Entertainment. Furthermore, Sony recently decided to buy Ericsson’s stake in the mobile phone joint-venture Sony Ericsson and is making a push with Android to bring its gaming titles as a differentiator for its own products to the platform. And the other major suspects? Microsoft, also active in the stationary gaming segment with its Xbox franchise, is pushing to bring the Xbox experience to mobile phones with Windows Phone. Amazon has retailed software and games for years and has started to distribute software and games via direct download on its own Kindle devices but also for the Mac. On the Kindle, Amazon is relying on a forked Android version on which it leverages its eBook and other entertainment assets. And then there is Facebook, a social network that wants to be on any platform or device. Out of 800 million users, 350 million access Facebook via a mobile device. Around 50% of Facebook members play games on the desktop. With Project Spartan, Facebook is aiming to bring the desktop experience to the mobile device including a stronger focus on gaming and video.

    The competition between Apple and Google is already asymmetrical. Including the other contestants in the competitive landscape reveals Nintendo’s key weaknesses in the portable gaming market: attraction as a platform for developers in terms of ease and reach, pricing of hardware competing with operator-subsidized mobile phones and the jobs-to-be-done or value preposition. The new generation of mobile devices is standing against Nintendo’s dedicated approach. Although slowly adding features such as a browser and “app store” to its portables, Nintendo devices fall short in the variety of jobs-to-be-done compared to smartphones, let alone making a call.

    Average selling prices and financial impact

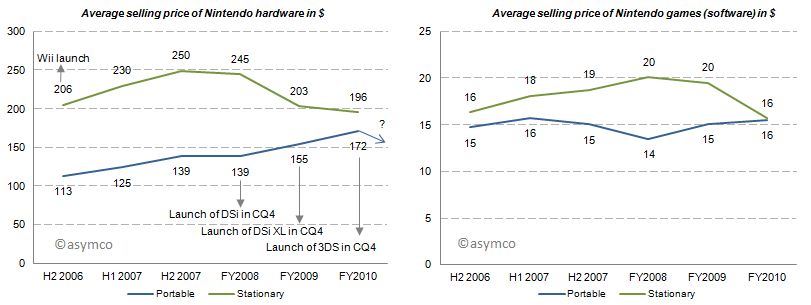
    With this market pressure one would imagine that average selling prices decreased for Nintendo portables. But for the last three fiscal years average selling prices for portables have increased, all things equal, mainly due to new product launches. Game title’s average selling prices have remained relatively flat. Note that these are wholesales prices for hardware and a mix of retail and wholesale prices for games. In 2011, for which we do not have data yet, the price of the newest portable, Nintendo 3DS, was lowered from its U.S. debut of 320 250$ in February to 170$ in July which will have a negative impact on ASP going forward.
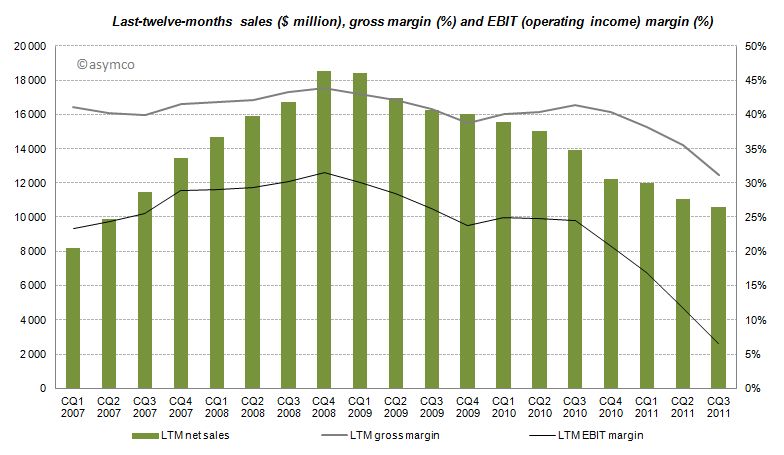
    The effects of Nintendo’s rigid strategy and the fast changing competitive landscape are manifested in the devastating financial performance over the recent quarters with LTM sales, gross margins and EBIT margins declining starting from CQ4 2008 and even accelerating to decline after CQ3 2010.
    Furthermore, even though the company has recognized its own difficulties, Nintendo has no intention of adjusting its strategy:

    CEO Iwata on the question of whether Nintendo plans to bring its game library to other platforms:

    This is absolutely not under consideration. If we did this, Nintendo would cease to be Nintendo. Having a hardware development team in-house is a major strength. It’s the duty of management to make use of those strengths. It’s probably the correct decision in the sense that the moment we started to release games on smartphones we’d make profits. However, I believe my responsibility is not to short term profits, but to Nintendo’s mid and long term competitive strength.

    Although realized and obvious, the disruption’s invisibility is often manifested in the paralysis of the incumbent.

    Conclusion

    According to Isaacson, Steve Jobs apparently always worried who could eat Apple's lunch. The lunch of the iPod, he concluded, was ripe for mobile phones. Subsequently, Apple entered the mobile phone space. Google followed. Since then more powerful mobile phones have eaten the lunch of the dedicated gaming device. The jobs-to-be-done and their priorities in people’s life have not changed, but the tools people use to get them done have. Permanently.

    ---

    Notes:

    1. Estimated by multiplying total cumulative app downloads with September’s share of game downloads: For iOS ranging from 72-80% based on Top 150 free and paid app downloads, for Android ranging  from 38-47% respectively. This is a very crude estimation, but the gist of it is that 4% for iOS and 11% for Android game downloads as percentage of cumulative app downloads would outsell Nintendo.
  2. Pac-Man

    Research · 51 comments

    I recently posted a comparison between the profit capture of phone vendors in 2007 and the most recent quarter:

    The idea was to show what a disruption looks like. A phenomenon where an entrant with none of the advantages of incumbency takes the profits away from companies privileged with ideal market access and knowledge.

    The view of profit shift is the ideal view since it shows the "bottom line" impact and thus the denouement rather than more nuanced sub-plot. However, we don't always have access to profitability data. Sometimes we only have access to revenue estimates.

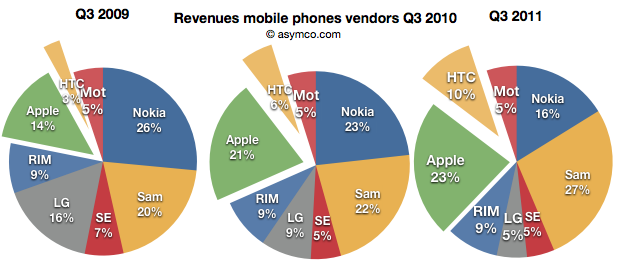
    Fortunately revenues have a similar story and are often a good proxy. Consider how the evolution of revenue shares occurred in the same market:

    Revenues for Apple and HTC combined doubled from 17% to 33% for the third quarter over three years.

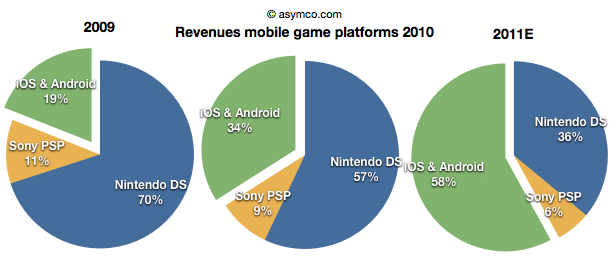
    Note the similarity between this evolution and that in the mobile games market (data courtesy of Flurry):

    The increase of revenues fro iOS and Android games nearly tripled over a two year period. Although we cannot say the same for profitability as the profits are not comparable since they allocated differently between platform and developer depending on platform, we can say that iOS is certainly driving vastly more value than Nintendo.

    Sony and Nintendo may take some comfort from their console businesses which have not felt the same impact from mobility, but one wonders how long those franchises will last. Using an iPad with screen mirroring to a large screen TV already shows promise.


  3. Apple's Income Statement at a glance

    Research · 19 comments

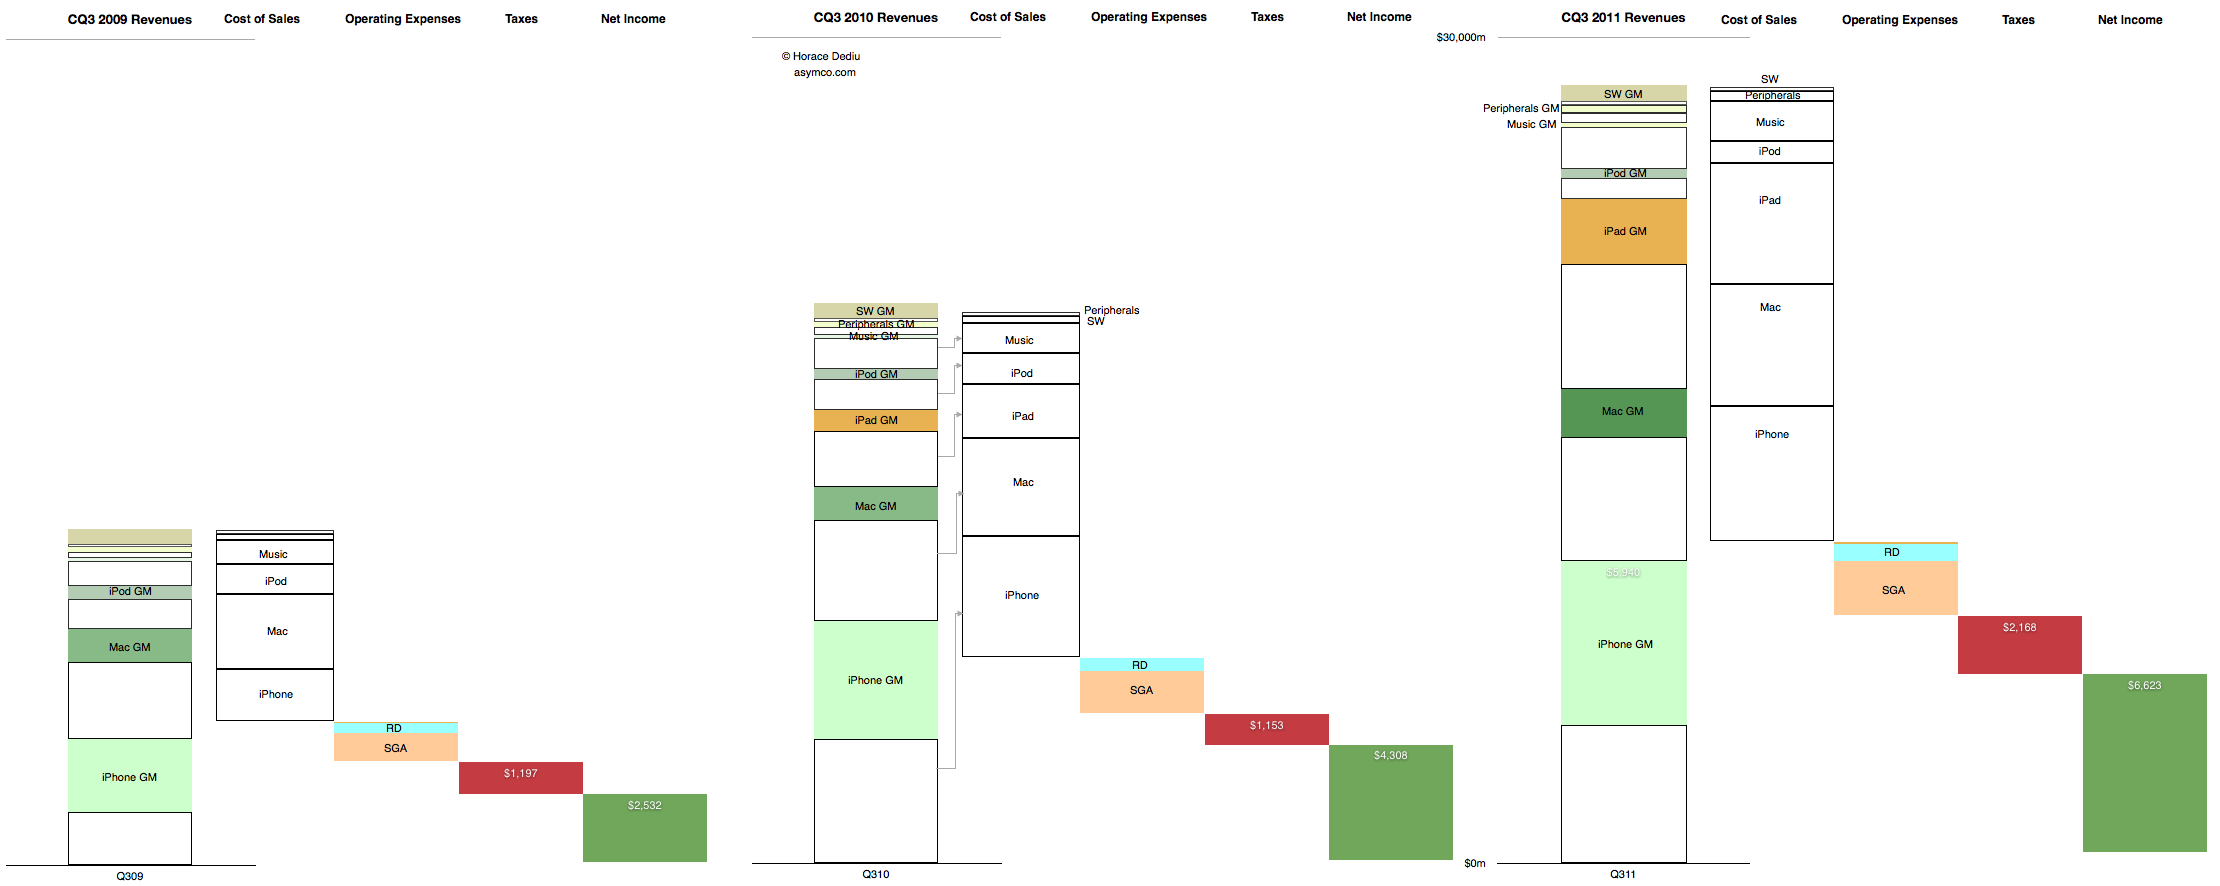
    This is the cascading view of Apple's financial performance in the third calendar quarter. It only includes information that is already in the income statement but shows the relative growth of the individual product lines, their cost structures and the relationship between fixed (Operating) expenses and their variable (cost of sales) expenses at a glance.

    In the past I would publish current and year-ago data, but in this quarter's summary I present three years' history of quarterly data. Note that the full view is quite large (2,220 x 886 pixels).

    Here are some handy tips on how to read the chart:

    • The "top line" is the size of the first column in each quarter's chart.
    • The "bottom line" is the size of the last column.
    • The blank areas are what Apple pays suppliers.
    • The red area is what Apple pays to the government.
    • The Pink and pale blue area is what Apple pays its "exempt" employees. (Other Income and Expense is also included but is nearly invisible).
    • The Green area is what is declared as earned and becomes the "E" as part of the P/E ratio. (Note that not all of this goes to the Cash account as the cash flow statement will reveal).
    • The colored areas in the first column labeled with product name and "GM" (for gross margin) represent what Apple keeps from the sale of each product after paying expenses tied to producing that product.
    • The ratio of sold areas to the corresponding white areas below in the first column represent the margin (as a percent) per product line
    • You can observe the trend over three years by tracking each of these quantities from left to right.

    The scale of the chart is shown by the line near the top representing $30 billion.

  4. The end of the independent phone brand

    Research · 103 comments

    As shown in the yesterday's post, in the third quarter, overall mobile phone profitability declined. The eight vendors I use as a proxy showed a total net profit of $8.51 billion, down slightly from $8.57 billion and a drop of $9.01 billion in the first quarter.

    Overall, the industry dropped by 1% sequentially but is still up 30% over last year and has a 20% compounded growth rate over a three year period.

    • Nokia returned to profitability, though at $180 million it's only about 2% of the top eight.
    • Motorola remained in the red with a small loss of $20 million, an improvement over the $90 million loss of the previous quarter. Motorola is being acquired by Google after an accumulated mobile operating loss of $4.69 billion since the beginning of 2007. It's unlikely we'll receive any updates on performance thereafter.
    • Samsung had a great quarter with a sequential increase of 19% and year-on-year growth of 130%. The total profit amounted to 25% of the peer group.
    • Sony Ericsson broke even with about $50 million in operating profit. Like Motorola its performance was barely break-even during the last four years and its also disappearing from our list of independent vendors as it becomes part of Sony.
    • LG had its sixth consecutive quarterly loss and is now appealing to investors for more capital to continue operating as a smartphone vendor. Raising dilutive capital seems a radical approach and not one that inspires confidence.
    • RIM had a sequential reduction in profit of 35% and y/y reduction of 30%. The company is exhibiting clear signs of decay and the stock market is valuing the company below book value.
    • Apple profit dropped by 19% but grew 43% y/y during a transitional quarter. The growth remains 43% compounded over three years.
    • HTC has a 1% sequential increase but a 78% y/y growth.

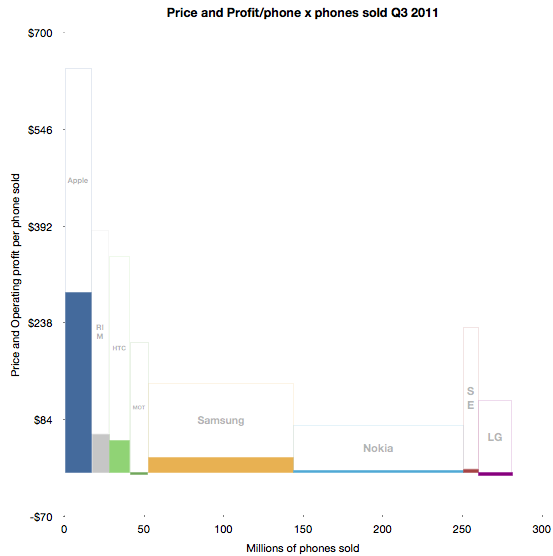
    To illustrate the performance in terms of profit, pricing, volumes and margins, I developed the following chart. 

    The solid areas representing profit are operating profit/phone in the vertical axis and volumes shipped in the horizontal. The blank areas above are the cost of goods sold per phone and the combined solid and blank represent the average revenue per phone.

    Some of the areas are over-represented due to the lack of resolution available.

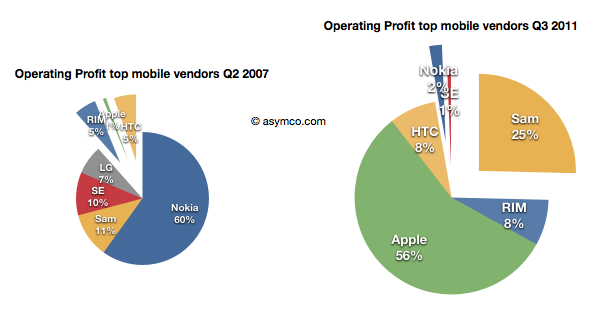
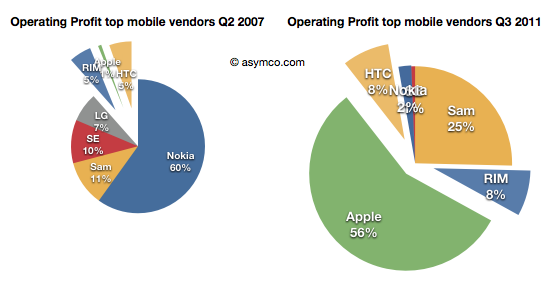
    Using before-and-after pie charts for positive profits, we can see how the entrants (RIM, Apple and HTC) went from 6% of profits to over 73% four and a half years later.

    I feel that this is somehow the end of an era. I've written before about the brutality of this market, listing 13 companies which were either merged or acquired or disappeared in the last decade. Now both Motorola and Sony Ericsson will soon be added to the list. On average, it's as if one phone vendor has disappeared every year for fifteen years.

    And it's still not over. RIM is also becoming a going concern issue, and LG has a big question mark above it.

    Of course, ZTE and Huawei and Lenovo are joining the list of competitors but I note that they are not focused on mobile phones. They are opportunistic phone vendors, depending on other businesses to compensate for the risks inherent in phone sales. It's interesting to note that neither Apple nor Samsung are pure phone plays.

    In fact, of all the phone brands only RIM and HTC are exclusively phone-only companies. It may indicate something profound is happening. The notion that the development and marketing of phones as an activity independent of other business models may be coming to an end.

  5. Estimating Samsung's smartphone mix

    Research · 57 comments

    Samsung no longer reports mobile phone shipments. The company's phone market performance reporting is limited to the following:

    Shipment : High-20%↑YoY (low-20%↑QoQ)

    ASP : Slight increase QoQ

    As the company did not report volumes or ASP last quarter either, the QoQ (Quarter on Quarter) growth estimates are almost useless. The only fragment that might be useful is the "High-20% YoY" given that they did publish units for Q3 2010: 71.4 million. This leaves the question of what "High-20%" means. Here are some ranges and what the result would be:

    • 92.1 million assuming 29% YoY growth
    • 91.4 million assuming 28%
    • 90.1 million assuming 27%

    The "best guess" might be 91.4 million.

    As the company also provides revenue for its mobile division (14.42 trillion Won) we can therefore estimate the average selling price: $142. Is this a slight increase? By a similar approach, last quarter's ASP was $139, and assuming exchange rates did not vary widely, this increase is small enough to be called "slight".

    We also have a figure for the operating margin for the entire Telecom group (16.9%) which gives an operating profit of $2.2 billion.

    The last piece of the puzzle is the number of smartphones Samsung shipped. Samsung said smartphones grew "more than 300%" year over year. That would imply 31.4 million. One estimate is from Strategy Analytics that suggests 27.8 but it's coupled to an overall volume estimate of 88 million (well below the 91.4 million estimated above). The Wall Street Journal published an estimate of 28 million.

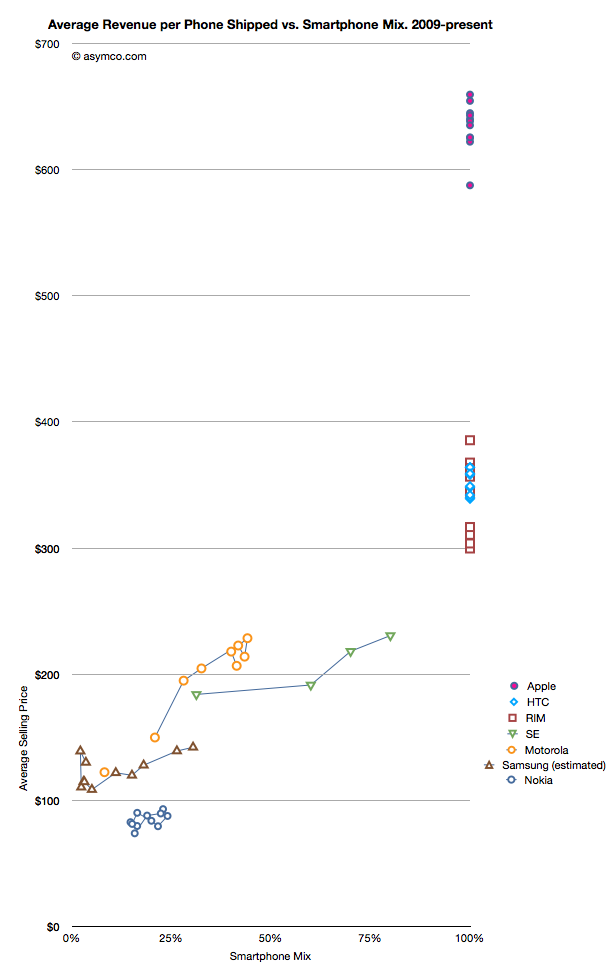
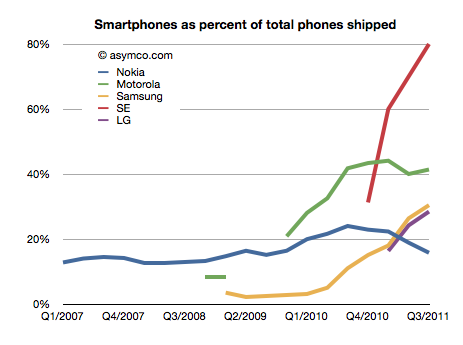
    I have no idea how to narrow down this estimate, but if we go with the one that claims the highest precision (27.8 million) we get an estimate of about 30.4% of Samsung's volumes being smartphones (what I call the "smartphone mix"). That is an interesting basis for comparing Samsung's smartphone business to other companies' smartphones. I prepared a graph showing how pricing is affected by the increasing mix of smartphones in vendor portfolios.

    What the graph shows is the movement of prices as companies have increased their smartphone mix since Q1 2009. For example Sony Ericsson moved from 31% smartphones to 80% smartphones in about a year. Their ASP increased from $184 to $231. Some companies have not changed their mix. Apple, HTC and RIM have maintained 100% smartphones in their portfolios so their pricing has been consistently high ($650, $354 and $357 over last 12 months, respectively). Conversely, Nokia has struggled with its smartphone portfolio and as a result its pricing has remained stubbornly clustered below $100.

    But the most interesting companies to watch are Samsung, Sony Ericsson and Motorola. You can see how their "vectors" or price migration point toward the sweet spot where HTC and RIM reside. Ideally, they would be very much better off with pricing in the $300 range.

    Samsung is moving quite rapidly toward the sweet spot but the slope is not as steep as the others. That's may be because SE and Motorola have much smaller volumes but it's still an open question why, with an estimated 30% mix of smartphones, the pricing remains $60 lower than when Motorola was at the same mix or $40 lower than Se.

    Some of the answer might be due to the number of "low end" smartphones (Bada?) that Samsung is selling or maybe their non-smartphone pricing is trending down a lot more rapidly.

    Keep in mind that if we change the assumption of the number of smartphones to a lower number (i.e. below 27 million) then the trajectory of the Samsung line in the graph would increase and may match more closely the slope of the other two vendors.

    I don't have any reason to believe that it's lower than 27 million but I don't have any reason to believe that it's above 27 million either. It's an estimate.

    If we believe it then we have to say that with a near tripling of smartphone mix (from 11% to 30.4%), the company grew its overall units by 28% and its revenue by 39% and pricing by 17%. Profits also grew by 130%.

    It would follow then that switching to a 100% smartphone mix would make a lot of sense.

  6. The other tablets

    Research · 89 comments

    Analysts have to count things in order to measure value. It sounds easy but it can be tricky. As I pointed out with PCs vs. iPads, if you count an iPad as a PC you can get into a lot of trouble with your clients. But if you don't you end up directing them away from confronting an existential threat. Only very rarely is a market report published in contradiction to widely held sustaining beliefs. More often than not analysts bow to the source of their paychecks and in so doing show their rear end to the truth.

    This comes up again now with respect to how to count tablets. Consider that there is little difference in architecture, software or design between an iPhone and an iPad. They run the same OS, use the same microprocessors and have similar communication methods, inputs and sensors. However they are considered completely different products and counted as part of separate markets. The only physical attribute that differs is the screen size. So we have to conclude that the size of the screen is a huge determinant factor in deciding whether a product is a tablet but not a smartphone (or music player).

    But what about tablets themselves? Their screen sizes vary widely. A 10" screen is certainly a tablet device, but a 4" screen certainly isn't. Where is the boundary exactly? It seems that a 7" device is still a tablet but a 5" may not be. The Dell Streak 5 device is presumably not a tablet. The arguments then descend into an arbitrary definition of tablet based on whether it fits in one hand or in a bag of a certain size.

    This begins to sound academic. Why should it matter what size is or isn't a valid tablet? Buyers are not in the market for screen sizes. They are in the market for products that can be hired to do jobs or address pain in their lives. So as far as consumers are concerned, these categories are meaningless. If you want to design something you'd better segment according to jobs to be done.

    However, buyers are not the target audience for the analyst. Nor are product designers (hopefully anyway.) Part of the reasoning of offering market research is that it presumably helps ecosystem participants (vendors, developers, retailers, etc.) decide where to invest their time and money. They are the target audience. They don't spend their lives reading tech blogs. For them it's important to understand "which way the wind is blowing" and that's where an analyst should be helpful with data.

    But then if we are to measure ecosystems, we have more difficulties.

    The iOS ecosystem is pretty well understood. Apple publishes the number of devices it sells and the number of apps on its store and downloads, etc. We can assume Microsoft will do the same with Windows 8 as they do already for Windows in general.

    For Android, it's a challenge. Google measures activations, but that may not cover the actual units sold. Google admits that it does not know how many Android devices are sold or even how many are for sale. It's in the nature of open source that it's not controlled and hence not measurable.

    But analysts still try. Consider the estimate that about 27% of all "tablets" shipped are Android. That's not something Google helped with. Google can report the number of activations of a certain version of the OS, but they themselves don't know what the device looks like or what size screen it has. A device vendor can put any version of Android on a device of any size. To find out how many tablets run Android, you need to try to estimate "bottom up" by adding the output from various vendors.

    However, it's clear that a large number of these devices are not exactly Android. Consider what  Kevin C. Tofel writes for GigaOm:

    I asked Strategy Analytics to clarify both of those points and received the following email response from Neil Mawston, the analyst who wrote the report: ”Yes, the press release refers to shipments, not sales. All sub-versions of Android are included. Yes, the B&N Nook Color tablet is included in the tablet figures.”

    So the B&N Nook is counted as an Android tablet and part of the 27% share of Android. But Google itself does not count the B&N Nook as an Android tablet. It's not something that can even use the Android brand. From Google's own documentation:

    We define an "Android compatible" device as one that can run any application written by third-party developers using the Android SDK and NDK. We use this as a filter to separate devices that can participate in the Android app ecosystem, and those that cannot. Devices that are properly compatible can seek approval to use the Android trademark. Devices that are not compatible are merely derived from the Android source code and may not use the Android trademark.

    In other words, compatibility is a prerequisite to participate in the Android apps ecosystem. Anyone is welcome to use the Android source code, but if the device isn't compatible, it's not considered part of the Android ecosystem.

    So to summarize, whereas the Nook is counted as an "Android tablet" it...

    • cannot be called an Android device without violating the trademark
    • may or may not compatible with Android Apps
    • does not include Google Services like Google Maps
    • cannot license the Android Market client software or brand
    • is not considered to be a part of the Android ecosystem by Google

    All this is also true for the Amazon Kindle Fire and whatever Baidu, Alibaba and other Google competitors will be selling. Furthermore, Google can define compatibility and therefore what "being Android" means arbitrarily and can change that definition at will. It can even withdraw compatibility on the basis of business priorities.

    It matters because these devices might end up very popular (see Amazon's reporting of Fire's pre-orders in its quarterly earnings call) and in aggregate could even be the majority of "Android tablets".

    The result is that most analysis of the Android ecosystem (and by comparison, all mobile ecosystems) depends on classifying as Android devices those that compete with Google, and indeed, with Android. For the purpose of assessing value, growth and opportunity for third parties such reports fall short.

    So what should be done?

    The solution is simple: Count as Android devices those that are allowed to be called Android as per Google's own definition. It makes clear that developers can reliably sell their software through the Android Market. It makes clear that those devices are designed to use Google services and it makes clear that those devices are not designed to compete with Google.

    Those devices which are using "derived" Android source code and are not compatible (as per Google's definition) and are not allowed to be called Android by their vendor should be called something else. Maybe "Android-like" or "Android derivative" or "Non-Google Android" or just "Other".

  7. The growth surprise in Apple retail

    Research · 58 comments

    In Apple: For What It’s Worth Jeff Matthews asks a question "about the most disturbing pattern coming out of Apple’s earning release: the measly 1% year/year revenue increase at Apple’s retail stores".

    He notes that prior to the drop, Apple stores were growing at 36%. Such a huge drop quarter on quarter seems suspicious and he thinks something is happening.

    Something is happening.

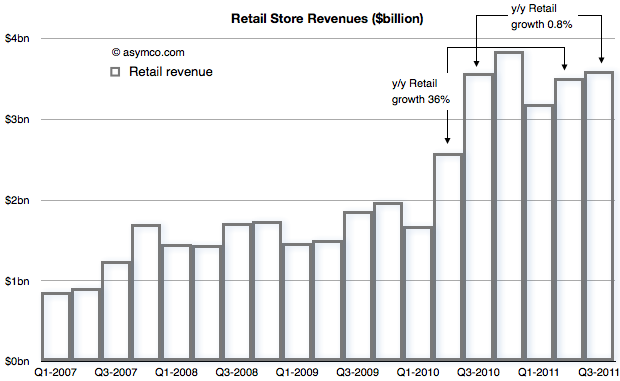
    To find out what, let's start with the revenue from Retail that Apple reports[1]


    The concern is with that low growth between calendar Q3 last year and this year. That is being contrasted with the growth in the previous quarter (Q2) of 36%.

    When seen as a chart, the explanation for a big change in growth is perhaps easier. The third quarter of last year was a boom for retail and the quarters that followed were more-or-less similar in sales level.

    With this perspective, it's clear that there was a surge in sales during the last year which did not repeat this year.

    But what's the cause for this pattern? If we know the cause can we predict if retail sales growth will increase or decrease?

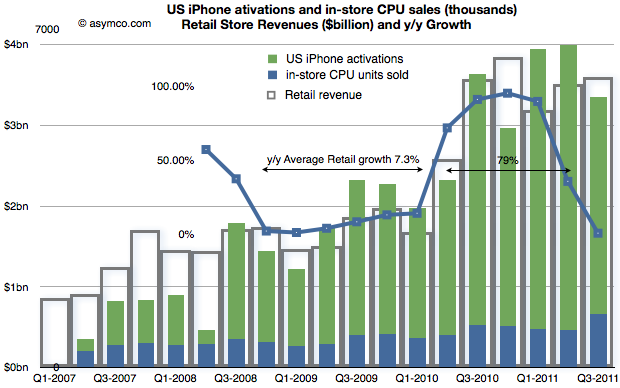
    Consider the following compound chart:

    The chart shows three different quantities.

    1. The original retail sales values in "hollow" bars
    2. The growth in those values year-on-year (in a line chart)
    3. A "proxy" candidate for retail growth explanation: the sum of US phone activations and in-store CPU units sold as a stacked bar chart.

    The choice of proxy includes the blue bars which Apple reports as in-store "CPU units" and the US phone activations[2] coming from AT&T and Verizon[3].

    We can see now that there is a strong relationship between iPhone sales growth and store sales growth. The Mac business is growing but not in the bursty way that iPhones are growing. The growth of US iPhones matches the growth in (US mostly) Apple retail. This should not be a surprise.

    The bursty nature of iPhone means that store growth varies just as dramatically. I highlighted that during the period of Q4 2008 to Q1 2010, Apple store revenue grew at an average of 7.3% but following the "big bang" of the iPhone 4 launch they grew at 79% over the subsequent five quarters (because the comps were easy).

    In the latest quarter the growth dropped as there was no launch of a new iPhone to top the big bang of a year earlier. Even so, store revenues actually increased by a slight amount.

    Knowing that the comp with the year before was so tough the surprise isn't that the growth slowed, it's that there was any growth at all.

    If iPhone as a cause for growth in retail is to be believed, then how hard can it be to forecast retail growth in the future?

    ---

    Notes:

    1. Apple does not submit this information to the SEC but reports it (exclusively I believe) during the earnings conference call. Transcripts are available on seekingalpha.com but fortunately they are recorded as well by Gary Allen at ifoapplestore.com.
    2. I used US data for the iPhone as most of Apple stores are in the US. The global pattern is similar.
    3. I had to estimate Verizon units used during the last quarter as they have not been reported yet. I used a similar ratio between AT&T and Verizon as for the last quarter.
  8. Are Apple’s investments in PP&E extraordinary?

    Research · 34 comments

    In his recent posts Horace took a look at Apple’s fixed assets and their development over the recent years. He also tested the hypotheses that Apple is making investments into machinery & equipment on which iOS devices are produced by overlaying iOS volumes with preceding changes in property, plant and equipment (PP&E).

    The question that has arisen is: Are Apple’s investments in PP&E extraordinary?

    To answer, I have compiled the capital expenditures (CapEx) for our previously established peer group [1].

    But first we need to clarify what CapEx include and not include. CapEx includes investment into property, plants, equipment, office furniture, larger IT hardware and in some cases patents; CapEx do not include investment into long-term marketable securities or other long-term financial instruments, acquisitions or capitalized R&D. Furthermore, CapEx are gross values and are not net of any sold equipment [2]. CapEx are largely depending on a company’s business model and strategy. For example if you are a manufacturer you need equipment to operate, if you are a software company or a retailer, your business will not be capital intensive.

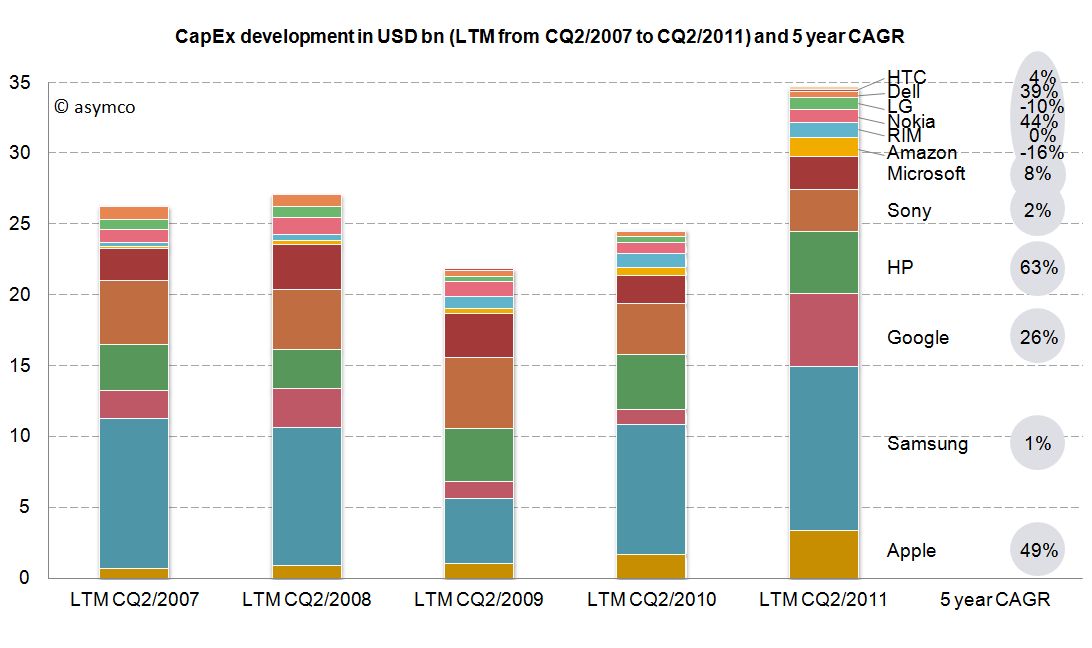
    As the second calendar quarter of 2011 is the latest quarter for which all companies have reported figures, we will take a look at last twelve months’ (LTM) figures from Q2/2011 backwards. The following stacked bar chart shows the combined CapEx of our peer group:


    The combined capital expenditures of our peer group for the LTM CQ2/2011 have outpaced even pre-crisis levels of investments and, combined, account for $34.7 billion. Samsung, a diversified manufacturer of IT hardware and other equipment, has invested more than $11.6bn with Google ($5.1bn), HP ($4.4bn) and Apple with $3.4bn following in line. While Google’s CapEx mostly account for its infrastructure of server farms and other IT hardware, HP’s CapEx mostly account for IT hardware it leases to its customers [3]. In absolute terms, Apple takes fourth place in CapEx spending for the last twelve months ending in CQ2.

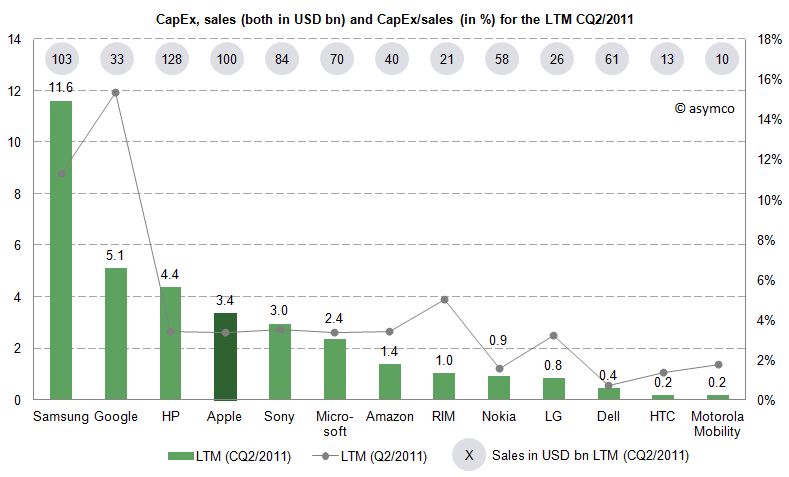
    Since the business model and sales magnitude varies largely in our peer group, we can also take a look at a common measure to compare CapEx intensity by dividing CapEx by sales achieved in the same period. For the last twelve months we can depict the following chart:


    The average of the peer group accounts for 4.4% of CapEx over sales. Samsung’s and Google’s business model are clearly more capital intensive, while Apple’s CapEx ratio of 3.4% is below the peer group average but above some of its peers like Nokia, Dell, LG, HTC or Motorola Mobility. Interestingly, capital intensity of HP, Apple, Sony, Microsoft and Amazon is at a comparable level of around 3.4%.

    As noted before, business models and strategies are significantly different among companies in our peer group. However, while Apple’s CapEx intensity is not extraordinary, Apple’s CapEx in absolute terms are among the largest in it this peer group and have grown constantly throughout a five year period.

    Is this a good thing and why does it matter?

    CapEx by itself does not tell us much. We still do not know in what companies specifically invest as financial regulations do not require detailed CapEx accounts. We know that even if a company is not growing assets they need to be maintained, upgraded and replaced – this spending is also called "Maintenance CapEx". Everything else can be called "Expansion CapEx" associated with new product launches, entry to new business area or geographies or expansion of (manufacturing) capacity.

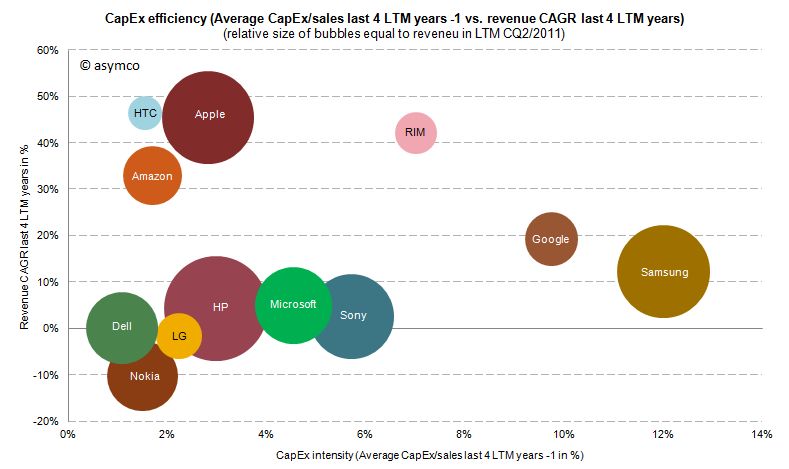
    Therefore, Expansion CapEx is closely linked to expected organic sales growth in the future. So let’s go ahead and link CapEx ratio of the previous years with the sales growth of the following year. The following chart shows the cumulative average growth rate (CAGR) over the last four years versus the average of CapEx/sales ratio of the four last preceding years:


    We can see that high CapEx efficiency has been achieved by Amazon, Apple and HTC with sales growth rates of 33-47%. RIM reached similar revenue growth but with higher CapEx intensity. Google and Samsung with high CapEx intensity have only reached modest growth rates. Dell, HP, Microsoft and Sony have not grown significantly but have close to average CapEx intensity.

    We cannot state that CapEx in absolute terms have been extraordinary for Apple, but we can witness that with below average CapEx/sales ratio Apple outgrew in absolute terms Dell, LG, Microsoft, Nokia and Sony and has grown close to the revenue size of Samsung and HP in the last four years.

    ---

    Notes:

    1. Excluding Lenovo (not reported) and Acer (extra-ordinary low numbers reported, to be investigated), Motorola Mobility figures only available for the last six quarters
    2. Minor differences may occur due to local Generally Accepted Accounting Principles (GAAP)
    3. HP assumes ownership of these assets and rents them to the customers who in turn have a smaller balance sheet and can run IT hardware CapEx through the income statement as lease expenses
  9. More media tablet hype

    Research · 66 comments

    The iPad is still only slightly more than a year and a half old. Forecasting unit volumes has proven very difficult. But more than that it's proven very difficult to appreciate the impact on the market it's disrupting, PCs.

    For some people this is obvious, but what if you don't live and breathe disruptive theory? What if you don't watch every data source like a hawk for hints of change? What if you are not even a technologist. How would you form an opinion on the effect of the iPad on PCs?

    There are many industries and sectors about which I know nothing. If you asked me to analyze a market like industrial lubricants, I'd probably start by reading the consensus opinion put forward by the leading market analyst, an expert in that particular sector. That would form the baseline.

    In the PC sector, that opinion is formed by Gartner (and IDC and Forrester perhaps). Gartner will get a lot of citations and its stats and opinion forms the baseline view. It may not be right, but we can expect it to be the "consensus". This is because Gartner surveys a lot of data and interacts with a lot of insiders in the industry. They collect and weigh these inputs and put out what is likely to balance them all.

    If Gartner says that the iPad is a "media tablet" that is not a PC they may be wrong. But they are also repeating what the PC industry is saying. So I value Gartner as a reflection of the consensus. If there is a significant gap between Gartner and what I conclude to be reality then there is an interesting opportunity as well as evidence of incumbent ignorance.

    Let's then look back on how Gartner has been reporting the iPad's rise and the PC's decline.[1]

    Q2 2010

    "The consumer PC market registered double-digit shipment growth, but consumer mobile shipment growth slowed. This was due in part to slower growth of mini-notebooks," Ms. Kitagawa said. "Surging popularity of Apple's iPad temporarily cannibalized mini-notebooks, as well as consumer notebook sales to some degree. It is not certain at this stage if the cannibalization will continue with the current price point of media tablets."

    Q3 2010

    "Media tablet hype around devices such as the iPad has also affected consumer notebook growth by delaying some PC purchases, especially in the U.S. consumer market. Media tablets don't replace primary PCs, but they affect PC purchases in many ways," Ms. Kitagawa said. "At this stage, hype around media tablets has led consumers and the channels to take a 'wait and see' approach to buying a new device."

    Q4 2010

    “U.S. holiday sales were not fantastic for most PC vendors, but the professional market did show healthy growth during the quarter,” Ms. Kitagawa said. “Media tablets undoubtedly intensified the competition in the consumer market. These devices do not replace primary PCs, but they are viewed as good enough devices for these who want to have a second and third connected device for content consumption usage. Mini-notebook shipments were hit the most by the success of media tablets.”

    Q1 2011

    "Weak demand for consumer PCs was the biggest inhibitor of growth," said Mikako Kitagawa, principal analyst at Gartner. "Low prices for consumer PCs, which had long stimulated growth, no longer attracted buyers. Instead, consumers turned their attention to media tablets and other consumer electronics. With the launch of the iPad 2 in February, more consumers either switched to buying an alternative device, or simply held back from buying PCs. We're investigating whether this trend is likely to have a long-term effect on the PC market."

    Q2 2011

    Overall shipments of media tablets took place late this quarter and volumes remained low, minimizing any impact of the media tablets for PC substitutions in the second quarter of 2011

    Q3 2011

    "The main contributor to the weak consumer PC market in the U.S. was intensified competition for consumers' money," Kitagawa said "Media tablets and smartphones took center stage in the U.S. retail sector, and the expectation is for continuing demand for these devices throughout the holiday season."

    I've added emphasis for the key words describing the impact of the iPad (referred to as "media tablets").

    Note how the message changed over time. At first the effect was thought to be temporary (presumably due to "hype"). Three months later the "hype" was leading to "hesitation" in the channel. Three more months and there was "a hit" on Mini-notebooks but only for those needing a second or third device for "consumption". In the fourth report it seems that "consumers" (vs. business users) are really interested in this. The fifth report suggests that the effect is "minimal". The latest report suggests that this is a "localized effect".

    An external observer (or paying customer) reading this must conclude that five quarters in, these media tablets are having some effect but most probably a transient one. By keeping tablets separate from PC's Gartner is implicitly stating that the two products do not compete. If they have an effect it's on the discretionary spending by consumers. Similar to the effect game consoles or consumer electronics may be having on PCs.

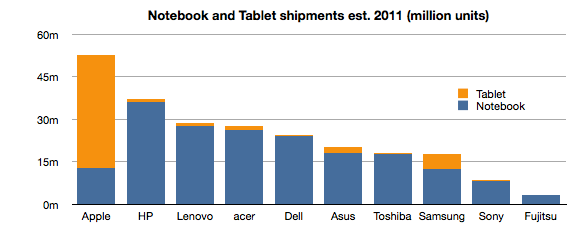
    However, if tablets were added to notebook totals the chart for 2011 would look like this:[2]


    Notes:

    1. The quotes are from periodic reports (every quarter) from the same analyst at the same firm using a consistent set of measurements about the market. In order to ensure the same context, I've selected the comments from press releases published using the same template.
    2. Source: Digitimes Research, compiled by Digitimes, October 2011
  10. Windows Phone, a year on

    Research · 103 comments

    Windows Phone is in limbo. The company acknowledged that it has performed below expectations. During the last quarter for which we have data (ending June) I have an estimate that Windows Phone sold only 1.4 million units (Gartner's sell-through analysis suggests 1.7 million). That gives Microsoft a 1.3% share of units sold (Gartner 1.6%), a new low.

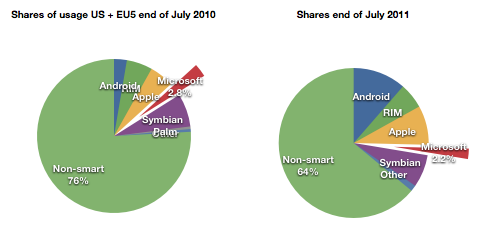
    At the same time, comScore data shows that user erosion in the US and EU5 has slowed and is holding at about 2.2% of all users.

    For its part Microsoft has lain low during the last few months. It released version 7.5 (Mango) last month to manufacturers.  It has a number of Windows Phone SKUs in the market or recently announced (27 with version 7 and eleven with version 7.5)

    It also sued Android vendors successfully and obtained royalties from the largest Android licensees Samsung and HTC. Patent royalties from Android are probably going to be higher than license revenues from Windows Phone for quite some time.

    Something is missing from this analysis. Clearly Microsoft has a plan. It's always had a plan. The plan is not easily perceived because the market Microsoft addresses itself to is not directly to the consumer--we cannot read the message. Microsoft needs to work through partners. Device vendors and operators mainly. In order to persuade them Microsoft deploys its check book.

    Put another way, the plan is that Microsoft intends to buy market share. Before we get into exactly how, we need to understand the most important but least discussed contributor to device sales: channel incentives.

    Before a phone is sold it needs to get through a mine field of obstacles: it needs to appeal to operator or distributor priorities; it needs to fill a slot in a portfolio of products for the manufacturer and the channel; it needs to acquire shelf space; it needs to appeal to some end users and, unless it has a blindingly strong brand, it needs to offer incentives to the retailer.

    This last piece of the puzzle is something of a mystery. Although not a universal practice, in many cases retail staff are paid commissions directly or indirectly by the device vendor. This relationship between the retailer and the vendor is not transparent. A buyer typically does not know what incentives are attached to a given device. Stories of salespeople steering people to and away from certain devices abound.

    Microsoft acknowledges this:

    Both Samsung and HTC Corp. have committed to increasing marketing budgets for the phones, said Andy Lees, president of Microsoft’s mobile unit, in an interview. While manufacturers will determine how the money is spent, some of it will probably go toward spurring retail staff to tout Windows Phone models, he said.

    Microsoft Phones to Get More Marketing, Sales Incentives - Bloomberg.

    In another interview:

    Q: It seems like one of the challenges is getting the salesperson in the store to push the phone.

    A: Absolutely. I think that's a number of things:

    One — they get influenced by how good the product is. The reviewers have influence with that and also their own experience.

    The second thing is the alignment with the operator. I think we're already pretty aligned and over the life of this release, we'll get even more aligned.

    Much more here: Business & Technology | Windows Phone chief Andy Lees sees time ripe for Mango | Seattle Times Newspaper.

    What's more, Microsoft and Nokia have a deal whereby at least one billion dollars from Microsoft are earmarked for the promotion of Nokia Windows Phones.

    Even prior to the launch of the Nokia relationship, with the original Windows Phone launch exactly a year ago, Microsoft made clear that it had a budget for promoting Windows Phones ($400 million in fact). In the event, the money seems to not have been spent, or spent sparingly because LG made public its disappointment. The coded language can be interpreted as a snub to Microsoft for withholding promised funds.

    Perhaps the funding was withdrawn because by the time the launch was scheduled, the Nokia deal was being negotiated. Perhaps Microsoft felt it better to put more effort behind the re-launch of the platform with Nokia on board. A re-launch which has yet to happen but seems to have already had $127 million allocated to it by Nokia alone.

    Microsoft is proud of what it has accomplished with Windows Phone because they were able to update the OS in 11 months and took only about two years to completely rebuild Windows Mobile into Windows Phone.

    But the dependence on a complex value network means that products do not reach users quickly enough and when they do the marketing message is weak, even when backed by large budgets. The real problem with Microsoft's approach is that it's neither viral like Android (because it has a price and a contract associated with it) nor is it focused and agile like Apple's. It seems to suffer from the worst aspects of modularity (market lag) without benefiting from the control over the ecosystem and end user experience that differentiates it.

    Microsoft will muddle through but the 20% share that it says is "conservative" seems anything but.

  11. The new iPhone portfolio and implications on ASP

    Research · 74 comments

    The iPhone portfolio is now larger than ever. It's arguable that, for the first time, we can actually call it a portfolio vs. the [n, n-1] pair of products that's been available to date. A year ago I even argued that the n-1 variant of iPhone was more of a cognitive illusion than a real alternative.

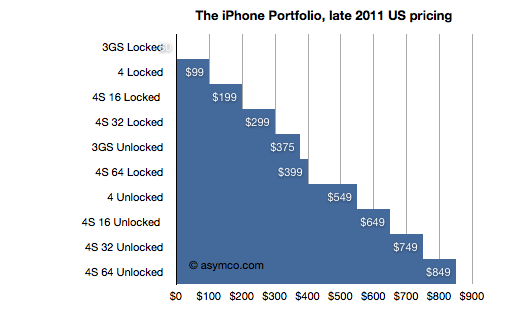
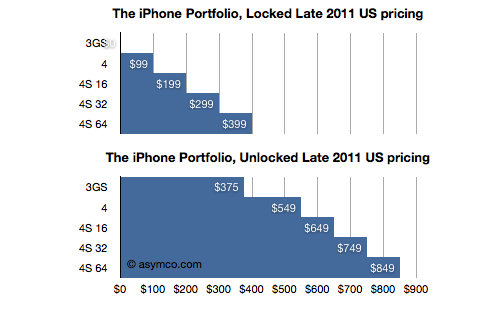
    But that all changed last week. For the first time since launch, there is a real portfolio. The iPhone is now available as five different variants with 10 different price points. Prices and options may vary by country, but I took the US portfolio as the baseline and illustrated it:

    Including all the pricing options It's a very regular pattern. It reminds me of the iPod which, at one time was sold at every $50 increment point from $50 to $500. The logic behind this pattern is that "there is now an iPhone for every budget". Of course, as with any purchase decision, each of these price points has trade-offs. Considering product performance or in terms of option value, the buyer has many things to weigh.

    To simplify, I divided the options into two subsets: Locked and Unlocked.

    We can now see the premium for unlocking (or, the discount for losing the freedom to use the phone on another network, as the case may be). We can also compare unlocked prices to unlocked prices for competing products.

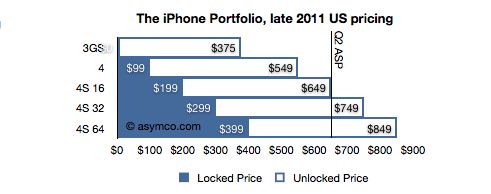
    To assess it further, I combined the two charts above into one, superimposing the unlocked price onto the locked price.

    In this last chart it becomes clear that buyers who purchase an unlocked phone are paying $450 more (the white areas), regardless of the phone's spec (except for the 3GS where the difference is only $375). For locked phones, the $450 discount is, presumably, the value of the change of carrier (GSM only) option for a buyer.

    But there is more to this picture. The unlocked price is also the price that Apple sells its product direct to consumers, many of which will be traded in secondary markets world-wide. Many will be sold in countries where Apple does not have distribution agreements with any operators. Because Apple needs to avoid channel conflict, they cannot price the unlocked product lower than they sell it to their channel. As a result, the unlocked price must be very nearly the price that operators themselves pay (excluding any volume discount).

    We can actually confirm this because Apple publishes the average selling price (ASP) that Apple obtains from the iPhone. I made a line in the last chart at the price Apple got in the last quarter.  It falls very nearly around the mid-point in the portfolio (and thus assuming the mode equals the mean and median in the distribution of sales.)

    There is one further implication in this. I think it's a safe assumption that the ASP for the new portfolio will be largely unchanged. Although Apple introduced the lower price for the 3GS ($375), it also added a more expensive 64G option. The lowering of ASP with the 3GS may be offset by the additional high-end sales, especially early on.