Data on Q4 performance is starting to trickle in. Last week Motorola, as part of a profit warning, revealed their Q4 smartphone shipments were 5.3 million. RIM had reported 14.1 million units (quarter ending November). HTC has also warned that their shipments of smartphones (and tablets) totaled 10 million. Samsung provided guidance on overall sales but since they don't report data on smartphone (or phone) sales, the estimates are ranging between 32 and 35 million.
Many have forecast Apple's performance but there are many other companies which are not easily estimated (Sony Ericsson, LG, Nokia, ZTE, Others.) But rather than dwelling on the specific quarter, we can make some long-range estimates of performance based on the historic data.
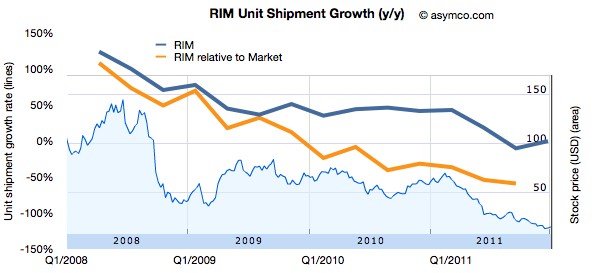
One method I use is to look at patterns of growth. Growth is the first derivative of market performance and it sometimes shows patterns which the performance itself does not. Consider the following chart showing the growth pattern for RIM.
The blue line shows the absolute year-on-year quarterly growth based on reported numbers of smartphones shipped. I've also shown the growth "relative to market" which is unit growth with market growth subtracted. This orange line represents how much faster (or slower) the company is growing relative to the market. If the orange line is above zero, the company gained share. If it's below zero, it lost share.
I also overlaid the performance of the share price (right scale).
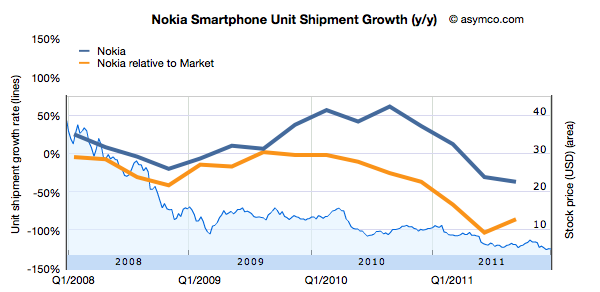
Now compare that with another long-term incumbent in the smartphone market, Nokia.
Bearing in mind that the scales are identical, Nokia's relative performance has been negative since early 2008. Persistent negative smartphone performance relative to market growth causes persistent loss in share price.
What about other, more recent competitors?
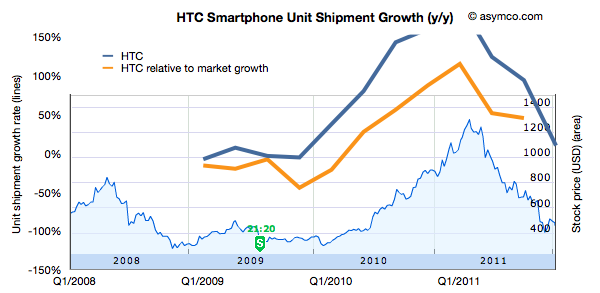
HTC is not a recent entrant in smartphones, and has gone through a phase of growth with Windows Mobile in the 2000's. This is its pattern of growth (and its share price).
Keeping the scale for growth consistent with the other companies leads to a bit of clipping but the pattern of rise and fall also seems correlated to share price performance.
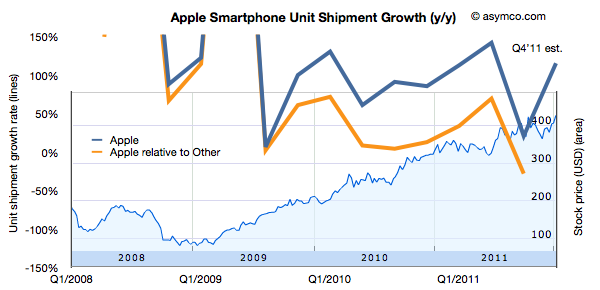
Finally, the following is the same analysis applied Apple.
Again, keeping the growth scale consistent leads to some clipping, but the pattern remains observable.
What seems to be rewarded to various degrees is consistency in growth of smartphones for companies which are primarily engaged in the market. However, failure to grow is punished with severe share price declines.
Being able to forecast smartphone growth seems to be useful, at least in the time frame of one or two years.
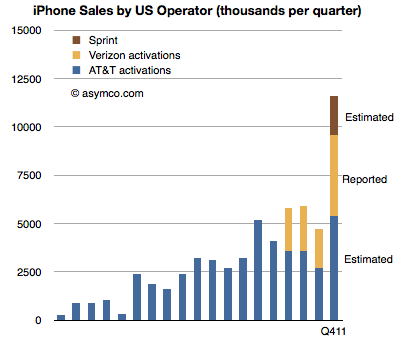
Verizon has been the first source of data on iPhone sales for Q4. They reported 4.2 million iPhones sold. The first quarter of Verizon iPhone sales had 2.2 million units, followed 2.3 million in Q2 and 2 million in Q3. The total for the calendar year came at 10.7 million.
The total for AT&T during the first three quarters has been 9.9 million. If we assume the same 2x sequential increase in Q4 relative to Q3 as observed by Verizon we obtain an estimate of 5.4 million iPhone for AT&T.[1]
The quarter also saw the addition of Sprint to the US iPhone distribution network. Sprint is rumored to have committed to buy 30.5 million iPhones over the next four years. My estimate for the first year was 7 million, placing first quarter sell-in at about 2 million.
An approximate total for Q4 US iPhone activations results in 11.6 million. The following chart illustrates these estimates:
Notes:
AT&T reported that smartphone sales during October and November totaled over 6 million units. Assuming only 2 million for December and a 70% iPhone mix yields 5.6 million units.
Apple's products are globally consistent. They sell the same exact[1] product in all countries. An unlocked iPhone is the same everywhere. It makes the products "liquid" in that they can be easily bought and sold across borders.
However, laws do not permit the import and friction-free trading of electronic products. In addition to regulations there are duties levied and there are sales or consumption taxes levied on the purchase.
However, knowing the retail price of an Apple product in a particular location, and knowing the tax and duties levied, can we work out if the price is consistent?
Here is an example:
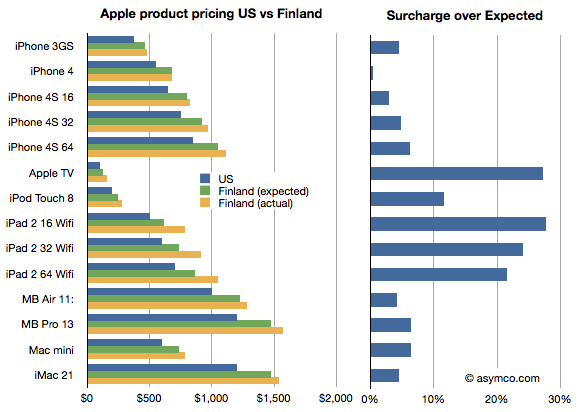
I illustrated the price of a basket of Apple products in the US online Apple store in blue and the same products in the Finnish online Apple store where the prices were converted to US dollars in yellow. I also calculated what the price in Finland "should" be if the products were sold with the known VAT of 23% added. I called this "Finland (expected)" price and it's shown in green.
I then took the difference between the "expected" and actual prices as a fraction of the expected and called that the "surcharge". The surcharge can be interpreted as "how much more does a buyer in a different country pay over the price in the US (excluding US sales tax) plus VAT and duties."
What the chart shows is that not all Apple products are treated equally by Apple. In this particular case Apple TV and the iPad are "overpriced" significantly. Interestingly, the iPhones are nearly what would be "expected" price.
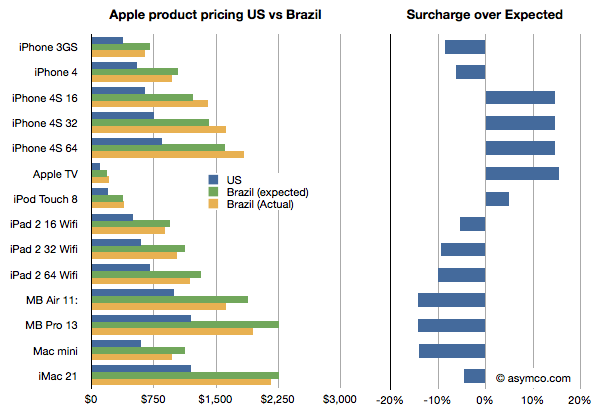
It gets curiouser when comparing with other countries. In this case I compare the same basket in Brazil.
Here the story is reversed. The iPads are cheaper than one would expect while the iPhones, especially the 4S, are more expensive, though not by as much as the iPads are in Finland.
Why is this?
I don't know. These prices are set by Apple though they may be influenced by operator deals they have locally or other terms. It would require local knowledge of the market to solve this.
What would also be instructive, I believe, is to collect data from many more countries. If you are living in another country, you can help by providing the following data: For each of the products in this list,
iPhone 3GS iPhone 4 iPhone 4S 16 iPhone 4S 32 iPhone 4S 64 Apple TV iPod Touch 8 iPad 2 16 Wifi iPad 2 32 Wifi iPad 2 64 Wifi MB Air 11: MB Pro 13 Mac mini iMac 21
provide the retail prices (preferably from an online store) and the local VAT or duty that is expected for electronic products (enter data here.) You can provide the prices in local currency. We can then try to put a global picture together and understand what affects price differences across borders[2][3].
Update: You can view and enter data in the spreadsheet here.
Notes:
There are minor differences like power adapters but they are not materially more expensive to produce.
Here are the highlights from RIM's latest quarter:
14.1 million BlackBerry smartphones shipped, 13 million sold through
150k PlayBook shipped with sell-through slightly higher. 800k PlayBooks shipped so far.
BlackBerry subscriber base up to 75 million
High growth cited for U.K., France, South Africa, Mexico and Argentina, Indonesia, Saudi Arabia and South Africa. RIM is the #1 smartphone vendor in the Latin America and Caribbean region. Sales outside the US, UK and Canada were 61% of revenues. US is now 20% of sales, UK 11%.
Hardware growth outside the US was 56%
There are 630 carriers
50k apps in App World with 5 million downloads per day
Forecasting 11 to 12 million smartphones next quarter
Given the channel fill with a new product, the device business was marginal at best. The company obtained -1% growth y/y in units but 31% sequential growth from a transitional quarter. The average selling price (inclusive of service revenues) is $354 and about $280 excluding service revenues. I estimate that operating margins have dropped to about 11%. Not a good story, but one we have been warned to expect.
But a crucial new twist to the story is that RIM announced that they don't expect new BlackBerry 10 devices until late next year. That came as a surprise and the stock sold off significantly, valuing the company at well below book value.
Stepping back, the biggest surprise is that the company seems to have had no plan for sustaining itself.
Let me explain.
If you go back to 2005 or so the world of smartphones was a mix of modular OSs and integrated platforms, much as it is today. Not unlike Android today, Windows Mobile was successful in licensing to dozens of vendors who in turn released hundreds of products. Symbian also was licensed but most volumes came from Nokia and they held the lion's share. Then there was the BlackBerry integrated solution which worked smoothly and had devoted fans who upgraded every chance they had and operators who were joyous at the new ARPU. There was also PalmOS as offered by PalmSource trying to be a "third horse" and unseat stodgy old Microsoft.
It was into that fray that both Apple and Google jumped. Google acquired Android in 2005 and Apple was busy polishing a version of OS X that would became iOS. In three and two years respectively these platforms would be in the market.
Regardless of the actions of rivals, all competitors must have faced the same questions in 2005: As technology was changing rapidly and as they all had access to component roadmaps, what is the best technology approach to this market? Should they embrace certain innovations to sustain their business trajectory? RIM had a tightly integrated software, hardware and service offering. What could make it better? Nokia was also basing its products on a more loosely integrated offering (nominally it was modular, but only just). It saw the writing on the wall and began developing a Linux variant (Maemo) as a potential candidate to replace Symbian. Microsoft was basing its solution of a modular approach. Windows CE was ok as a kernel but they had layers on top which were optimized around stylus-based user experiences (analogous to mouse actions). Could it take on a rich computing experience?
There were many experience candidates. Stylus, keypad, keyboard all had adherents. There was a lot of hesitation. After the iPhone launched with capacitive (finger) touch, resetting user expectations, it still took a year for many of the vendors to re-consider their technology plans. The weakest changed first.
Microsoft felt the pain quickest. They also had the least to lose since revenues from Windows Mobile were paltry. By 2008 internally they turned 90 degrees. They embarked on re-building their user experience and orphaning the Windows Mobile ecosystem and many of the vendor relationships they had built. Palm dropped PalmOS and built WebOS internally quite quickly. They licensed Windows Mobile as a stop-gap. Around the same time Nokia doubled down on Maemo and joined with Intel to form MeeGo. They did not orphan Symbian though and kept trying to adapt it to the new experiences and input methods.
But RIM did nothing. Almost nothing. They were the healthiest competitor. They felt no pain from iPhone's entry. The platform they had built was still growing and they were tweaking it constantly. There were always improvements to point to but fundamentally the code was limited. It was very difficult to adapt it to touch input and the first attempts at a touch UI were embarrassing. But there were no signs of a new platform that reflected the Unix-like competition.
As I pointed out in an earlier post, Unix-like operating systems were having their revenge. To a computer scientist the future of mobile computing would mirror that of personal computing in terms of architecture. The foundations of the early smartphones were built on constraints that were disappearing while being unable to accommodate new input methods. In other words, the early efforts were optimized around those constraints and sub-optimal for rich user experiences. They had to be. There were limited processors, memories and screens and battery life.
It turned out that all the early mobile operating systems were unsuitable for the advances in technology that came after 2007. Companies which were able to adapt or embrace Unix-like operating systems in a mobile context gained the ability to grow with the new input methods. The sooner they "pulled the trigger" on the shift, the better off they were. This is in fact what enabled entrants to gain footholds. Entrants entered with Unix-like OSs straight away while incumbents had to justify changing and the more successful they were the harder it was to justify changing.
RIM had trouble justifying this change. It waited until 2010 to finally acquire the QNX asset that would offer them a stronger software foundation. It still had to adapt this acquisition and it looks like it won't be done until at least 2012, seven years after they should have started. And this should be seen as a sustaining technological change. A new OS is not a disruptive technology to what is already a mobile computer.
However, delays like these can be fatal. We see the impact on Microsoft who was earliest to push the reset button in 2008. It still took two years to rebuild Windows Mobile into Windows Phone and is now still struggling to regain lost share (less than 2% today). We see the impact on Nokia which was unable to affect a transition to MeeGo due to a litany of issues and had to throw in the towel on self-determination. We see the impact on Palm which lost its independence as WebOS was a bit too little too late.
These companies had the right technical strategies but suffered from execution and business architecture issues. RIM is years late in embracing what appears to be a sustaining improvement.
But whenever you see what appears to be a coordinated effort by companies to fail simultaneously you have to ask if the change they struggle with is really sustaining or disruptive. The pattern makes me suspicious that what RIM, Microsoft, Palm and Nokia faced was more than a failure to embrace a sustaining improvement. I suspect that the failure is evidence of tectonic shifting of business models.
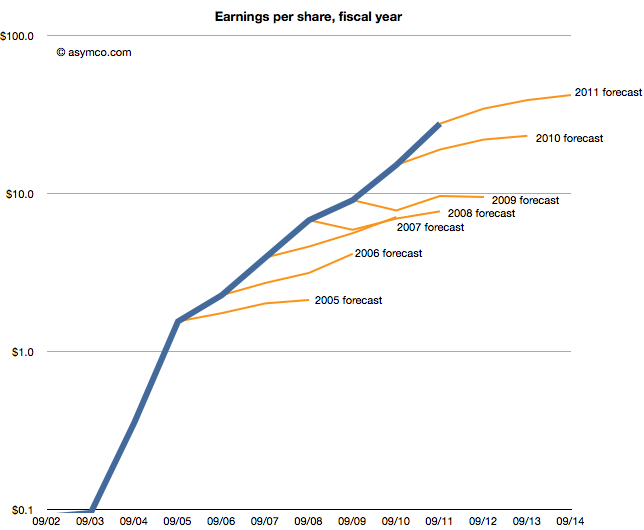
The discussion on why Apple is cheap was very useful. The debate brought into focus the possible causes for pessimism in the face of overwhelming evidence to the contrary. But maybe there is yet another explanation. The way the data was presented was as a difference between historic and projected growth rates. Is this the way analysts actually think?
Perhaps they don't project growth based on historic growth, but project earnings given historic earnings. In other words they don't look at the first derivative (change in earnings) but the shape of the actual data.
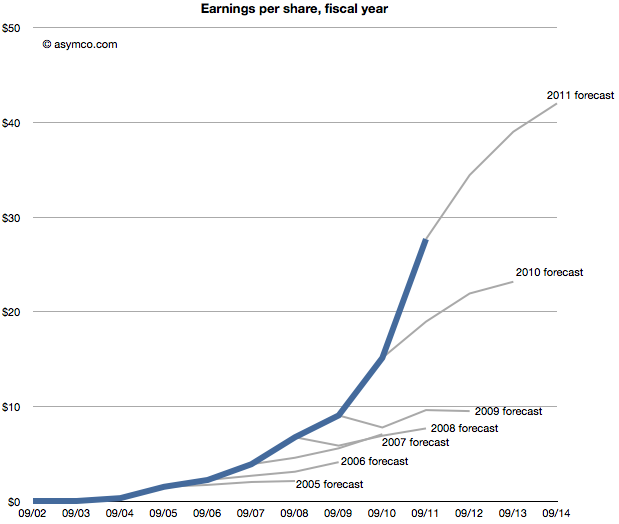
The following chart shows that data, i.e. forecasts as an extension of a sales trajectory. The blue area are actuals and the grey branches show projections at a given end of fiscal year.
Seen this way, we can imagine how the projections can be considered "reasonable". Some appear to be linear extrapolations while others show up as the end of "S-curves".[2]
What none of them imply is exponential growth. But would forecasting exponential growth be considered reasonable? Clearly not since it's never been consensus. But disruptive companies do follow non-linear growth. In fact, every company that has gone from being small to being big (which is to say all large companies) went through non-linear growth phases. The "natural" shape of growth is exponential.
The failure is therefore not of reason but of failing to use a model that assumes acceleration of sales. I believe that institutional financial advisors are conditioned (or coerced) into assuming that nothing unreasonable ever happens. That seems like a completely flawed foundation to stand on.
---
Notes:
This post is inspired by the New York Times chart showing budget forecasts.
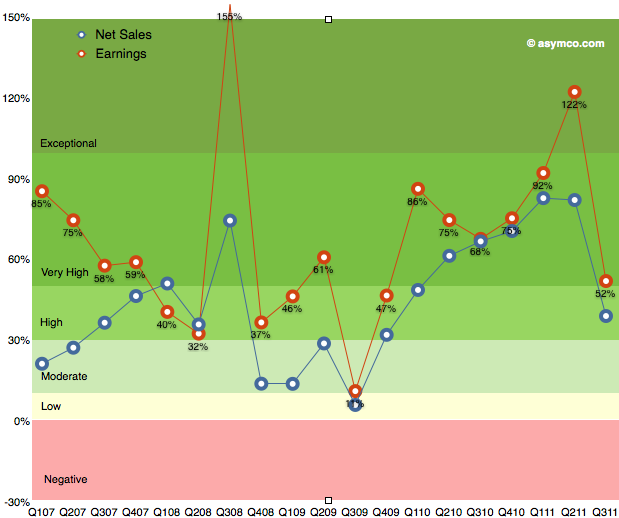
As the chart below shows, the last quarter (third calendar, fourth fiscal 2011) was slow with only 52% earnings growth. The discussion centered on the (surprisingly) disruptive effect of the iPhone transition. Surprising since most analysts, myself included, were lulled into thinking that the portfolio of iPhones and their wider distribution would create a smoother sales pattern vis-a-vis the more cyclical pattern seen in the first three years of production.
The second quarter was surprisingly strong and the third was surprisingly weak. So how do we estimate the fourth?
We have the pent-up demand for the new iPhone, we have the dynamics of holiday spending and we have a question mark on pattern of growth for the iPad. I'll discuss each assumption in turn:
The first assumption remains that iPhone growth is approximately 100% for the full year. Last calendar year there were 47.5 million iPhones sold. A 100% growth would imply about 95 million for this year. So far 56 million were sold. To reach a doubling then 39 million would need to ship in Q4.
Another approach is to look at quarterly growth rates. Thus far, we've had 113%, 142% and 21% for the first three quarters. To reach an average of 100% for the year then the fourth quarter would need about 120% or 36 million units.
36 to 39 million would be a good bounding range if there were no other mitigating factors. The information published so far shows no particular problems with either production or access to markets so I'm going to go with 35.7 million.
The second major assumption relates to the iPad. The iPad has been a challenge to predict since launch. Not only is it a new category but it comes with a different launch cycle than the iPhone and has significant constraints on production. There have been only two quarters where we could measure y/y growth: 182.8% in Q2 and 165.6% in Q3. I was initially tempted to dial in 150% for Q4 but the question of transition comes up. The first iPad model grew well into the holiday quarter but dropped dramatically into the first as it went through the transition to the iPad 2.
Are we going to see the transition effect earlier this year? I'm being cautious and suggesting only 100% iPad growth or 14.6 million units this quarter. This is still a very challenging product to forecast.
So here are my fourth calendar quarter forecasts (with y/y growth in parentheses):
iPhone units: 35.7 million (120%)
Macs: 5.2 million (27%)
iPads: 14.7 million (100%)
iPods: 13.6 million (-30%)
Music (incl. app) rev. growth: 22%
Peripherals rev. growth: 25%
Software rev. growth: 25%
Total revenues: $44.6 billion (growth: 67%)
GM: 42.0%
EPS: $12.3 (91%)
This earnings value would imply a trailing twelve months' EPS of about 33.5. At $390/share the P/E would be 11.6. Cash and equivalents may increase to $90 billion.
Apple publishes data about its "retail segment" which ifoAppleStore.com catalogs. Here are some statistics I was able to compute from the data:
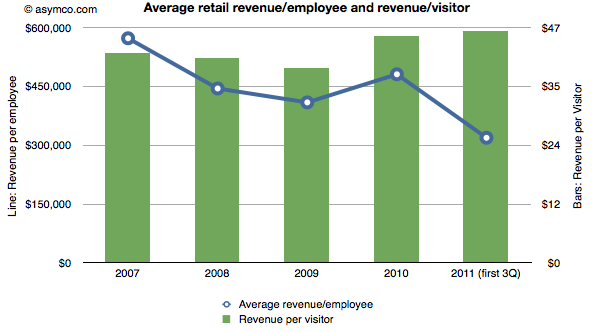
The stores generate over $100k per employee per quarter. In 2010, revenue was $481,000 per employee. This year the average is around $320k excluding the fourth quarter. In 2009 the average revenue for the technology sector was $388k/yr. A retailer like JC Penney generates about $124k of revenue per year per employee.
The revenue per visit is around $45. There are well over 250 million visits per year (222 million for first three quarters of 2011).
The combination of these two metrics are shown in the following chart:
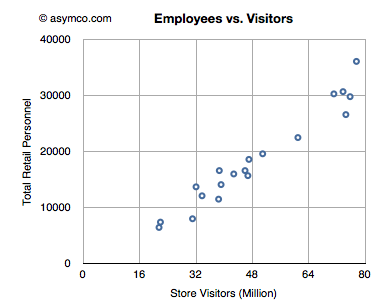
The number of employees has grown in proportion to the number of visits. There is one employee for every 2,500 visits/quarter. The following chart shows the relationship between retail personnel and store visitors on a quarterly basis.
Assuming an employee works for 360 hours per quarter, the average employee sees 6 visitors per hour or one every 10 minutes.
As that visitor generates more than $45 of revenue, an Apple store employee creates sales at the rate of about $278/hour.
This is a data set that shows Apple's product-level performance according to Units sold, Average Selling Prices, Cost of Sales, Gross Margin, Unit Growth, Revenues, Revenue Growth and Gross Margin contribution. It, along with all the other data sets are available under the Products menu at the top of this page.
There are several methods I turn to when estimating device sales.
Top-Down Demand analysis
The first is to look at so-called top-down views of the demand. This method takes a view of the overall phone market and assumes share for smart devices and, further, shares for individual platforms. There are several estimates out there. The most recent is Ericsson's Traffic and Market Data Report, released November 7 2011.
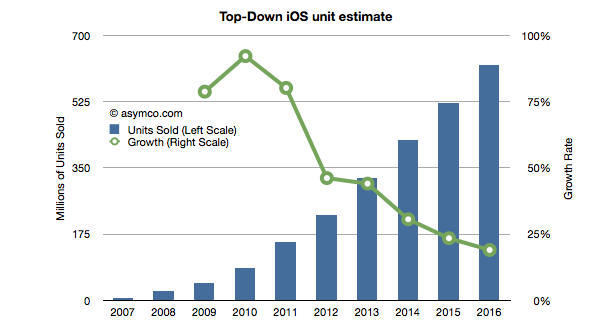
It concludes that in five years' time mobile subscriptions will reach 8.4 billion of which smart devices (incl. tablets) will total 6.2 billion. As iOS has approximately a 250 million install base at end of 2011 and as the total base from Ericsson's estimate for 2011 is 1.44 billion then Apple's share is approximately 17%. If we assume that Apple will be able to increase smart device share to 20% (3 percentage points in five years) then by 2016 Apple will need to have 1.24 billion iOS subscribers.
Assuming that half the installed base upgrades every year and Apple adds devices required to reach the install base necessary (1.24b or 20% share) leads to the following unit sales projection (I've added 2008 through 2010 actuals and 2011 estimates based on my own current Q4 projections).
This Approach yields an estimate of 225 million iOS devices to be sold in 2012. Note that the growth is linear which is not usually the case. Typically this growth is in the form of an S-curve which front-loads the volume in the more recent periods.
Production Estimates
The second approach is to look at supply. I use this method for Apple as I consider their devices to be supply constrained and thus look at historic performance to forecast their production ramps. Put another way, I try to answer the question of how quickly Apple can sustain growth in production given their yearly product cycles. I can also use capital expenditures (which the company releases in advance) to forecast device production as the two have been closely correlated in the past.
Using this method I currently estimate 260 million iOS units for 2012.
Customer behavior estimates
The third approach is to attempt to measure customers' loyalties and competitiveness of vendors. If we know the probability of upgrades and the historic split between "new" and "existing" users then we can roll the forecast forward.
To start, we need a probability of upgrade which can be obtained from surveys which measure "loyalty" by asking the intention of sticking with the brand on the next purchase or a measure "satisfaction". iOS product score in the high 80% to 90% range.
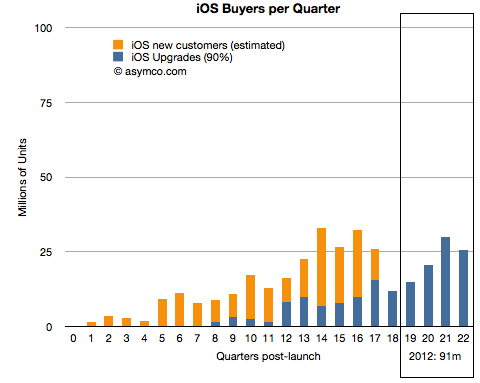
The following chart shows total iOS units sold and the ratio of upgrades (assuming 90% upgrades for 2 year old purchases). It also forecasts upgrades based on current installed base.
If 90% of iOS users upgrade two years after their device purchase then next year will result in 90 million iOS devices sold to existing users.
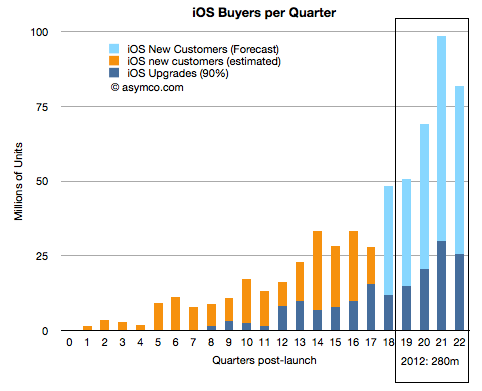
Given the ratio of new users to upgrades in the past, and if we assume some reduction in that ratio over time, we can obtain a measure of "new users" on top of the upgrades. (In other words we forecast forward the ratio between the dark blue and orange lines above).
The ratio of new to upgrades has varied significantly from 30x to 0.8x upgrades. I created a schedule where the next quarter will be 2.1x, then 1.44x, 1.36x, 1.28, 1.2x for the quarters of next year. The result is shown below:
This yields a forecast of 280 million iOS devices to be sold in 2012. The forecast is very sensitive to the ratios shown above so obviously this is not going to be very accurate but it's interesting to note that the three methods yield growth rates of 46%, 69% and 82%. All three are far above the growth forecast for Apple (about 25%).
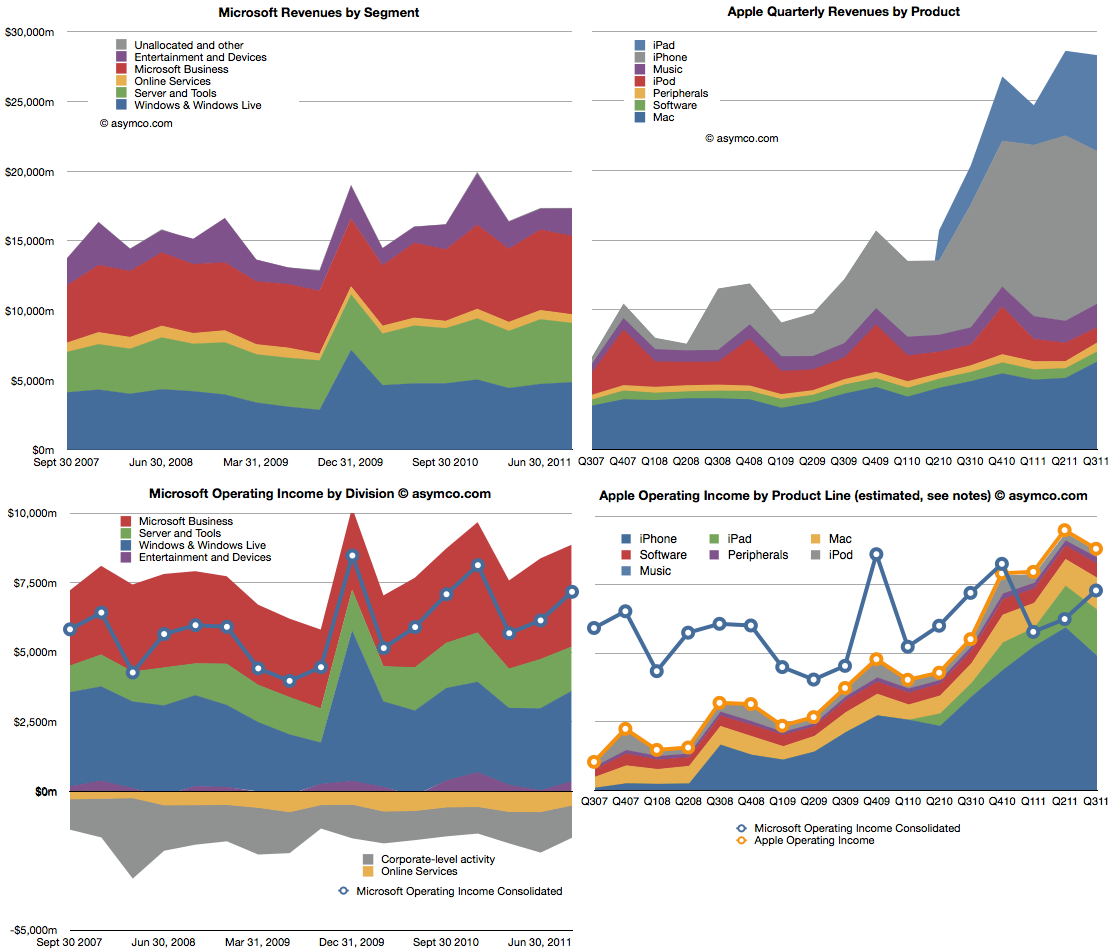
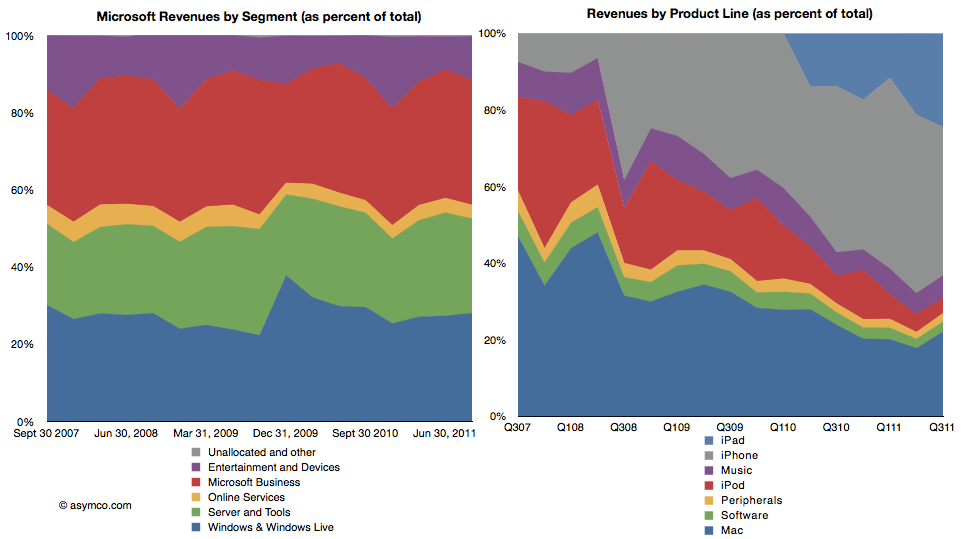
Microsoft is a stable business. Apple isn't. The following charts compare the two. The two charts on top show revenues, subdivided into product lines. Microsoft is on the left and Apple on the right. Note that the vertical scales are the same (zero to $30 billion/quarter).
The lower two charts show operating income by division/product line. The left is again Microsoft with the line showing the consolidated income (net of losses). The right chart shows the stacked areas of profit from Apple's product lines with the yellow line shooing consolidated income. I copied the blue line from the Microsoft chart for a more direct comparison.
Apple continues for the third quarter to have higher operating income and for the fifth quarter maintaining higher revenues.
The following two charts are also another way to view the two companies. As percent of total, how do the product/divisions stack up? The first is Microsoft revenues as percent of total and the second shows the equivalent for Apple.
This comparison I think is most evocative. The stability of Microsoft is contrasted with the dramatic change that Apple is experiencing in the same time frame.
There is a dramatic shift of focus from traditional computers (Mac) to devices. If profit is an indicator of where resources are being allocated, then there is no clearer visualization of the difference between the two companies' strategies.
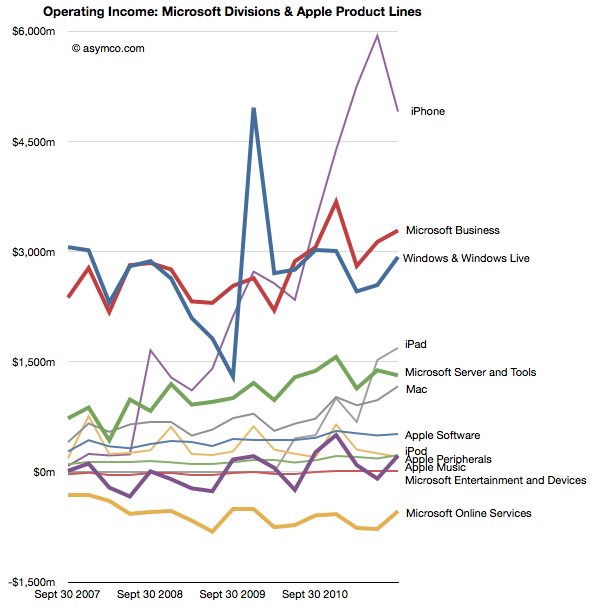
The following is a mix of all products/divisions operating income in one dense line chart (thicker lines are Microsoft divisions, thin lines are Apple products).
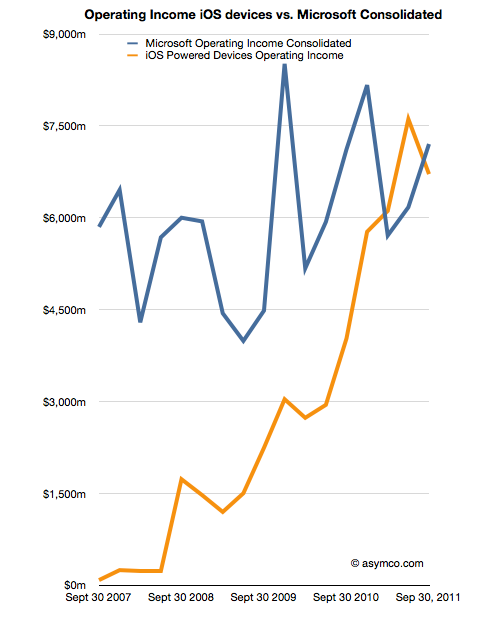
Finally, the comparison of operating income of iOS devices vs. consolidated operating income from all of Microsoft's businesses.
As iOS shifts into its fifth iteration my guess is that Apple will continue its growth trajectory. As Microsoft continues to adapt or protect its businesses from tablets and mobiles, will they grow? If so, how? Microsoft has shown consistency, but that is becoming less and less desirable.
I began thinking carefully about Apple in 2005 when the stock was priced at around $55/share. I remember that the events which made me consider Apple in a different light were the launch of the iPod shuffle and the launch of the Mac mini. Both moves signaled to me that the company was serious about competing with non-consumption. At that point I thought that the company was a potential opportunity as an investment.
But I also remember that many people at the time thought that the stock price was too expensive. At $50, the company was much more expensive than the year before. The stock started 2004 at about $11/share. The reason it had climbed so much was that the iPod began to be a real world-wide growth phenomenon. Buying Apple was buying into the iPod and many said the price was unsustainable given such a strong dependency on fickle consumer tastes. It was a much riskier proposition than that of competitors like Dell and HP which made product for reliable buyers like enterprises.
Indeed, by 2006, the shine was off. In the first half of 2006 the stock collapsed from $85 a share to $50, a fall of 40%. It was becoming clear that with mobile phones taking on more music playing features, the iPod was not going to be a big story for long. What's more, Apple had just announced that they were switching to Intel for the Mac product line. Investors saw just how vulnerable the company still was and considered that the Mac brand was in jeopardy as it transitioned to becoming a Windows-friendly machine.
However, in 2007 the company's value recovered with the introduction of the iPhone. Suddenly there was a new product to drive sales. Nobody knew by how much or how but there was a sense that the iPhone was enough to keep Apple from oblivion.
Yet, again, in early 2008 the company lost 40% of its valuation. In a rather inexplicable period following the launch of the MacBook Air, the company's shares went into free fall. Inexplicable because the company continued to deliver solid growth with 2008 calendar quarters showing between 32% and 155% EPS growth.
Then the recession came. It caused another 40% share price collapse. Growth slowed to a range of 11% to 61% during 2009. As the marco "headwinds" blew over, by the end of 2009, with the help of a lukewarm response to the iPad, the company's value recovered to its 2007 level. In the mean-time its earnings more than doubled.
It may not appear to be the case, but throughout this volatile period, the investment thesis remained fairly constant: Apple is a rather small collection of product bets. Owning Apple meant riding the iPod or the iPhone or the iPad as waves of growth. As soon as one growth wave was seen to start to fade, investors would say the same thing: Apple is done.
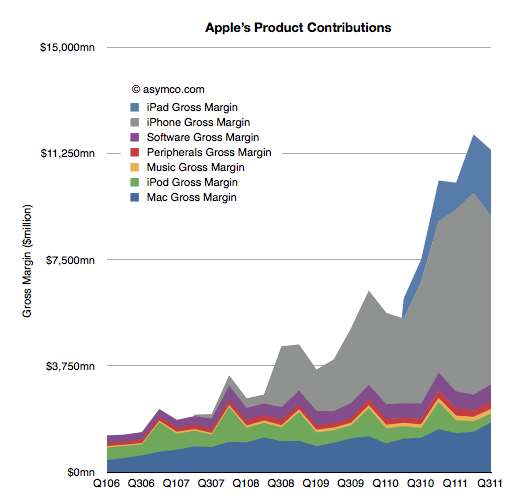
The chart below shows just what that looks like in terms of product contribution to gross margin.
The investment thesis is the same today. I've had dozens of conversations with fund managers and if anything, it's even more about betting on products. The iPhone and the iPad make up such a large part of profits that the company seems to be nothing but those two things. So if there is any hint that those products might slow down, the stock is sold off.
What intrigues me about this investment thesis is not whether the signals of growth are interpreted correctly or not, but rather that an investor in Apple in 2006 was considered perfectly rational valuing Apple as an iPod company as much as an investor today is perfectly rational valuing Apple as an iPhone company. Why would anyone buy Apple for any other reason? There is no evidence that Apple can be anything more. Any fund manager positing a different point of view would surely be limiting her credibility.
The consensus is that the value of future, unknown products is zero. Not only that but the probability that there will be any products at all is equally zero. Not only that but whatever Apple does to create new products is not perceptibly valuable. The company is simply the sum-of-the-product-parts and nothing more. Cash flows from current products can easily be shown to be more than the current valuation so even these products are deeply discounted. If and when a new product shows up, it will be considered and maybe if it shows promise, the stock will reflect that, briefly.
A corollary to this investment thesis therefore is that the process of product development at Apple is worth nothing. It does not matter if the company has shown an ability to disrupt and to create new categories. The past is not a predictor. The value of the company is a discounted cash flow of current products--discounted for the odds of commoditization, which are seen to be quite high. A new hit product is a windfall, a winning lottery ticket. Something that you cannot count on.
Think about that in a different context. That's like valuing Pixar on the box office revenues of its current movie. If Cars 2 is not beating records, Pixar is suddenly nearly worthless. The fact that Pixar repeatably creates blockbusters would be seen as meaningless. The way they built a reliable pipeline with predictable cost structures for movie-making is not interesting.
However, the fact is that Pixar did not get acquired on the basis of the last hit it made. It was acquired for its system of production. This can be confirmed not only by the price paid but by the fact that the organization was not folded into the Disney machine. It stands alone and is given autonomy. So at least in the movie making industry, predictability is seen as valuable.
So why is Apple not valued as a process company?
I think the answer lies in the lack of understanding or belief in a theory that predictable success in product development is possible. Until and unless an explanation is available that persuades a majority that Apple is as much a hit factory as Pixar then Apple without the products will intrinsically be valued at zero.
The premise of the stock market today is therefore that being innovative in technology is meaningless. Innovations are valuable but there is no such thing as an innovation process. If there was such a thing then we could measure it and put a number of its value. Until then innovation is nothing more than a spin of the roulette wheel.