Asymco

Asymmetric Intelligence

revenue

  1. Apple Earnings: Evaluating my performance

    Research · 24 comments

    As chronicled here, this quarter I went through three sets of estimates. This is a departure from my standard practice of sticking with one forecast made three months in advance. I felt last quarter was filled with materially important developments which deserved updating.

    So how did I do?

    I wanted to see if the additional information helped or hindered predictability so I put my three predictions side-by-side and measured the errors. I also added the "legal leak" from April 15th (published April 19th) to see whether it was an accurate predictor. The table below shows the error rates with the lowest error highlighted.
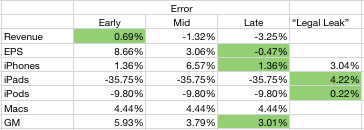
    It's clear that my error rate decreased as new information was used. It's also clear that the "legal leak" was very accurate. What follows is a discussion of each line item.

    The iPhone forecast was very accurate both early and late in the quarter. At 1.36% error it was even lower than what was leaked by Apple. I used the information about China and Verizon to boost sell-in and increased the growth rate to 110%. That proved to be the right call. I did not pay any attention to talk of component shortages as I did not consider them to affect Apple whose market share of devices is so low. I would score my "late" estimate as an "A".

    Even though I disclaimed it, my iPad forecast was very inaccurate. In contrast, the leak was very accurate. Although mitigated by the higher sell-through (5.1 million) shipments were constrained by the change in product. Details like the date of shipment, the date of announcement and the ramps made this a particularly difficult transition to predict. At 36% error, I score it as an "F".

    The iPod error was about 10%. That's mediocre. The product dropped in sales by 17% (vs. 10% expected). Again, the mitigating factors, like higher mix of iPod touch and thus increased prices helped to keep the financial performance decent. I score this as a B-.

    The Mac prediction was accurate. The error was less than 5%. I will discuss the Mac business in a separate posting but it suffices to say that the growth was excellent but predictable. I score my prediction as an "A-".

    Revenues were reasonably predictable however pricing seems to have been affected by exchange rate volatility. The iPhone turned out to have a huge average selling price ($660) which made up for the lower revenues from iPad. The error of 3.25% is acceptable. I score it as an "A".

    The Earnings number was very accurate. The error for the late estimate was less than one half of one percent. This bottom line number is a function of all the other numbers so it's the most encompassing. You have to account for factors like interest income, changes in the number of outstanding shares and tax rates. None of these are predictable. However, I was lucky. With an error below 1%, I rate this as an "A+".

    My overall performance as a grade point average would be 3.43 or B.

  2. Revisiting Estimates for Apple’s second quarter earnings (ended March)

    Research · 29 comments

    Estimates for Apple’s second quarter earnings ending March | asymco.

    Since making the original estimates In January,

    • Revenue: $24.5 billion
    • EPS: 5.89
    • iPhone unit sales: 18.4m
    • iPod unit sales: 10m
    • Mac unit sales: 3.6m
    • iPad unit sales: 7.3m
    • Gross margin percentage: 38.8%

    I revised them at the end of March to the following:

    • Revenue: $25 billion
    • EPS: 6.21
    • iPhone unit sales: 17.5m
    • iPod unit sales: 10m
    • Mac unit sales: 3.6m
    • iPad unit sales: 7.3m
    • Gross margin percentage: 39.6%

    In the past I was comfortable keeping untouched estimates made three months in advance. This quarter however there have been several developments during the quarter which were unforeseen and cause me to revisit my estimates.

    1. The Verizon iPhone launch. Observations of the event focused on line lengths and buying activity. However, Apple reports shipments not sell-through. I believe the deal structure was such that Apple obtained a very large order as condition to the relationship. The January and March update analysis did not consider this order size. We have also more data on sales from HTC and RIM and there is no letup in the market's growth. As a result I am revising the growth for the iPhone back up to 110% y/y and 18.4 million units.
    2. Crucially, I'm increasing iPhone ASP to $625 on the basis of this new demand and the likely delay of iPhone 5 launch.
    3. The iPad 2 launch. This product is still too young to see production and sales patterns. However, demand for the second version seems higher than for the first. Distribution is broader too. The unknown is production. I am keeping the unit number at 7.3 million which is the same as the level of CQ4.
    4. China is booming. The Chinese New Year occurred in the quarter and since last year that has meant a sequential increase in device sales for Apple. But it's a double edged-sword. Almost all production activity is shut down during the holiday period. Apple depends on China exclusively for manufacturing so they will certainly be affected. So whereas it's likely that we'll see increased demand from China this year due to even better distribution, macroeconomics and brand value I'm unsure if supply rose to match. Overall, I'm not changing unit growth due to his increased demand but I'm cautioning that there could be downside bias in my estimates.
    5. The tsunami disaster in Japan will affect some demand in Japan and some of the supply chain will be disrupted. However, the effect will be felt more by weaker competitors. It's possible that the event will amplify the shortages that Apple's pre-purchase agreements already created. The consequences are bad news for Apple's competitors but I rate it as neutral for Apple.

    Given these new facts coming to light, I would update my estimates as follows:

    • Revenue: $25.5 billion
    • EPS: 6.43
    • iPhone unit sales: 18.4m
    • iPod unit sales: 10m
    • Mac unit sales: 3.6m
    • iPad unit sales: 7.3m
    • Gross margin percentage: 39.9%

    Resulting EPS growth would thus be 93%.

    For the record, I value my January estimates since they are based on long-term pattern recognition rather than transient events and thus are more useful in forming a market theory.

    However, these transient events cannot be ignored and analysis needs to be informed by both theory and events. I will be watching to see which set of predictions (early, mid or late) will be more accurate.

  3. First quarter PC forecast: Windows down 2%, Mac+iPad up 250%

    Research · 100 comments

    Charles Arthur of The Guardian writes that PC sales "may have passed their peak".  That's a powerful, concise statement. It's backed up by a quote from Gartner's Mikako Kitagawa:

    "This was the third consecutive quarter of mobile PC shipment declines in the US"

    IDC even lays part of the blame to something called "media tablets"[1]:

    "While it's tempting to blame [PC] decline completely on the growth of media tablets we believe other factors [...] played equally significant roles."

    But there are several problems with both IDC and Gartner's analysis of the market. It's hard to make out causality from their data. There is separation by vendor but not by operating system and there is exclusion of devices hired to do the same jobs as PCs.

    For this reason, I need to do my own analysis. I retrieved Gartner's public statements on the overall market and layered actual Mac and iPad units sold. I also added my estimates for the Q1 2011 quarter just ended to complete the picture.

    We can now get an understanding of how the industry behaves with and without various platforms. The chart at the left gives the various growth rates of the market with platforms isolated from each other. I apologize for the shape of the chart but the scale does not permit a concise visual.

    Including the iPad, the total PC growth is shown by the blue line. It shows that the market peaked during the recovery but is now slowing considerably.

    The green line shows the PC industry excluding both the Mac and the iPad. Although it might include Linux or computers sold without an OS, the label "Windows PC" is a fairly close approximation. It shows that the market excluding Apple entered contraction this quarter and is out of sync with overall economic recovery and growth.

    The red line shows the behavior of the Mac franchise. It's well ahead of the overall market with 2x to 3x the growth. This has been a pattern for over 18 quarters.  I had some thoughts on this in a November 2010 hypothesis.

    But the most telling line is the orange line which includes both the Mac and the iPad. In an industry where growth is usually measured in single digits, the iPad business brings growth in three digits.

    This near tripling of unit sales is symptomatic of fundamental change that cannot be ignored. Although some analysts contend that the iPad is not causal to the decline in other PC sales, teasing out platforms data seems to show a divergent view.

    The bottom line is that Windows-only computer units are down 2.0% while OSX-based computer units are up 272% (this excludes both the iPhone and iPod touch).

    Correlation is not causation but tests or surveys where substitution can be proven do exist. For example, a recent survey shows that 77% of users reported that their PC usage decreased after getting a tablet. It also showed that 28% considered their iPad as their primary computer.

    So coupling the sales data with the usage data does point an accusatory finger for the decline on the iPad.

    In addition, some vendors are being hit harder than others which also hints at where substitution is happening. For example, IDC reports that Acer US unit shipments fell 42% in the first quarter and 16% globally (Gartner's numbers are less dramatic but in the same direction). Since Acer is known for its netbook computers it's another telling sign of possible substitution (Acer's own management has indicated as much.)

    So the weight of evidence is beginning to be conclusive: the iPad is the new PC. It should be clear by now that the iPad moves computing into new contexts so it does not yet substitute the PC market but extends it and increases consumption. Substitution is happening in low-end grazing type of usage, a place where the PC was ill-fitting anyway. Incumbent vendors might actually be relieved that the lower margin netbook is finally being supplanted and they can concentrate on the higher end.

    --

    Notes:

    1. Analysts like to call the iPad a "media tablet" but the same AdMob survey shows media consumption to be one of its least popular uses.
  4. Google vs. Android Part V

    Research · 145 comments

    When I began the series of posts on Google vs. Android I put forward some questions about the business logic of Google becoming an operating system supplier, especially as that role can be seen as being counter-productive to Google's strategy.

    I noted three strategy costs associated with a zero priced systems software bundle.

    1. A opportunity cost with other platform vendors, namely Apple who might retaliate against Google's core business.
    2. Versions of the software being usurped and modified to provide distribution to Google's competitors.
    3. Damage to Google's brand and positioning and negotiating power in relation with other members of their value chain.

    More fundamentally, Google-as-systems-software is asymmetric to Google-as-cloud-software and contradicts the value proposition that Google enables value in the web not in accessing the web. Android appears to be a nod in the direction that systems software still matters.

    In my numerous posts on the need for integrated development in the era of mobile computing, I also criticized any device vendor that chose to rely on a software stack from an external supplier as foolish. I claimed that they would end up creating uncompetitive products. I thus labeled Google's pursuit of them as ultimately futile.

    More than a year has passed since I began this critique of Android. It seemed quixotic as Android volumes exploded and a mad rush to the platform spun it into becoming the biggest mobile platform by units.

    However those costs did not go away. As the platform grew, they compounded. At first I wondered whether Google management was seriously considering the cost or whether it was giddy with the semblance of success.

    Well, finally, it seems that Google management has begun to acknowledge that these costs exist. In a recent Bloomberg story there are many claims that Google is reversing many of the operating principles of Android. Namely:

    • Restrictions on who gets what version of software when
    • Restrictions on what changes can be made to the software
    • Requirements for approval for source code changes

    These changes, if feasible, will affect the ecosystem dramatically. It will also reduce the second type of cost associated with the platform (the cost of enabling competitors.)

    Good news for Google then.

    There are still the other problems (disconnect from business model, loss of goodwill, damage to negotiating power). But there is actually a more sinister new problem brought about with the new crackdown: Android will no longer be disruptive.

    I also wrote a few posts (e.g. What has Android done for Apple?) where I claimed that Android has the power to accelerate smartphone adoption, especially in the "Wild East." The power of Android was with the little vendors--the ZTE and Huaweis of the world. They could finally make smartphones cheaply--almost as cheaply as voice phones--and not have to negotiate licenses and pay for software IP.

    It would be these smaller "unbranded" vendors that would really disrupt and, with them, Android would become ubiquitous for the billions of mobile broadband non-consumers.

    However, with the new policies, it's much harder for this to happen. Smaller vendors will look at the new hoops they have to jump through and probably say "no thanks." In a beauty contest, they don't look so good next to the big brands.

    They may turn to homebrewed versions of Linux or new forked Androids. This redefinition of openness will essentially remove Google from the disruptive trajectory of mobile computing.

    So we're back to the old question: Google vs. Android, who wins? If Android still has hidden costs to Google and, with its sheep's clothing cast aside, no longer offers significant distribution to the low end then how will Google benefit? The answer that there will be additional ad revenue does not cut it. That revenue would have come from placement deals with other incumbent platforms (just like Google manages to compete on PCs without having to provide its own OS).

    As Google figures this out, its licensees are at the mercy of the ensuing decision. Good luck with that.


  5. Predicting iPhone sales for dummies

    Research · 36 comments

    Apple's second fiscal quarter has just ended. Time for analysts to put forward their predictions for the quarter's report (due in about 3 weeks.) If history is a guide, the estimates will range quite widely and accuracy will be determined mostly by the ability of an analyst to predict iOS device sales (and iPhone most of all).

    How hard can it be?

    It depends on what you choose to prioritize as the proxy for sales. In competitive markets there is usually a constraint on demand and rivalry among suppliers. If that's your assumption you might want to use samples from the sales channel as a proxy. That means sampling distribution channels and sales through to end users at retail. You might even watch competitors and index them to each other using historic market shares.

    In markets where demand outstrips supply, the best method would be to determine the constraints to production and measure those.

    In Apple's case we know from company statements that Apple faces more demand than it can supply. That makes things easier for the amateur because she can just figure out production. In other words, the logical way to forecast Apple's iPhone sales is to guess how many they can make.

    That is not trivial since production data is not public. However, we have historic sales data. We also can make assumptions about how much inventory is carried (some data is actually available here as well.)

    Combining these public data sets we can build up a model of production ramps and look for patterns of growth.

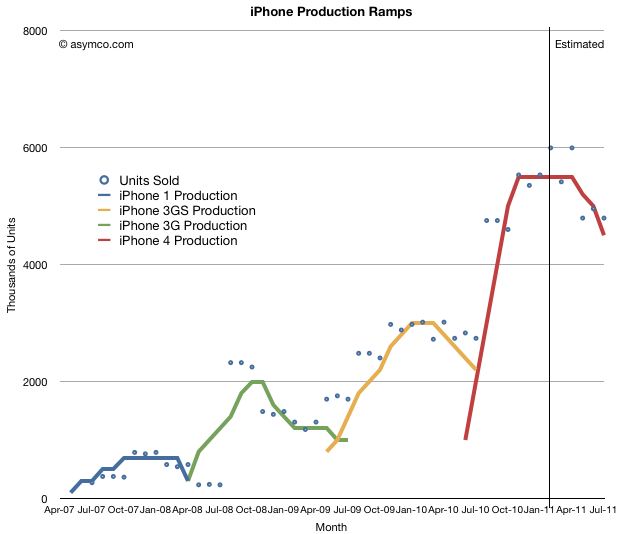
    So here are the patterns of sales for the four versions of iPhone sold to date with some production ramps overlaid. The monthly sales are approximations based on actual quarterly sales divided over the months according to the number of days available.

    The assumptions are:

    1. Inventory during any one month has to be greater than zero.
    2. Inventory must be minimized. Ideally it should not exceed 2 million units and preferably should be around 1 million units at any given time.
    3. There is a limited amount of overlap between production of various generations. I.e. once a new version is launched, the older product should end production. Continuing sales of older model should be made available from inventory.

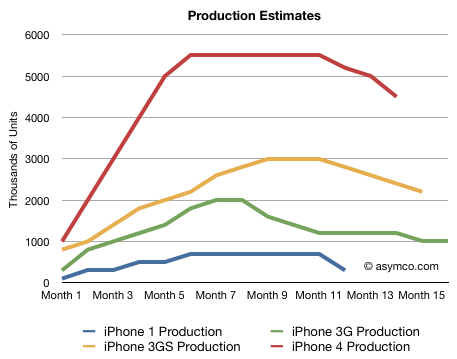
    The following chart shows the ramps for the various versions of iPhone that satisfy these assumptions and are shown relative to the same time frame (each line shows the number of units produced per month for each generation of iPhone):

    I need to stress that this is just my estimate. It's an approximation and not reality. What it does is give reasonably accurate predictions for units sold.

    What I've always assumed is that each new version of the iPhone sells twice as many units as the last. This is roughly translated into: each ramp is roughly double the previous ramp (at least on average). The data bears this out. Apple has been very considerate in keeping products on similar cycle times so that we can see this pattern emerge.

    Once you build these models, forecasts are not that hard to make:

    • The current generation will probably sell around 60 to 65 million units.
    • The product will still sell for at least one more quarter (CQ2, FQ3)
    • We know how many have been sold so far, so we can be pretty sure what will happen in the quarter just ended and the one just starting.
    • Looking at the pattern between generations, we can guess what the iPhone 5 curve will look like and build up the units forecast by month and quarter.

    You can sanity-check the forecast by looking at overall market shares for Apple and overall market growth. If share moves too far up or down it might makes sense to revisit the data.

  6. Analysts: Apple's growth next year to drop to half of what it could obtain during the recession

    Research · 72 comments

    Apple is having difficulty meeting demand for the iPhone and the iPad. It is growing both businesses at more than 100% and they make up about 65% of revenues, and 71% of profits. The Mac business is also growing at 2x to 3x the PC industry.

    Being supply constrained makes it therefore a great challenge to forecast future growth for the company. Supply issues and ramp rates are needful of an operational expertise few possess outside of the industry. But many take up this challenge, myself included. We put up our numbers every quarter and get scrutinized and challenged for our failures.

    So it's always exciting to see how others are looking at the big picture. Sadly, with the growth data being what it is, there seems to be a great deal of pessimism around the company's prospects. The P/E ratio has remained at despondent levels for over two years, barely tracking with the P/E of the S&P 500 and not reflecting the company's historic or current growth.

    The logical explanation is that pricing reflects a consensus that growth will fall off a cliff. Indeed this can be confirmed. Bloomberg surveyed analysts and they say:

    Apple’s sales may climb 54 percent to $100.3 billion this fiscal year, which ends in September, the average prediction of analysts surveyed by Bloomberg. Growth may slow to 18 percent the following year.

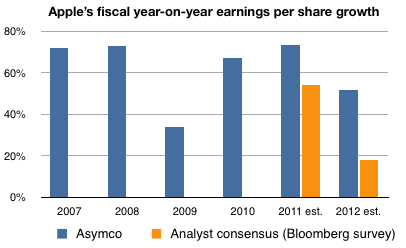
    Fifty percent growth this year and 18 percent next year is indeed catastrophic. Consider the company's recent history as shown in the following chart:

    The company has been growing earnings around 70% a year since 2007 at least. The exception being 2009 when in the middle of the worst recession for a century the growth dropped to 34%.

    I took the liberty of adding the estimates cited above to the chart (in orange) while putting forward my estimates for the same time frame.

    I am, I believe, conservative in my estimates (for example, my estimates do not take into account any new product categories Apple may launch). But the prospect of 18% growth for the fiscal year beginning this October is quite hard to justify knowing what I know about the markets Apple competes in. As I've amply described in this blog, the mobile computing (aka post-PC) shift is underway and Apple is leading the charge. The prospect of billions of unserved customers beckons and Apple is crushed with demand.

    But let's not quibble about billions of desperately underserved consumers. The thing that sticks out from the chart is that analysts are forecasting growth about half of what Apple was able to achieve in 2009--a time when consumer spending practically stopped world-wide and there was talk of another depression.

    Either they're in agreement that we're in for something resembling a global plague starting in six months or they believe Apple is singularly positioned to drop the ball.

    I would love to hear some these scenarios defended because I see no evidence for either.

  7. Ads for ads: The ad-supported app bubble

    Research · 25 comments

    By one estimate (Gartner), about 81% of apps downloaded today are free. The way free apps are able to generate revenue is through advertising. 16 percent of application store markets' $5.2 billion revenue was generated from advertising.

    But advertising what?

    It seems that most of the ad dollars spent on in-app ads are spent by developers to promote other apps. I'd like to get hard data to prove this, but assuming it's true, we have to ask if the apps being promoted through ads in apps are free apps seeking more revenue from ads...from other apps.

    To put it bluntly, the $816 million that "comes from advertising" is not coming from consumers but churning around the ecosystem like a hot potato. This figure is said to triple this year.

    It's arguable that this is only logical. App users are pre-qualified as app downloaders so it makes sense to target them through apps for more apps. But where does value actually flow into the ecosystem from consumers? This problem of commerce through apps being nothing but virtual app goods implies that there is a bubble forming. This is more likely to be a problem for Android as the ratio of advertising to purchase of Android apps is higher than on iOS, but it's a problem for all app advertising.

    It's even more ironic that the developer looking to create revenues through their app is promoting competing apps seeking the same user.

    I don't see how this can end well.

    The only way ads really work is for users to transfer cash for underlying value. Aside from paid apps which have entertainment or functional value, how much spending from traditional ad buyers (brands) is targeting apps? Perhaps transitioning ad buyers is what Apple had in mind a year ago with iAd. Signs so far are not encouraging that their approach is working. That may be bad news for Apple, but it's worse news for AdMob.

  8. Talent follows where business models lead: The Media Business Disruptions

    Research · 46 comments

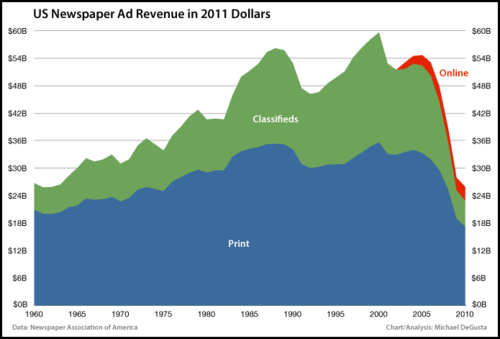
    Michael DeGusta created beautiful and informative charts on how The Newspaper Business Implodes.

    With charts, he also told the story of how the recorded music industry followed a similar path:

    Image (media.tumblr.com)

    He writes:

    As in the music business, digital revenue is failing to make up for the loss of traditional revenue. Ominously, online revenue is largely flat, basically unchanged from 5 years ago and still below its 2007 peak.

    What I find fascinating is how both industries reacted to the crisis of old media. They embraced the new "digital" distribution model, earnestly tried to transplant their business models and found no succor.

    Many observers may say that both print and music businesses were "foolish" and that they ignored the new medium of web. That somehow management dithered and missed the new wave blaming failure on incompetence. Putting aside the fact that all industry participants seem to have conspired to be foolish at the same time, this is not supported by the data. As the charts show, both industries built digital businesses. Newspapers have some of the most desirable web properties and digital music is a growing business with clever new distribution deals. They became quite smart in their respective adaptations of web distribution.

    They may have started slowly but there are many cases where incumbents reacted slowly to technological change, and won.

    But it's not working.

    The reason is that what we have here is a disruption. Unlike a sustaining technological shift, the new medium of the web did not permit the same business models to continue. Money was being made, just not in the same way and thus could not support the cost structures of the incumbents. Consumption of news and music is increasing but the way that it is valued is changing.

    Furthermore, it's become modularized. All the objects contained in a newspaper could, with the web, be offered independently of one-another (opinion, news, classifieds, lifestyle can each be built by specialists.)

    This is because the technology of the printing press benefits the integration of content while the technology of the web benefits the disintegration of content (similar phenomenon to the music industry's bundling into albums, vs. unbundling of digital downloads.)

    Now I'm going to take a leap and suggest that a re-birth of the container of the newspaper in the tablet medium will require a re-integration once again. As I've pointed out before in The integrated iPad news daily: Read all about it! the answer is not in integration or disintegration per se. It's in approaching the question of value chain evolution with an eye toward what is good enough and what isn't. Integrate when the product is emerging and unsatisfying, modularize when the product is mature and over-serving.

    We're observing the same phenomenon with television. Netflix, a distributor, is vertically integrating by entering production with an exclusive top talent series.

    Developers are not the only innovators that see disruption happening. Just like in "The Daily", in music and television, talent follows where business models lead.

  9. The billion dollar Smart Cover

    Research · 105 comments

    I was only half-joking when, on first sight, I tweeted that I will buy a new iPad 2 to go with my new Smart Cover. The new iPad cover is enchanting.

    It also seems to be enchanting to many.

    I'm estimating that at least 60% of iPad buyers will get one. Based on an estimate of 36 million iPads sold in 2011 and an average price of $48 (70% polyurethane and 30% leather mix), the total revenue for Smart Covers will top $1 billion this year.

    I further estimate that with a very modest gross margin of 75% (average cost to produce of $12), the Smart Cover could contribute $777 million to Apple's gross margins.

    The iPad by itself should generate $23 billion in revenue and a contribution of $7.7 billion. That means that the Smart Cover will add 4% to sales and 9% to gross profits. If taken as a bundle, the iPad+SC will increase gross margin over the iPad alone by nearly 200 basis points (taking it from 33% to 35%).

    It will be interesting to compare the Smart Cover business with competitor tablet businesses.

  10. The Race to a Billion

    Research · 22 comments

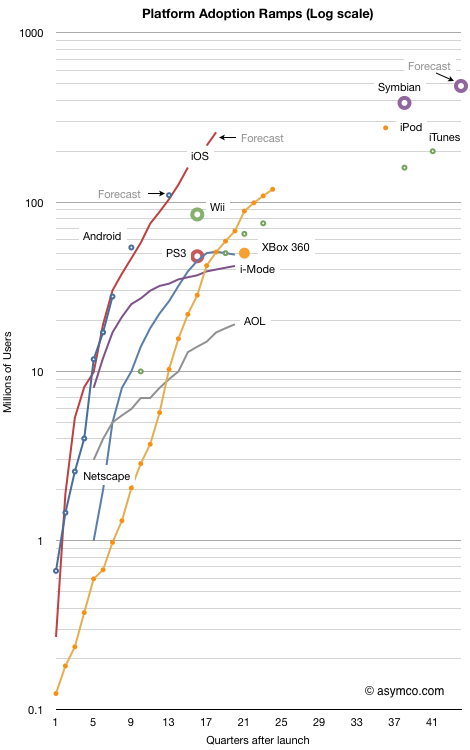
    I last looked at the race to a billion in September 2010. I've now added a few more data points to the tracked platforms and also added points for the major console game platforms and Symbian.

    The chart shows the cumulative number of users (approximated by units sold) for 11 platforms indexed to the same starting date. The horizontal axis is the number of quarters since a platform launched. Every fourth quarter is numbered so each number on the axis represents a new year. The last number on the axis represents 10 years.

    The vertical axis is the cumulative number of users on a logarithmic scale. Each number of the vertical axis is 10x more users than the previous number. The top of the graph represents a billion users.

    The overall chart shows how quickly a platform has grown and is bounded by a billion users and a decade of usage.

    When judging the performance of a platform, the adoption slope and sustainability over time is perhaps the most interesting measure.

    One can see how many platforms slow down before reaching 100 million and so far none have hit the billion mark (Windows has but not in the 10 year time frame of this chart.) Looking at game consoles also shows the limits of a narrowly focused platform. They performed better than i-Mode and Netscape but not as well as iTunes or iPod which themselves have growth limits.

    If you're looking for the "fastest growing" title, it's a toss-up. Both iOS and Android are following almost identical trajectories.[see Notes]

    The absolute highest cumulative sales total is Symbian, though now that it's been deprecated, it's set to be bypassed.

    It does appear that Android and iOS each have the potential to reach a billion users in less than a decade. Perhaps Android will do so faster but the mobile computing platform race will not play out as the personal computing platform race did.

    ---

    Notes:

    1. For Android I used my own summary data for historic performance except for the last estimate and forecast which came from IMS Research.
    2. iOS forecasts are my own.
    3. Symbian data comes from VisionMobile. Forecast is based on Nokia's 150 million additional sales prediction.
    4. Game console data is current as of end of 2010 via Wikipedia.
    5. Other data sourced from Morgan Stanley.
  11. iOS distribution: do operators hold the keys?

    Research · 31 comments

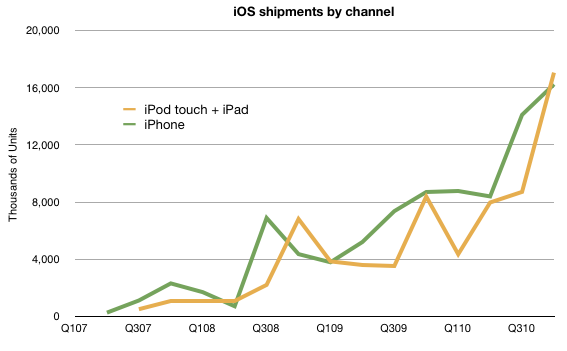
    As iPad shipment volumes increase and as the iPod touch becomes the de-facto iPod, it's time to look at the overall split between iOS devices.

    I will focus the discussion between iPhone and iOS "others" because I believe the two categories differ greatly in terms of their positioning and market strategy due to the different channels.

    The company does not provide iPod touch units shipment data but it can be estimated that, based on overall iOS numbers released in September, iPod touch represents approximately 50% of iPod units sold.

    If we put all we know together about volumes, we have the following chart:

    Note that iPod touch has, occasionally outsold the iPhone. The pattern of approximately equal volumes for the two types of products is likely to continue depending greatly on the growth rates.

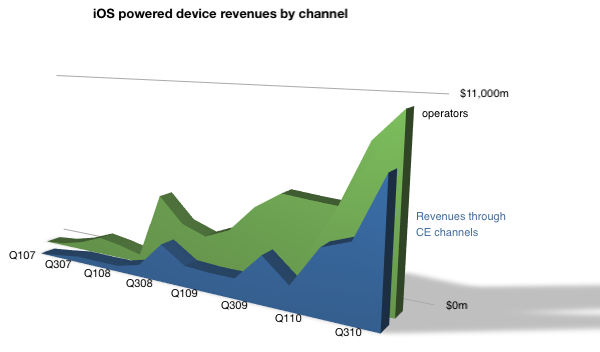
    Next, I turn the spotlight on revenues.


    Over $10 billion flowed in from Operators, and a bit under $8 billion from other channels.

    Note that I labeled the iPod touch and iPad as non-operator channel (Consumer electronics) distribution. Although this is not entirely true (and conversely iPhones are often sold through Apple stores) this gives a rough indication of split.

    The iPhone business is staying ahead of the other iOS businesses but the gap is narrowing.

    As previously noted, the iPhone is a unique product in Apple's portfolio. It depends on a distribution channel that no other product was designed around. This has advantages and disadvantages. The advantage is a high margin due to service revenue sharing but the disadvantage of network incompatibilities, politics and a range of telecom-related regulations.

    What I believe is that the non-operator channel will grow as a proportion of iOS revenues. This is both as iPad grows to disrupt personal computing and as the iPad emerges as a communications tool.

    As time passes, I believe Apple is motivated to also move revenues to its traditional channels. Whether, or to what extent, cellular phones will move in that direction remains to be estimated.