Asymco

Asymmetric Intelligence

revenue

  1. Microsoft has received five times more income from Android than from Windows Phone

    Research · 197 comments

    Microsoft gets $5 for every HTC phone running Android, according to Citi analyst Walter Pritchard, who released a big report on Microsoft this morning.

    Microsoft is getting that money thanks to a patent settlement with HTC over intellectual property infringement.

    Microsoft is suing other Android phone makers, and it's looking for $7.50 to $12.50 per device, says Pritchard.

    HTC Pays Microsoft $5 Per Android Phone, Says Citi.

    A rough estimate of the number of HTC Android devices shipped is 30 million. If HTC paid $5 per unit to Microsoft, that adds up to $150 million Android revenues for Microsoft.

    Microsoft has admitted selling 2 million Windows Phone licenses (though not devices.) Estimating that the license fee is $15/WP phone, that makes Windows Phone revenues to date $30 million.

    So Microsoft has received five times more income from Android than from Windows Phone.

    Looking forward and assuming that Microsoft can receive this type of settlement from about half of the Android license takers, then the prospects of a windfall from Android dwarf the expected income from Windows Phone.

    Google's Android seems the best thing that could have happened to Microsoft's mobile efforts, ever.

    I could also calculate how the Android license income could be further funneled to Nokia (via their current agreement with Microsoft) for promotion of its phones. Thus, an Android licensee could reduce his margins in order to promote a competitor's products.

  2. A new mobile phone market index

    Research · 90 comments

    Measurements of "share" are abundant. There is journalistic value in summarizing performance in a single figure of "share" but it usually is a very limiting view. For example in the global mobile phone market there are at least the following measurements available:

    1. Share of all handset units sold
    2. Share of installed based of handsets (penetration)
    3. Share of smartphones
    4. Share of mobile computers
    5. Share of value (revenues) captured
    6. Share of profits
    7. Share of platforms
    8. Share within a given platform
    9. Share by regions/countries/geographies/demographics

    One could go on. So performance in a market can only be measured if you know to what end is that measure applied. Are you trying to determine current performance or are you assuming that the future will be different and trying to figure out what that future will look like?

    There is no good answer. It depends. But at least we can combine more than one share value into a summary. Mark Hernandez suggested that I put forward a "composite index" to measure vendor performance. I am willing to give it a try. The first iteration can be an unweighted average of four "shares":

    1. Share of all handset units sold (global)
    2. Share of smartphones
    3. Share of value (revenues)
    4. Share of profits

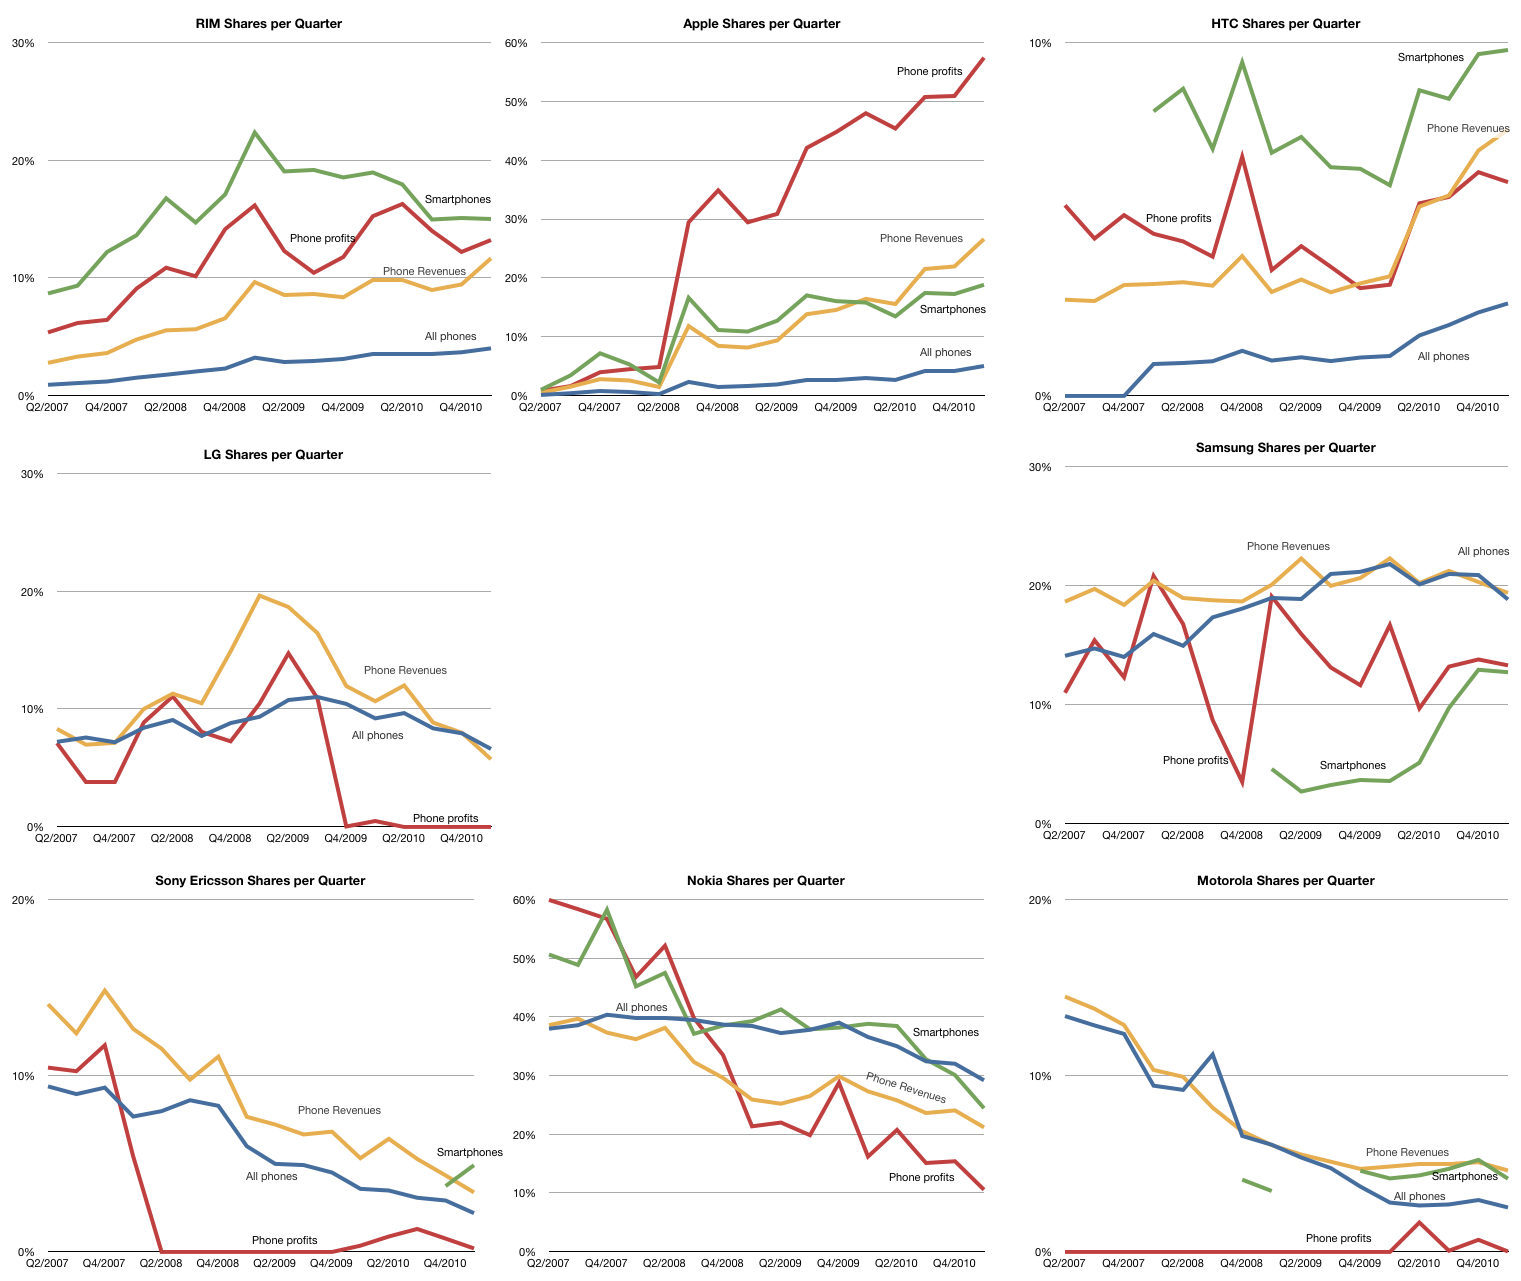
    The raw data for each share is shown in the following charts (note change of vertical scale: each gridline represents 10%).

    Note that the vendors are arranged in a particular way: top row are entrants, bottom row are incumbents with late incumbents from Korea arranged in the middle.

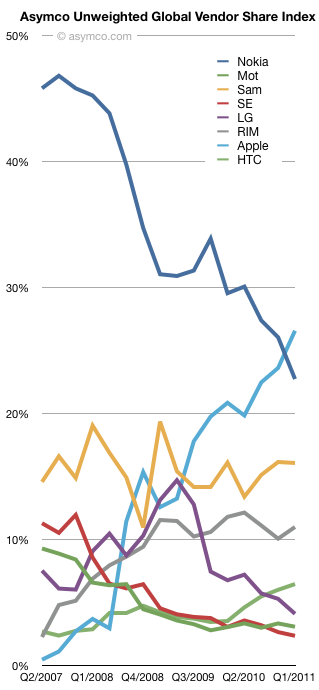
    Taking the average of each of the lines above, the unweighted share index (Units, Smartphones, Value and Profit) is shown below:

    Over the time period since Apple's entry in the market, the index shows interesting patterns:

    • Apple and Nokia trading places
    • Relative stability for Samsung
    • A leveling off for RIM
    • The Peaking for LG
    • Very tightly coupled declines for Motorola and Sony Ericsson
    • Gradual improvement in HTC

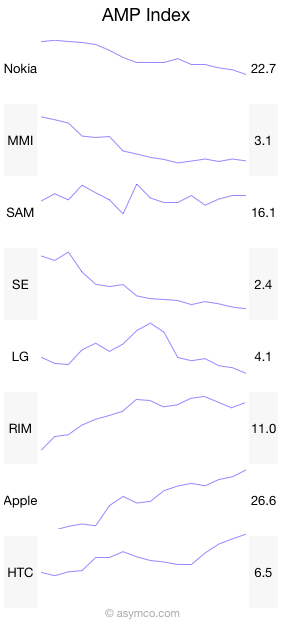
    And here it is in sparklines:

    Like many indices, this is a generalization that measures a section of reality. The value is in its use as a benchmark. If nothing else, it has journalistic value. I'm open to suggestions on how to improve it. Perhaps some form of weighting would be useful. Also, if anyone can suggest good name for it, it might be easier to communicate.

  3. The Rawr Chart

    Research · 30 comments

    The challenge with any performance metrics is that there is no single measure of business performance which is conclusive. The last few posts have covered mobile phone vendor performance measured by various methods. Growth (sequential, yearly and compounded multi-year),  margins, shares (units, profit and sales), rankings and time series. I've distinguished between smartphone pure plays and the diversified. Each is trying to shed light on what is a multi-dimensional puzzle.

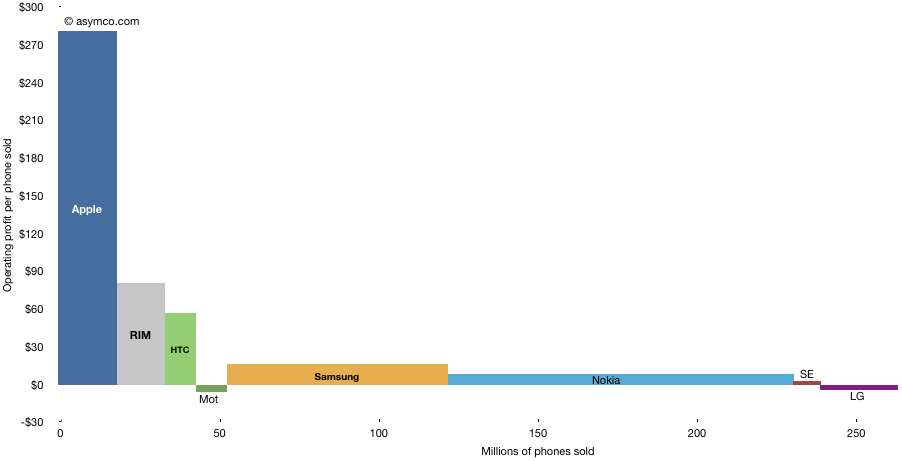
    I've used various charting tools and visualizations and they each render some clues, but the following chart is one of my favorites. It shows the way operating profit was distributed among the top vendors.

    The areas each represent the profit from mobile phone sales in Q1. The horizontal axis shows the volume of units and the vertical the profit per unit. It thus shows how "efficiently" profits were captured a unit basis. It also shows at a glance the different strategies employed and how they reflect performance. It shows who made money and who didn't. It shows the magnitude of differences.

    The shape of this chart has not changed in the last few quarters but it prompts speculation on how it might change in the following few years.

    I struggled to find a catchy name for this type of chart but @JustinD put it well here. Rawr indeed.

  4. Did Microsoft pay for the wrong Skype?

    Research · 51 comments

    When a company is acquired, the price paid is usually higher than what the company is worth. This is because there is a "control premium" that needs to be paid so that the acquiring company can control the destiny of the acquired company (while the seller loses that right). So the question has to be what does the premium (or excess cost) buy? What is the value of that control? What will be the new destiny? Whose destiny is changed?

    Clayton Christensen succinctly defined the value in any company as the sum of three constituent parts: resources, processes and business models. Market value can be nothing more and nothing less than these three things.

    An acquisition has to be positioned on one of these targets just like a product is positioned on a specific market. The problem with being deliberate about where the value lies is that once positioned a certain way, the integration team will begin to execute on that plan. This means that the thing you decided was worth most (e.g. resources) gets all the attention and the other potential sources of value (processes or profit models) are discarded.

    This argument reduces to there being three separate companies being available. The buyer pays for all but gets to keep only one.

    When you look at it this way you realize that the reason most acquisitions fail is that the buyer throws away most of the real value in the company.

    For example, when looking at Skype through Microsoft's eyes, they could be valuing it for its resources (employees, management team, customers, or intellectual property.) Or they could be valuing its processes (how it makes software and how it recruits customers) or it could be its business model (viral distribution, very low prices with wide distribution, plan to disrupt telecommunications). Each of these is a separate, mutually exclusive deal with separate integration plan and separate strategic justification. Each is targeting a separate Skype.

    If Microsoft were to pay a premium for Skype's resources then they will probably not make use of the processes or business models. There is some value in this Skype. Microsoft could use the customer base to sustain their existing businesses and to up-sell services.

    But what if the real value is not in resources but in the business model? A model which would allow for Microsoft to disrupt its core business. Perhaps Microsoft could use the Skype approach to creating new customers, eliminating its partner network and expensive direct sales force. This would be a different Skype. It would have the potential to transform Microsoft. Microsoft could become what Skype is now: a communications network or carrier that disrupts the way people use network operators.

    This type of value exists in Skype but its asymmetry with Microsoft's core would make it a very tough sell internally. A recent article pointed out that when Skype was up for sale last time, Google's acquisition was sabotaged internally by people who realized that peer-to-peer would be "incompatible" with the centralized architecture of Google's services. If not for the effort of certain individuals, Google might have ended up with Skype and destroyed it with internal antibodies.

    Chances are that Microsoft paid for Skype's customers and engineers but will not apply the innovations of viral peer-to-peer distribution or disruptive voice pricing. If that happens then perhaps Microsoft will pay $8.5 billion for the wrong Skype and telecom disruption will find another home.

    Notes:

    Adapted from an answer published in Capital.bg. My thanks to Adrian Georgiev for asking the right questions.

  5. Ascent of the entrants: Taking food from the mouths of giants

    Research · 34 comments

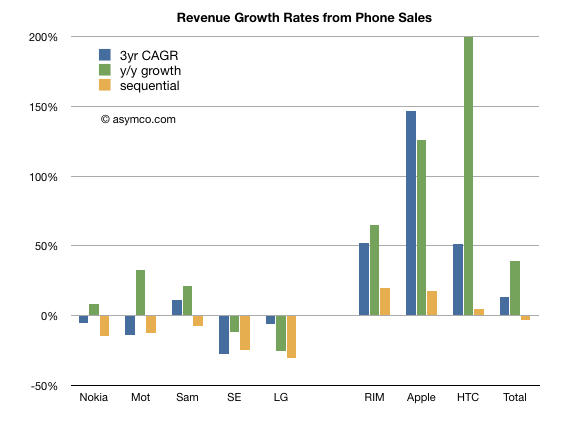
    Revenues for the eight phone vendors I track increased overall during the last three years. The compounded annual growth was about 13%.  However the growth was not evenly distributed. The following chart shows revenue growth across three time frames: Three year compounded, year/year quarterly and sequential quarterly.

    I separated the incumbent companies from the "entrant" smartphone vendors for contrast.

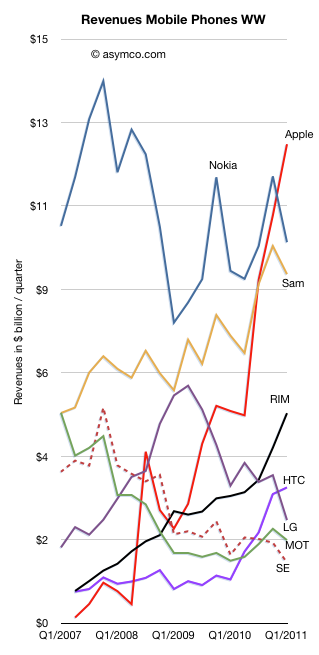
    Looking at individual performance, the following chart shows how each vendor performed over time:

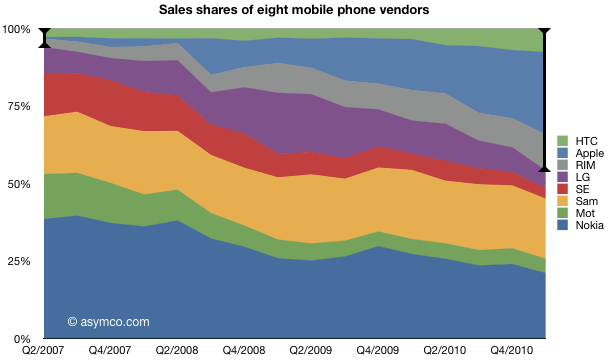
    The share of revenues is shown in the following chart (I highlighted the smartphone cohort):

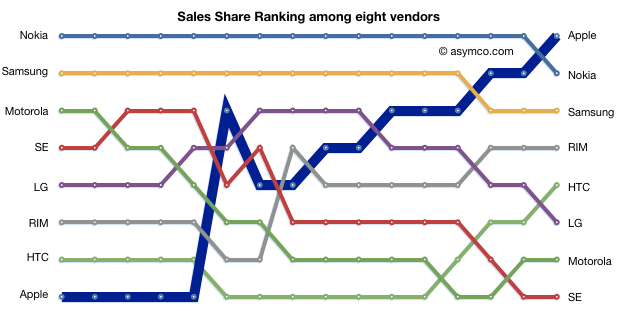
    The ascent of the entrants is shown in the league table below:

    The headline that Apple became the biggest phone vendor in the world by revenue has already flashed across the feeds of the world. It's another straw on the camel's back. But I'd like to take a moment to note that this is not just an Apple story.

    If you look at the league table, RIM, HTC and Apple were at the bottom three years ago and now they are either in the top or the middle. RIM in particular deserves credit for reaching the fourth spot and staying there. HTC also has shown a late surge to fifth passing LG, Motorola and Sony Ericsson in the process.

    Combined, these vendors went from taking in about one dollar in 20 (6%) in Q2 2007 to nearly half the money (46%) in Q1 2011. As the market also grew, the total amount went up an order of magnitude. From $1.8 billion to $21 billion in three years. Not bad for niche players.

  6. Staying Hungry

    Research · 47 comments

    During the June 2005 Stanford University commencement speech Steve Jobs famously cited the farewell message placed on the back cover of the 1974 edition of The Whole Earth Catalog: "Stay hungry, stay foolish."

    That's a nice, pithy statement. I interpreted "Being Foolish" in a Quora answer as "being naive about how things should be and thus allowing oneself to see how things could be."

    But what about staying hungry?

    A clue comes from the recent Fortune article "Inside Apple" (currently only available in print or as an app). Even with nearly $70 billion in liquidity Steve Jobs claims "Apple is a company that doesn't have the most resources." A former executive claims "We've always fought for resources...Steve and Tim in general want to be sure you need what you're asking for."

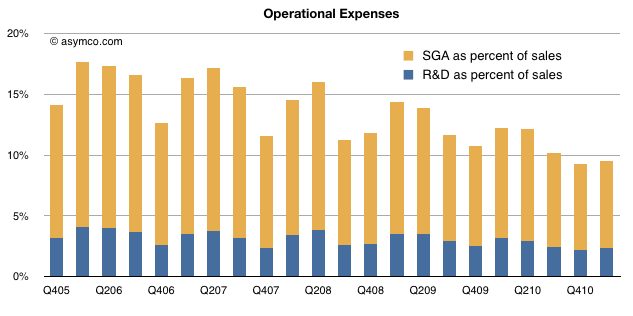
    Note that "resources" here does not mean capital. It means people. Apple is very constrained in the number of people it has available to put on projects. The evidence is in the company's operational expenses. They make up only 9.5% of sales (nearly an all time low). R&D in particular is only 2.4% of sales ($581 million).

    Although R&D doubled in three years sales nearly double every year.

    Looking at the totals over the last full year, the company spent about $2 billion on R&D. A remarkably efficient way to generate $47 billion in sales or $13.3b in operating income. Another way of thinking about it is that every dollar spent in engineering resulted in $23 in sales.

    So the way to interpret the "stay hungry" metaphor is as a low cost structure. It has great advantages beside efficiency. There is a constant demand for focus and justification of spending. There is a certain level of cross-fertilization as people are assigned to varying projects to maximize their utilization. Finally, there are the subtle but powerful influences of hunger: motivation, invention and intense attention to details.

    For Apple this aphorism seems to be more than a motivational poster quote.

  7. Combating superlatives fatigue

    Research · 18 comments

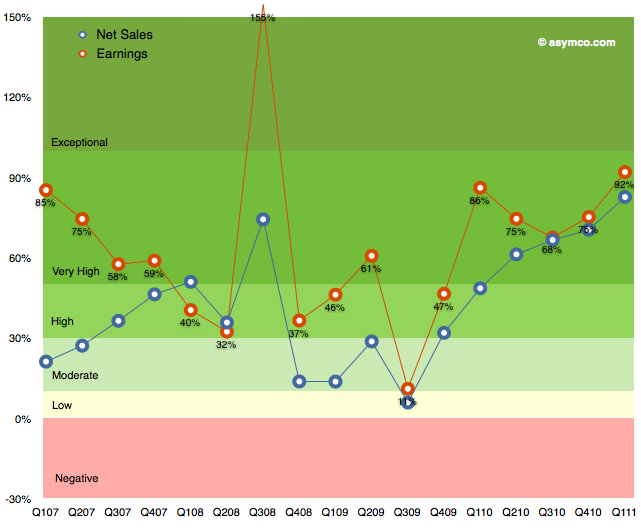
    The following chart shows Apple's growth for net sales and earnings over the last few years. I've used a grading system with color coding to show bands of growth.

    It's easy to become de-sensitized to the scope of these numbers, but it bears repeating: the growth has been steadily increasing since 2009.

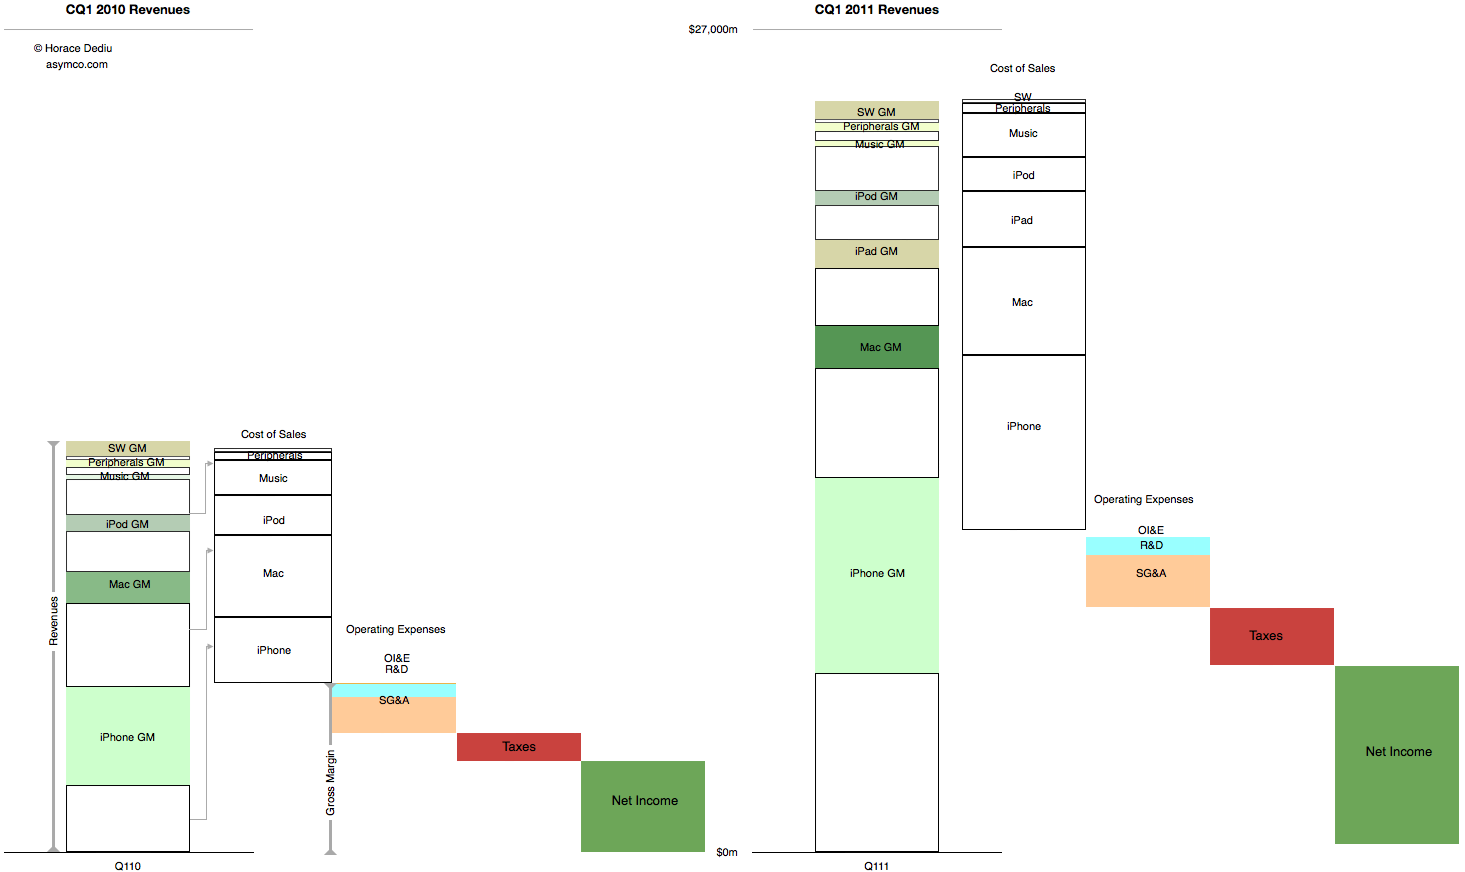
    These abstractions in growth can also be shown in a direct "before-and-after" view of the income statement.

    This latter view gives an idea of how much bigger the company's business is now vs. a year ago. Not just on the revenues but also the cost of these revenues and what is retained.

    This story never gets old.

  8. Windows generates less than a third the profit of iOS + OS X

    Research · 35 comments

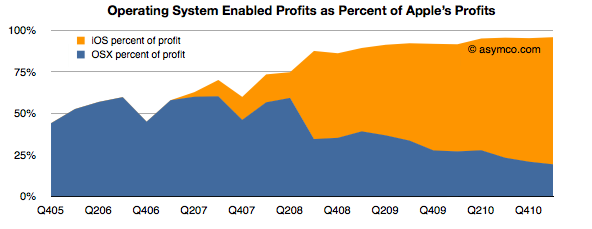
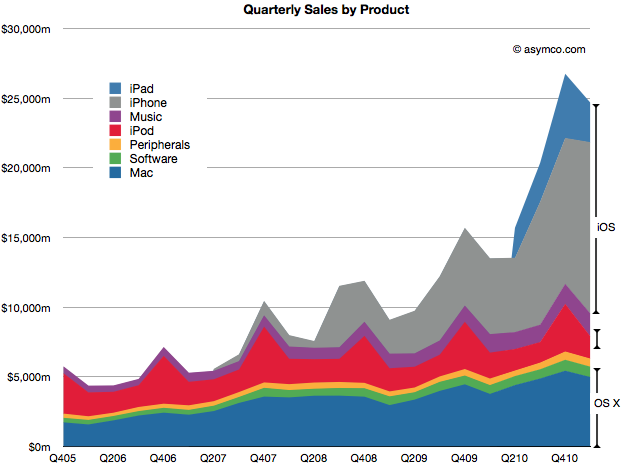
    While a lot of the credit for Apple's success is rightfully assigned to the iOS franchises, the OS X business has more than quadrupled in five years. This has happened without drastic price fluctuations. Neither holds for the overall PC industry which has seen both volume and sales decline while prices have eroded along with profitability. On top of that, growth has nearly evaporated.

    Even with this success, as a percent of total value created, the Mac accounts for a mere 13% of Apple's profit. Including software as part of the OS X franchise implies that OS X is enabling about 20% of Apple's profits.

    iOS, on the other hand, is accounting for more than 75%. These two platforms combined amount to 96% of Apple's profits (up from 50% four years ago).

    That's $9.8 billion from integrated platform-based devices. One can be very confident that this profit would be negligible without the software differentiation only Apple can offer.

    So $10 billion is a lot of profit to obtain from a business enabled by operating system platform software. How can we get a handle on this size? How big is this? We could compare this with another operating system business: Microsoft Windows.

    Microsoft's Windows and Windows Live Division obtained sales of $4.445 billion in the last quarter with an operating income of $2.764 billion.

    So although Windows earned about twice what the Mac earned[1], iOS and OS X together enable 3.5 times the profits of Windows.

    The end of an era is the end of growth in one dominant business model. The PC era was epitomized by the concentration of profits in a dominant operating system vendor. That growth has slowed if not ended. The post-PC era is being kicked off by a new business model where profits are being concentrated in a hardware+software+service integrator.

    --

    1. Or you could read this as: The Mac generates half the profits of Windows while iOS devices generate 2.3x Windows profits.
  9. When exceptional growth is not an exception

    Research · 69 comments

    Apple's last quarter's sales growth was an impressive 83%. It was not as high as the 92% earnings rise because there was a higher mix of iPhones this quarter than in the past. The iPhone is the most profitable product in Apple's portfolio so it impacts the gross margin significantly.

    The iPhone is, in fact, a huge part of Apple's business. In units it reached 5% global share and 14% US share. I'll go over the overall industry data as soon as all the major reports are in, but already it has been estimated that Apple is the largest phone vendor by profit and sales.

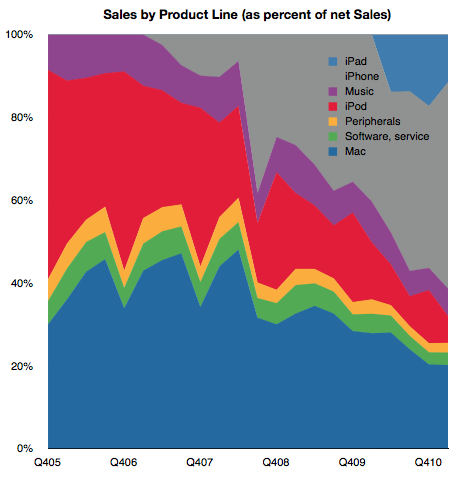
    In the following chart, you can see just how important the iPhone has become. Together with the iPad and iPod touch, iOS-powered devices make up about 65% of sales. That's almost three times the value of OS X based products which make up 23% of sales. That also leaves just 12% of sales not directly affected by these two juggernaut platforms (though music and peripherals are clearly indirectly affected by Apple's own platform products.)

    The following chart shows the same information as shares of total net sales.

    I've read that some of the uncertainty around Apple's future prospects is driven by the perceived vulnerability of these new blockbuster iOS products. At first glance this growth looks quite unprecedented and hence risky. 65% of sales from iOS did not exist four years ago. If you look at the sector it's hard to find any company that has doubled its sales in a few years from completely new product lines. Especially a mature company over 40 years in the business.

    Well, there is one.

    If you look again at the second chart above, you'll note that the proportion of sales held by iOS devices has mostly replaced the sales share that used to be held by iPod, itself a product that did not exist four years prior to the time of these charts.

    Apple consistently doubled its sales on the basis of the iPod. It's now consistently doubling on the basis of iOS.

    Exceptional claims require exceptional evidence. But that's exactly what the investment thesis for Apple should be: Exceptional growth is no exception.

    Steve Jobs himself said it well once: "I wasn't alive then, but from everything I've heard, Babe Ruth only had one home run. He just kept hitting it over and over again."

    Even this exceptionalism is not unique. It happens not just at Apple, but at another of Jobs' creations: Pixar.

    Perhaps this magic formula for exceptionalism is itself a fluke but what if it's not. What if blockbusters are really something that can be built with repeatable consistency. What would that be worth?

  10. The Apple Growth Scorecard

    Research · 127 comments

    Apple's revenue for the first quarter was $24.7 billion, which at 83% was the largest quarterly revenue growth they ever experienced. Operating margin was an all-time high of almost $7.9 billion, representing 31.9% of revenue and yielding 95% EPS growth.

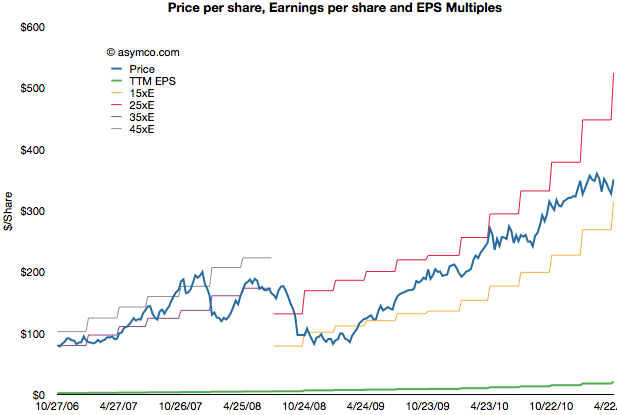
    After earnings were announced the share price reached $350.7. This includes $70 in cash. Trailing twelve months' earnings were $20.97. That makes the Price/Earnings ratio 16.7. Excluding cash, P/E is 13.4. The average growth over the past four quarters was 77%.

    The following chart shows the share price vs. earnings. The green line is price and the blue line is share price. I also added multiples of the earnings to show how the stock traded in certain multiple bands.

    During the period of 2006 to 2008 the company shares traded roughly in a range of 35 to 45 P/E. Since late 2008 the company shares have traded in a range of 15 to 25 P/E.

    Share prices normally reflect potential earnings growth and past growth is often a good indicator of near term continuing growth. This is why the P/E is usually a proxy for growth. The faster the growth, the higher the P/E. Or so one would think.

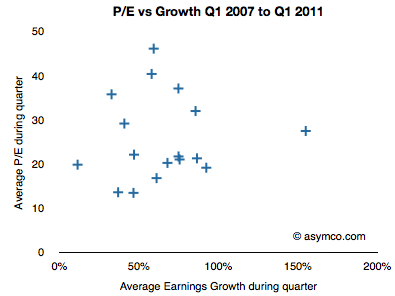
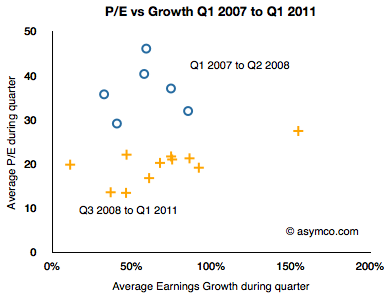
    If we look at the P/E vs. earnings growth for Apple, the picture is not encouraging.

    P/E and Growth don't seem at all correlated. In fact, if we drop two outliers it almost seems that P/E is insensitive to growth.

    I took the data a step further and separated it into two clusters: pre-recession and post-recession.

    The blue circles are Q1 '07 to Q2 '08 and the orange plus signs are Q3 '08 to Q1 '11. As the share price chart implies, there is a clustering of averages where during the 2007 and early 2008 period P/Es were in the 35 range while growth was in the 50s and P/Es below 20s with similar or higher growth ranges.

    As the following scorecard shows, the company's growth is exceptional. That does not seem to be something that is being valued by investors.


  11. Estimates for Apple's third fiscal quarter (ending June)

    Research · 42 comments

    Apple's CFO guidance statement:

    We expect revenue to be about $23 billion compared to $15.7 billion in the June quarter last year. We expect gross margin to be about 38%, reflecting approximately $55 million related to stock-based compensation expense. We expect OpEx to be about $2.5 billion, including about $255 million related to stock-based compensation expense. We expect OI&E to be about $70 million and we expect the tax rate to be about 25%. We are targeting EPS of about $5.03.

    Apple Management Discusses Q2 2011 Results - Earnings Call Transcript - Seeking Alpha

    Last quarter Apple guided revenue growth at an aggressive 63% with an EPS growth of 47%. They delivered 83% and 93% respectively.

    They are now guiding about 47% revenue growth and 43% EPS growth and my current estimates are 65% and 72% respectively based on the following:

    • iPhone units: 14.7 million (75%)
    • Macs: 4.3 million (25%)
    • iPads: 9.8 million (200%)
    • iPods: 8.0 million (-15%)
    • Music (incl. app) rev. growth: 25%
    • Peripherals rev. growth: 25%
    • Software rev. growth: 25%
    • Total sales: $25.8 billion (65%)
    • GM: 38.5%
    • EPS: $6.02 (72%)

    The biggest uncertainty remains iPad growth. This will be the first quarter where we can dial in a y/y growth rate. I'm being bullish with 200% because I believe the ramp for the iPad 2 may get sorted out. There are also more countries being opened up this quarter (13 this week).

    Apple's stock price to earnings ratio has dropped to 16.72. Ex-cash it's 13.5. On a forward basis (my estimates) it's 8.3. Apple's valuation is now a case for business historians to discuss because I don't think there are modern precedents.