Despite memory cost inflation being a big deal, it still doesn't fundamentally impact Apple’s tremendous earnings power, Bernstein’s Mark Newman shared in a CNBC interview.
That’s not to say he doesn’t expect iPhone production costs to rise, though.
Heightened component costs could push iPhone prices up by as much as 15%, Newman added, while bumping the overall average selling price by nearly 12% as some customers trade down to cheaper models.
That increase is substantial, and it comes down to a staggering 237% surge in mobile DRAM contract prices since Q2 2025, along with a 70% jump in NAND.
Despite the pressures, Newman feels that Apple separates itself from the pack through its superb execution.
He says Apple is “managing better than competition,” led by unmatched scale advantages, supplier leverage, product mix, and durable pricing power.
To his point, Apple has evolved into a powerful platform company with a walled-garden ecosystem that locks users in.
That matters a ton when costs spike.
That’s why even with the memory pressures in play, Bernstein’s modeling points to iPhone gross margins dropping by nearly 1.5 percentage points by Q4 2027.
Though that’s meaningful, Newman believes the EPS impact will be substantially offset by higher-margin services revenue, mix shift, and aggressive cost management.
Apple’s AI ambitions outweigh rising costs
Newman’s bullish take on Apple centers around AI.
Instead of AI technology showing up just as a chatbot, Newman says Apple is deploying it as a system-level layer, making its ecosystem stickier.
What makes this possible is a hybrid design that handles as many requests on the device and reroutes the heavier ones (advanced reasoning) through Private Cloud Compute using Google’s Gemini.
That robust setup ensures Apple’s privacy positioning remains firmly intact, while delivering cutting-edge responses and features.
Unlike many of its peers, Apple isn’t in the race to win AI benchmarks or translate those gains into tangible financial gains. It just needs those features to change behavior and pave the way for healthier services revenue.
In fact, some of the earlier modeling supports that logic.
Morgan Stanley’s April 2025 survey, as reported by Investing.com, was an early “tell” that Apple’s AI pitch would likely move the needle.
At the time, 51% of iPhone owners said they were “extremely likely” to upgrade in the next 12 months. More importantly, those respondents, compared with those in the previous fall, showed a 12% higher willingness to pay $9.11 per month for Apple Intelligence.
For perspective, the significant Siri 2.0 (the next phase of Apple Intelligence) is reportedly set to launch in spring 2026, according to Mac Rumors.
Ironically, Apple stock was initially blasted for lagging in the AI realm. However, as we’ve gotten deeper into the cycle, Newman argues that investors have actually felt a lot “more comfortable” amid the AI wars.
NB: A 237% surge in mobile DRAM contract prices since Q2 2025 is spot pricing. Apple does not buy on the current market but what is effectively on a futures market. It would behoove the reader to calculate the quantity of orders for e.g. SoC and Memory Apple places vs. hyperscalers. If "51% of iPhone owners said they were “extremely likely” to upgrade in the next 12 months" that's 850 million people worldwide.
We are proud to report that we have a new record for our installed base with more than 2.5 billion active devices. -Tim Cook
2.5 billion active devices follows the announcement of 2.35 billion active devices a year ago, a growth of 150 million devices in one year. Let's examine some of the implications.
By my estimate, Apple sold about 250 million iPhones, 23 million Macs, 40 million Watches, 70 million iPads. Other devices including Apple TVs, Apple Vision Pro, Apple HomePods may add another 10 million units. Therefore the total number of "connected" devices sold is around 400 million/yr.
Adding 150 million to the active base in one year implies that 250 million devices are replacements, many surely are reused but also at least a third (37.5%) of units sold are expanding the base. This is reflected by management's occasional mention that "nearly (or, alternatively, over) half of customers who purchased a <product> being new to the product".
In the last quarter and for quite some time, <product> has been the Mac, the iPad and Apple Watch. If we use my estimates of units sold during the full year that means 17 million Macs, 20 million Watches and 35 million iPads were sold to new users. These add up to 72 non-iPhone new devices in use. That suggests about 78 million new iPhone users.
How does this compare to the following pattern:
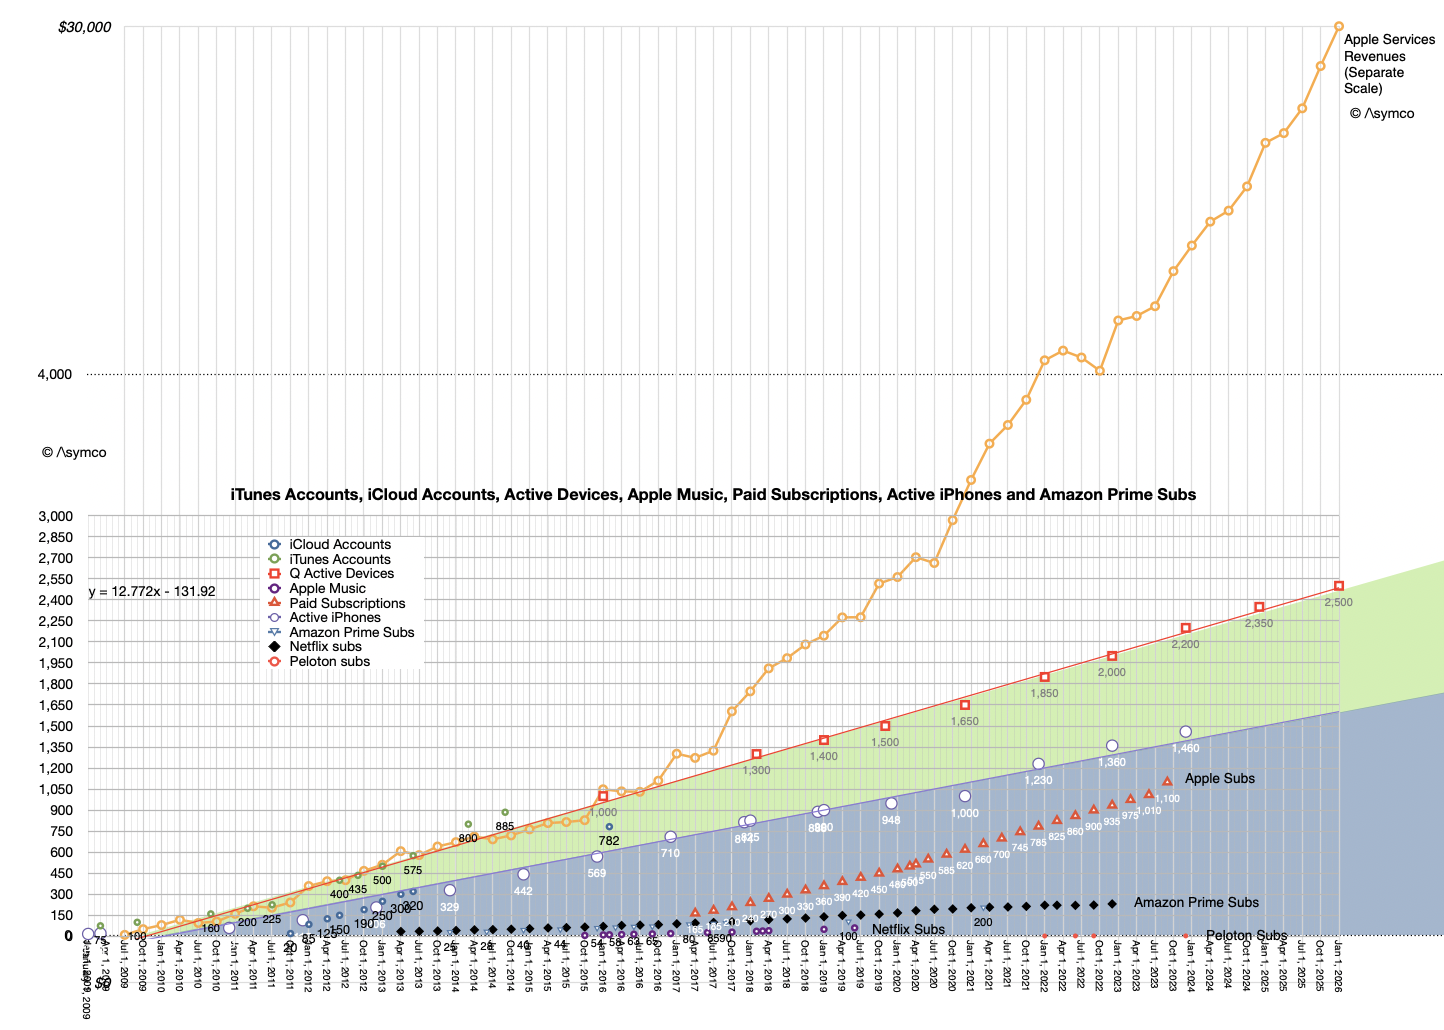
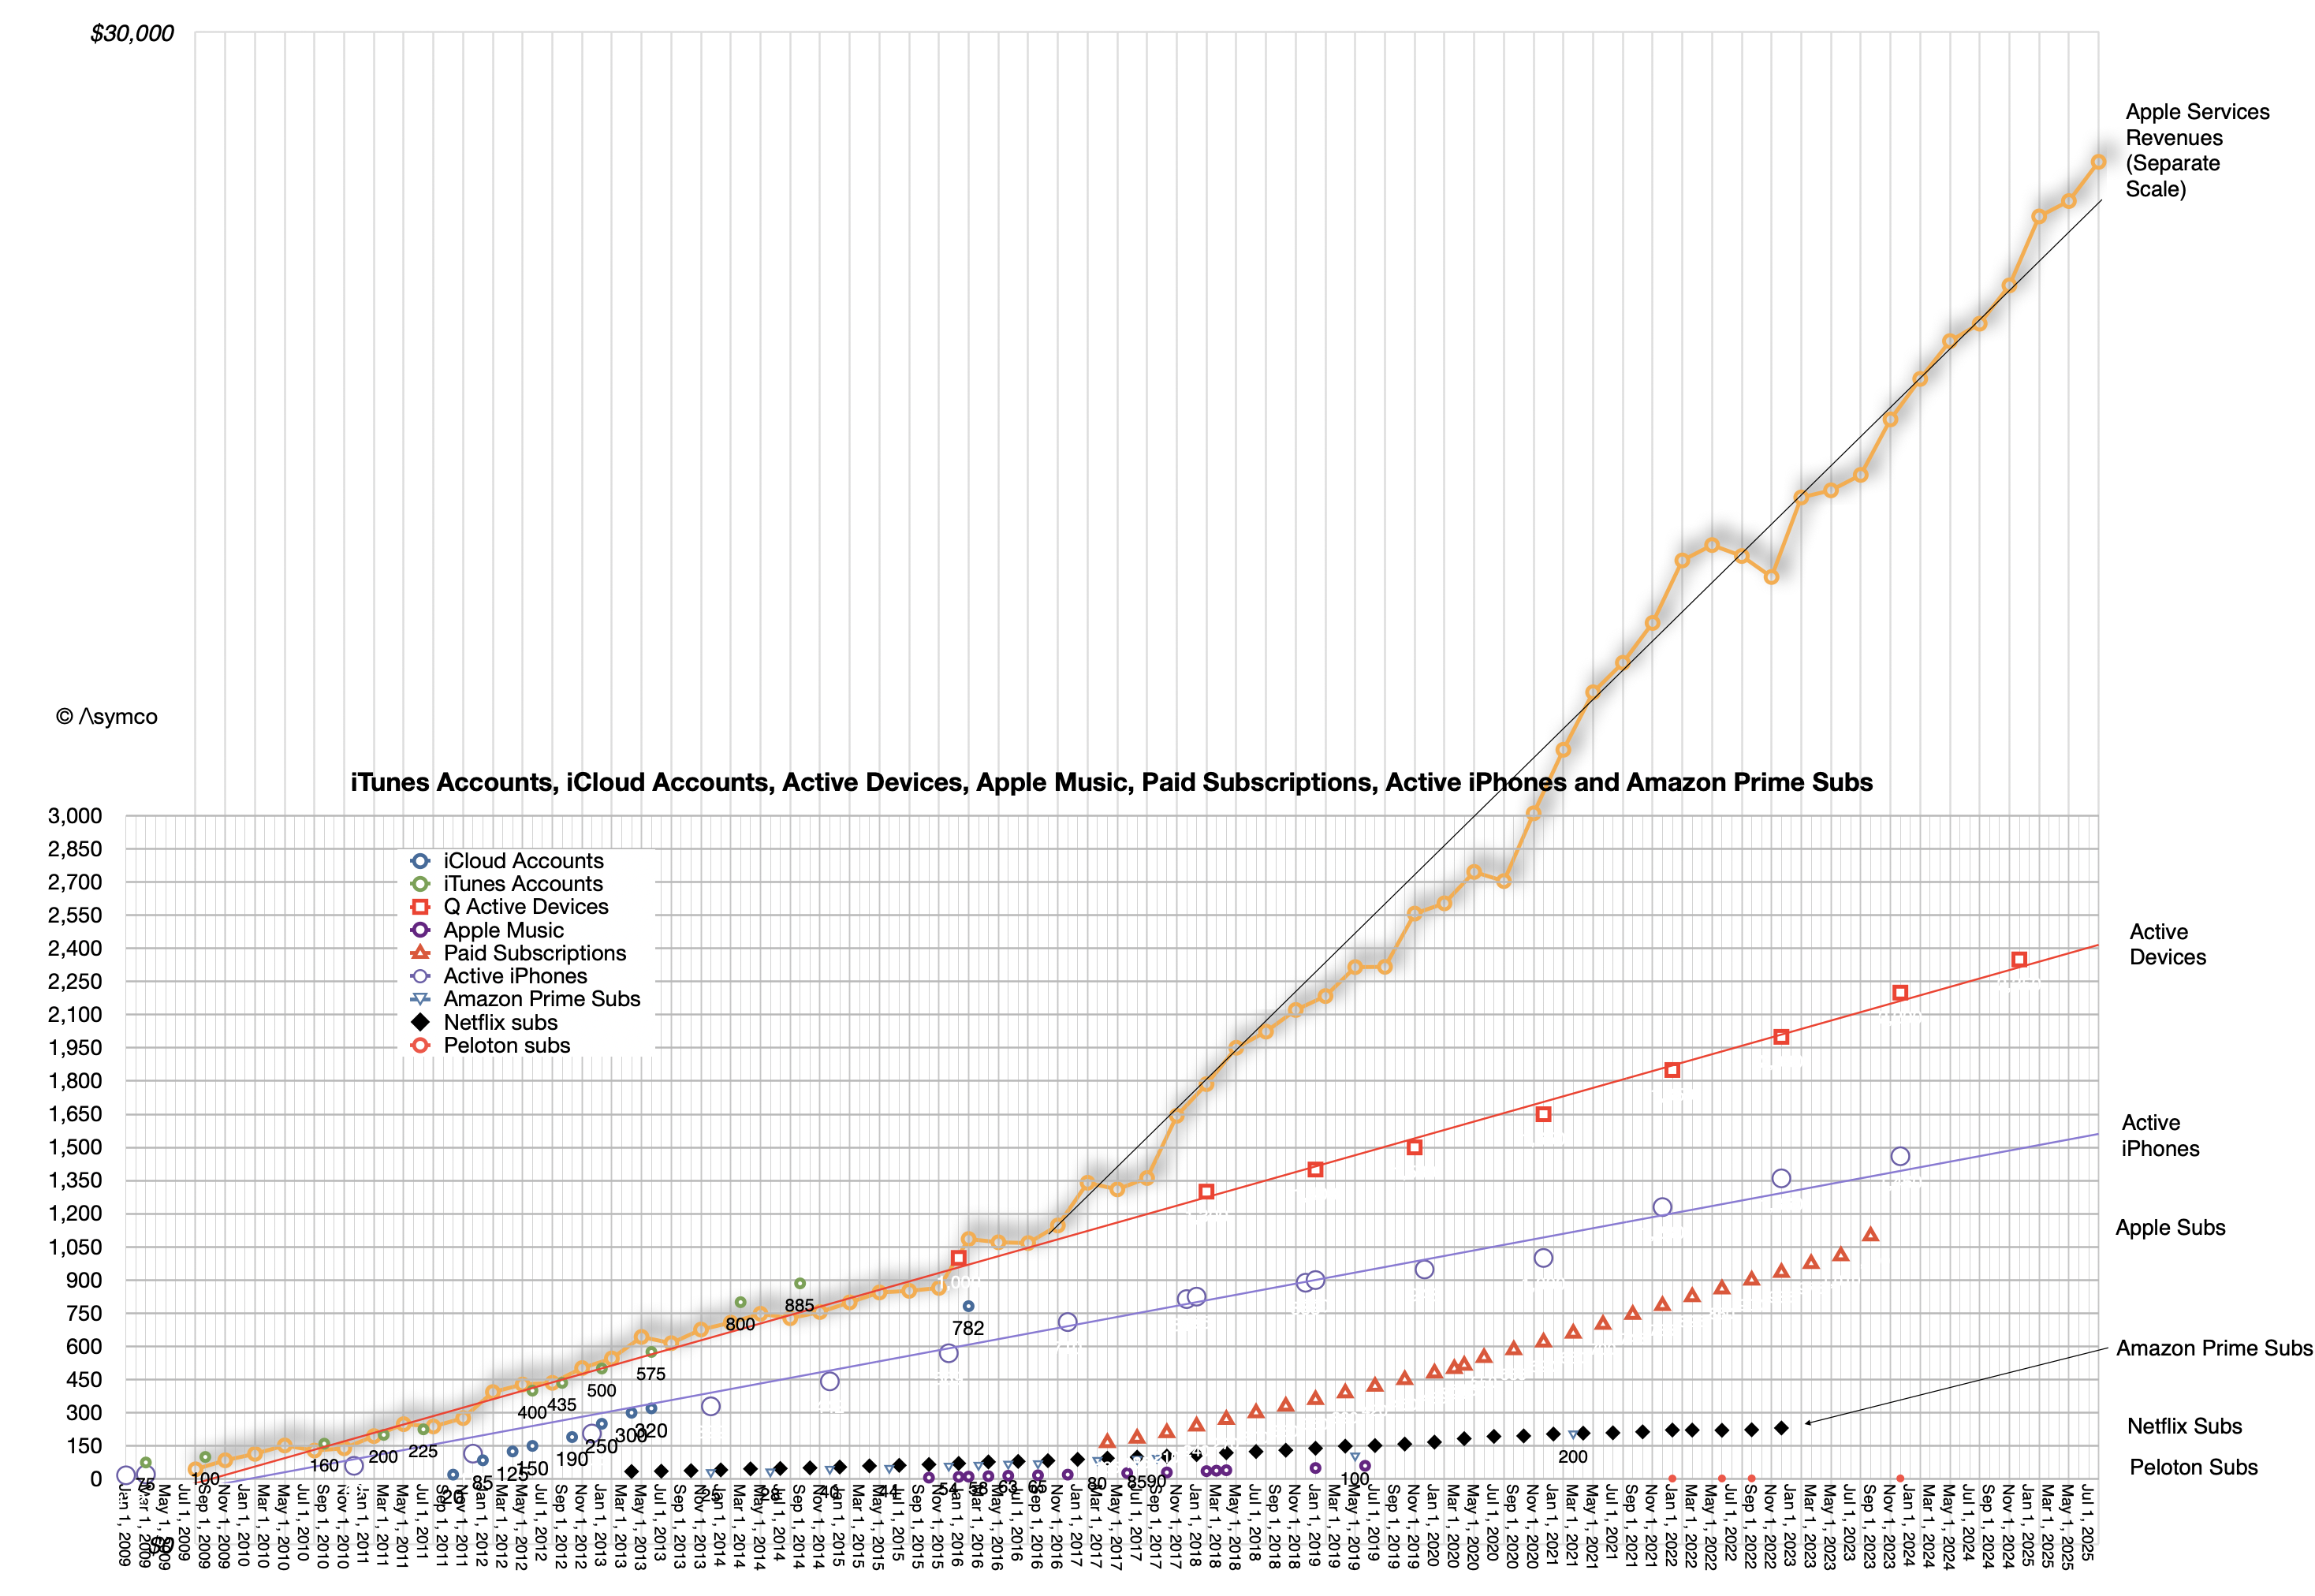
The line to focus on is the red with square points. "Q Active Devices" is the history of what Apple calls "Quarterly Active" devices or those which ping an Apple server at least once a quarter. The data appears to be linear, or the growth is about 150 million per year at least since 2016. Historic data on the iPhone is also shown with a blue line. That is also consistent with about 100 million new iPhones in use every year. This is a bit higher than the 78 million bottom-up analysis of new users. I'd argue that Watch numbers may be a bit too high and perhaps iPad as well.
The mix is a matter of debate but overall this consistency allows for some confident forecasting.
The iPhone will reach 1.7 billion active users by this time next year.
There will be three billion active devices by early 2029.
Services, which is shown in the second graph is clearly correlated to active device growth.
The consistency in active device growth is far more important than device sales in a particular period and determines the value of the company.
Knowing this, here are some additional observations:
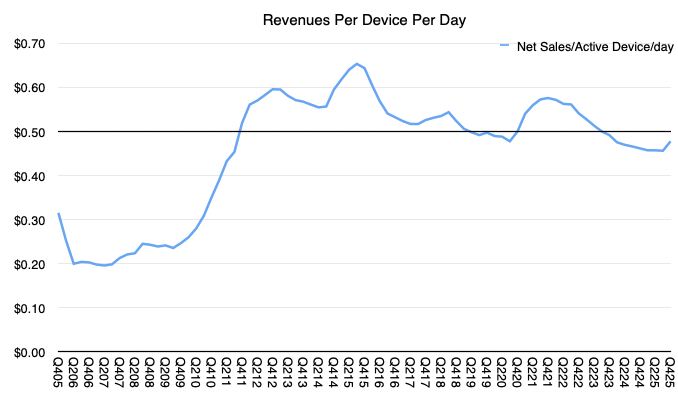
Yearly revenues per active device are $129, services revenues per active device are $45 for a total revenue per active device at $174/device/yr. That is equivalent to 48c/device/day. Data shows that daily revenues have been an average of 53c/device/day for 59 quarters. My rule of thumb is 50c/day per active device is a good estimate for Apple's revenues, and estimate that I have been holding for over 14 years.
There are additional implications. With a base of 1.65 billion iPhones, and knowledge of replacement vs. new-to-product/switcher growth what is their average lifespan and thus replacement rate and therefore what is the average selling price?
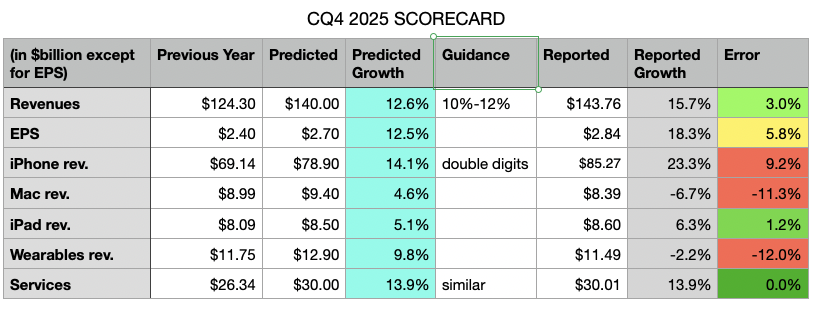
My predicted growth is in the light blue column, the reported growth is in the grey column and my errors are in the last column. Also included is the guidance from the previous quarter's conference call.
The table shows my errors were primarily in underestimating iPhone, while over-estimating Mac and Wearables. The errors mostly cancelled each other out on the top line (off by 3 percentage points) but, due to an underestimation of the gross margin led to a bottom line error of 5.8 percentage points.
The Mac overestimation was based on not paying enough attention to the comparable from the year earlier. I was warned: "On Mac, keep in mind, we expect to face a very difficult compare against the M4 MacBook Pro, Mac Mini and iMac launches in the year ago quarter". Wearables are similarly underperforming due to lack of new product launches.
But the iPhone underestimation is simply because the new products are a massive hit. Nobody predicted this level of performance. Indeed Apple was caught by surprise and has been unable to meet demand. They are still going to be below supply/demand balance going well into the first quarter of 2026.
Finally, an error on the margin came from Apple's continuing over-performance on supply chain management.
Apple is providing the following guidance [my emphasis]:
We expect our March total company revenue to grow by 13% to 16% year over year, which comprehends our best estimates of constrained iPhone supply during the quarter.
We expect services revenue to grow at a year-over-year rate similar to what we reported in December. We expect gross margin to be between 48-49%. We expect operating expenses to be between $18.4 billion and $18.7 billion, which is at a similar level to what we reported in December and driven by higher R&D on a year-over-year basis. We expect OI&E to be around $100 million, excluding any potential impact from the mark-to-market of minority investments, and our tax rate to be around 17.5%.
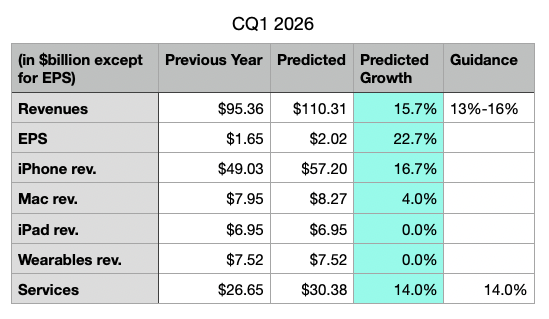
Based on provided guidance, I'm making the following predictions for the next quarter:
It's vey important to note that Apple is guiding gross margin to be between 48-49%, a record high and something that we will discuss in the next post. This results in a 22% to 23% EPS growth rate!
Note also that Apple guided revenue growth between 10% and 12% and delivered 12.6%. They guided grass margins between 47% and 48% and delivered 48.2%. It's highly probable that their top-of-the-range guidance will also be exceeded slightly and that my current estimates are therefore modest. [NB: the guidance is being put forward at the end of the first month of the quarter therefore the company already has booked one third of the quarter and has very clear visibility into the next third.]
Counterpoint Research published its latest market estimates for best selling phones in 2025. The list is:
iPhone 16
iPhone 16 Pro Max
iPhone 16 Pro
iPhone 17 Pro Max
Galaxy A16 5G
Galaxy A06 4G
iPhone 17
iPhone 15
Galaxy S25 Ultra
iPhone 16e
What’s notable, however, is that the base model iPhone 17 took 7th place. This contrasts with the iPhone 16 managing only 10th place in 2024, and very much reinforces the widespread view that the base 17 is the model to buy unless you specifically need one of the pro features. It’s the reason we crowned it as “the best overall iPhone in years.”
NB: Not as exciting as the 20% market share for the full year, the saturation of the list by Apple products is indicative of a dominance in revenues not just volumes of sale. The Apple products have a significantly higher average selling price.
The App Store alone saw over 850 million average weekly users globally. Developers earned over $550 billion on Apple platform since 2008.
Apple Pay eliminated well over $1 billion in fraud, while generating more than $100 billion in incremental merchant sales globally. Purchases made through Apple Pay significantly outpaced the overall growth in consumer spending levels during the peak holiday shopping period in November and December. Apple Pay is now available in 89 markets. with more than 11,000 banks and network partners — including more than 20 local payment networks. Tap to Pay on iPhone expanded to 34 additional markets — now covering most of Europe — and is live in a total of 50 markets, with more than 15 million merchants of all sizes across the world accepting contactless payments using just an iPhone
Apple TV eclipsed all prior viewership records in December 2025, with 36% increase in monthly engagement (total hours viewed). To date, Apple TV has amassed 672 award wins and 3,085 nominations (excluding 2026).
Apple Music reached all-time highs in both listenership and new subscribers.
Apple Fitness+ expanding to 28 additional countries and regions offering more than 8,000 workouts and meditations in 4K Ultra HD.
In 2025, Shazam generated over 1 billion recognitions per month.
Expanded Share Item Location feature in Find My to 27 additional airlines, bringing the total to 36. (This feature allows private and secure sharing of an AirTag’s or Find My network accessory’s location with an airline’s customer service, reducing “truly lost” or unrecoverable luggage by 90 percent)
Apple Podcasts expanded transcripts to over 125 million episodes in 13 languages.
Apple News solidified its position as the No. 1 news app in the U.S., Canada, and Australia, and No. 2 in the UK. News features over 3,000 publications and more than 600 titles with Apple News+. News+ expanded its offerings with the debut of Apple News+ Food, which includes 100,000 recipes from 60 publications in the U.S., the UK, Australia, and English-speaking Canada. Apple News now includes over 150 local newspapers and news feeds across 50 U.S. states, seven Canadian markets, and London.
Apple One Individual and Family plans are available in more than 100 markets world-wide, with Apple One Premier, which also includes Apple Fitness+, available in more than 20 markets.
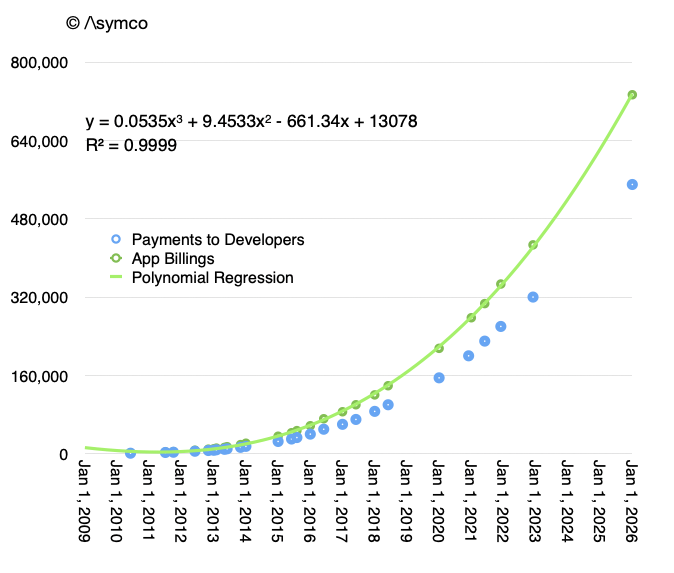
Historic data is not available on most of these singular data points however they are available at least for the payments to developers. In fact, there are 26 such data points. They are shown in the graph below as the blue dots.
The green dots and curve fitting them is my estimation of the total billings for App Store. That is, the total spent by customers on the App Store. To date, that amount is over three quarters of a trillion dollars. ($733 billion to be precise.)
Note that the data can be represented by a third order polynomial. Furthermore, since the r-squared is 0.9999, the function is very predictive. As an exercise, using this analysis it can be determined that $1 trillion will be achieved by the first quarter of 2028.
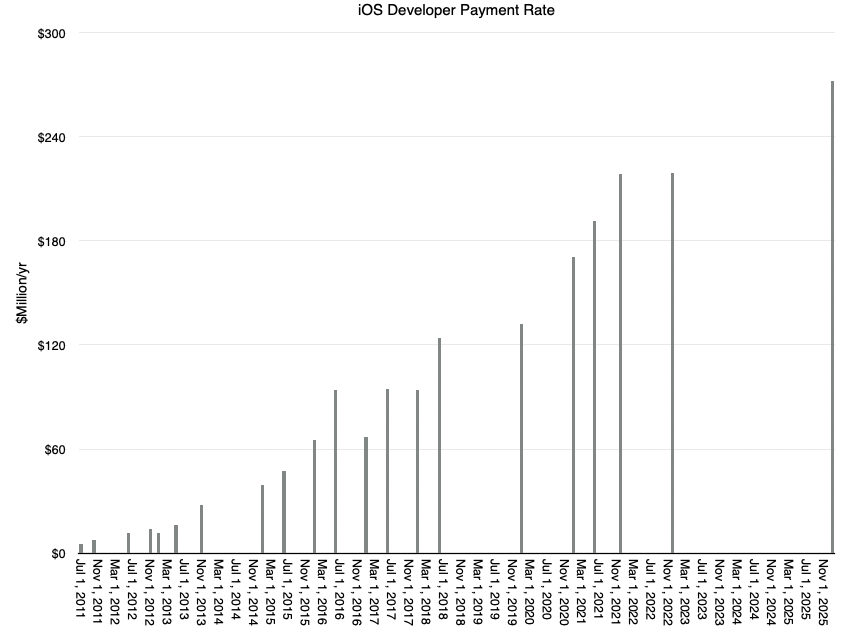
The beauty of a polynomial growth rate is that the rate of payment, that is the amount paid on a monthly basis, is itself accelerating. The following graph shows the payment rate in $million/day for developers.
This growth suggests that quite soon we will be nearing a rate of $300 million/day or $100 billion per year developer payment rate.
This is, of course, only the tip of the iceberg. As Eddie Cue points out in the press release,
In 2024, the App Store ecosystem facilitated $1.3 trillion in developer billings and sales, with more than 90 percent of that commerce going directly to developers, with zero commission paid to Apple.
To understand the totality of transactions on Apple platforms we need to explore the entirety of the App economy. There is for another post. Stay tuned.
Apple is set to report its strongest iPhone sales growth in four years on Thursday - and likely the company's best quarterly revenue to date…
Strong iPhone sales expected to power record Christmas quarter for Apple appeared first on MacDailyNews.
In China and developing markets, Apple drew customers with the refreshed camera design and higher storage capacity of the latest Pro devices.
The company led the global smartphone market last year with a 20% share, according to research firm Counterpoint, up from 18% in 2024.
Overall, Apple is expected to report that iPhone sales rose 13.8% in its October-December fiscal first quarter, according to analysts polled by LSEG. That would mark the strongest growth in more than four years.
Total revenue likely increased 11.4% to a record $138.43 billion, aided by a 14.1% jump in Apple’s the services business.
In Greater China, sales likely jumped about 15%, according to Visible Alpha data.
Some investors believe Apple can make money from AI without the massive infrastructure investments pledged by its Big Tech rivals.
“Apple can probably generate a positive return on very little AI investment, thanks to its distribution,” said Gerrit Smit, manager of the Stonehage Fleming Global Best Ideas Equity fund, which holds Apple stock.
Consensus estimates Apple to post about $138.4 billion in revenue and both GAAP and non-GAAP earnings per share (EPS) of around $2.67 for the December quarter. The numbers highlight at least an 11% year-over-year growth in EPS and revenue, but analysts are now tightening their margin forecasts despite favourable iPhone sales and AI roadmap.
In a note, Morgan Stanley analyst Erik Woodring reiterated an Overweight rating and an unchanged price target of $315, but cautioned investors that Apple stock could “trade sideways to modestly lower after earnings.”
The firm expects Apple to beat expectations, driven by stronger, more persistent iPhone demand. Woodring expects December-quarter revenue of about $80 billion, around 4% above consensus, and March-quarter revenue of $55.4 billion, about 8% above consensus, citing supply-chain checks and shipment data.
He said iPhone 17’s “strength remains underappreciated by the Street.”
Morgan Stanley sees cost assumptions as overly optimistic. The firm forecasts March-quarter operating expenses about 7% above consensus and a gross margin forecast 30 basis points below consensus, driven by rising memory costs.
As a result, Woodring sees limited scope for positive EPS revisions for Apple, even with a revenue beat.
Morgan Stanley also flagged potential downside risk to June quarter earnings, estimating EPS of $1.62 versus the consensus of $1.71, citing intensifying memory-related cost pressures. The firm also notes that Apple has historically underperformed the S&P 500 more in Q1 than in any other period.
Looking ahead to 2026
All things considered, Morgan Stanley believes Apple is positioned to outperform in 2026 as a wave of new products and AI-driven catalysts is set to shape the company’s growth trajectory. The firm particularly highlighted the relaunch of Siri in February and Apple Intelligence in June at Apple’s Worldwide Developers’ Conference (WWDC). Some notable introductions expected include its most “innovative iPhone in 10+ years (Foldable)“, plus the first smartphone powered by 2-nanometer chips, part of the iPhone 18 family.
The firm sees greater benefits from share gains and higher average selling prices, with Morgan Stanley underscoring an EPS of $9.77 for FY2027, roughly 7% above Wall Street consensus.
Earnings will be above consensus. All eyes will be on how margin guidance due to pressure from memory pricing. Every year it's another thing that is cause for drama. It never matters.
As we approach the earnings release for the first fiscal/fourth calendar quarter for Apple, it's time to look back three months at what the company delivered and guided in the previous quarter.
The summary for results for fourth (fiscal) quarter of FY2025:
Revenue up 8% year-over-year, a new September quarter record.
EPS was up 13% year-over-year.
Product revenue was up 5% year-over-year driven by growth across iPhone and Mac.
iPhone revenue was up 6% year-over-year, and set a September quarter record despite supply constraints faced on several iPhone 16 and iPhone 17 models.
The iPhone active installed base grew to a new all-time high and had a quarterly record for upgraders. Also, Apple reached a new all-time high for installed base of active devices.
Mac revenue was up 13% year-over-year, driven by MacBook Air. Apple grew in every geographic segment, with strong double-digit growth in emerging markets. Mac installed base reached another all-time high, with nearly half of customers who purchased a Mac being new-to the product.
iPad was down 3% revenue and but over half of the customers who purchased iPad this quarter were new-to the product. iPad also had a September quarter record for upgraders.
Wearables, Home & Accessories Revenue for the category was flat y/y. Apple saw a September quarter record for upgraders to Apple Watch, and over half of Apple Watch buyers were new-to the product.Both the Apple Watch and AirPods installed bases reached new all-time highs.
Services again set a new all-time revenue record up 15% year-over-year. Apple saw double-digit growth in both developed and emerging markets. Apple saw a sequential acceleration across the majority of the categories and set new all-time records across Advertising, App Store, Cloud Services, Music, Payment Services, and Video. Apple saw a double digit growth in Apple Pay.
Guidance was provided as follows:
We expect iPhone revenue to grow double digits year-over-year, which would be our best iPhone quarter ever. On Mac, keep in mind, we expect to face a very difficult compare against the M4 MacBook Pro, Mac Mini and iMac launches in the year ago quarter. We expect Services revenue to grow at a year-over-year rate similar to what we reported in the fiscal year 2025.
We expect gross margin to be between 47% and 48%, which includes an estimated impact of $1.4 billion of tariff-related costs. And so for the December quarter, we expect operating expenses to be between $18.1 billion and $18.5 billion. We expect OI&E to be around $150 million, excluding any potential impact from the mark to market of minority investments and our tax rate to be around 17%.
Based on these forecasts my estimates for the top, bottom and middle lines are as follows:
Revenues: $140 Billion (+12%)
EPS: $2.70 (+12.5%)
iPhone: $78.9 Billion (+12%)
Mac: $9.4 Billion (+4%)
iPad: $8.5 Billion (+5%)
Wearables: $12.9 Billion (+10%)
Services: $30 Billion (+14%)
If there is an error in the above I would guess it's in iPhone being too low and the iPad/Mac and Wearables being too high. Nevertheless, I think this will be Apple's biggest quarter ever with significant growth acceleration on the top and bottom lines. [Notable will also be a rapid acceleration in R&D spending (+25%) as suggested by guidance.]
As we head into this blockbuster quarter, Apple shares are trading at a P/E ratio of 32 to 33, a significant drop from above 35 during previous few quarters. During the last three months, the share price has declined about 15% as Mr. Market looked at the money mountain above and decided he wanted none of it.
In the latest, (Fiscal Q3, Calendar Q2 2025) conference call, Tim Cook made a welcome announcement: "We also recently marked a significant milestone. We shipped the 3 billionth iPhone since its launch in 2007."
This was welcome because the company has not been providing iPhone unit shipment numbers since Q4 2018. What it has meant is that the number of iPhones sold and their average selling price had to be estimated. Active iPhones were occasionally provided but quite rarely.
With this update, the veil has been party lifted. I, as well as you I'm sure, rushed to assess how well we have been estimating the iPhone economy over the last seven years. Prior to Tim's data dump, my own estimate for total iPhone shipments was 3.104 billion, including the last quarter. [Keep in mind that the 3 billionth iPhone may have shipped in the beginning of the quarter which amounts to more than 50 million units prior to announcement so my error of 104 million is minus perhaps 50 million.]
In the worst case, my error amounts to about 3.4% over the entire lifespan and perhaps 5% over the estimate period. That is perhaps not criminal since, after all, what's 100 million iPhones between friends?
I adjusted the estimated average selling price to reflect this error and shaved essentially one quarter's worth of shipments from the data set. In other words, my estimate would have been that 3 billion was reached in March rather than June. Mea culpa.
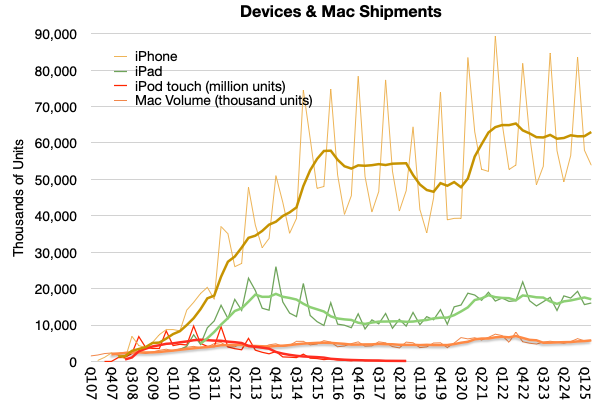
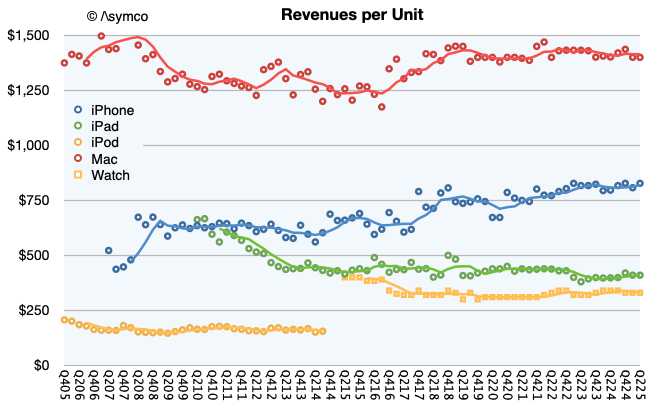
The new view into the entire iPhone shipment history is shown below. Also below is the impact of adjustment in the revenue per unit (i.e. average selling price.)
Note that I used trend lines to show the four-period (12 months) running average to remove the seasonality. Perhaps there is something to be read in the pattern. I would say that there are some notable surges as during the initial uptake, during the first "supercycle" in 2014, the surge during Covid and perhaps the "China recession" of 2018.
Clearly we are not at the highest sales levels today, as the Covid surge will take some time to grow into but at the same time the volumes are not decreasing. You can see the contrast to the iPod touch when an alternative was available, namely the iPad. The demise of the iPhone has been greatly exaggerated.
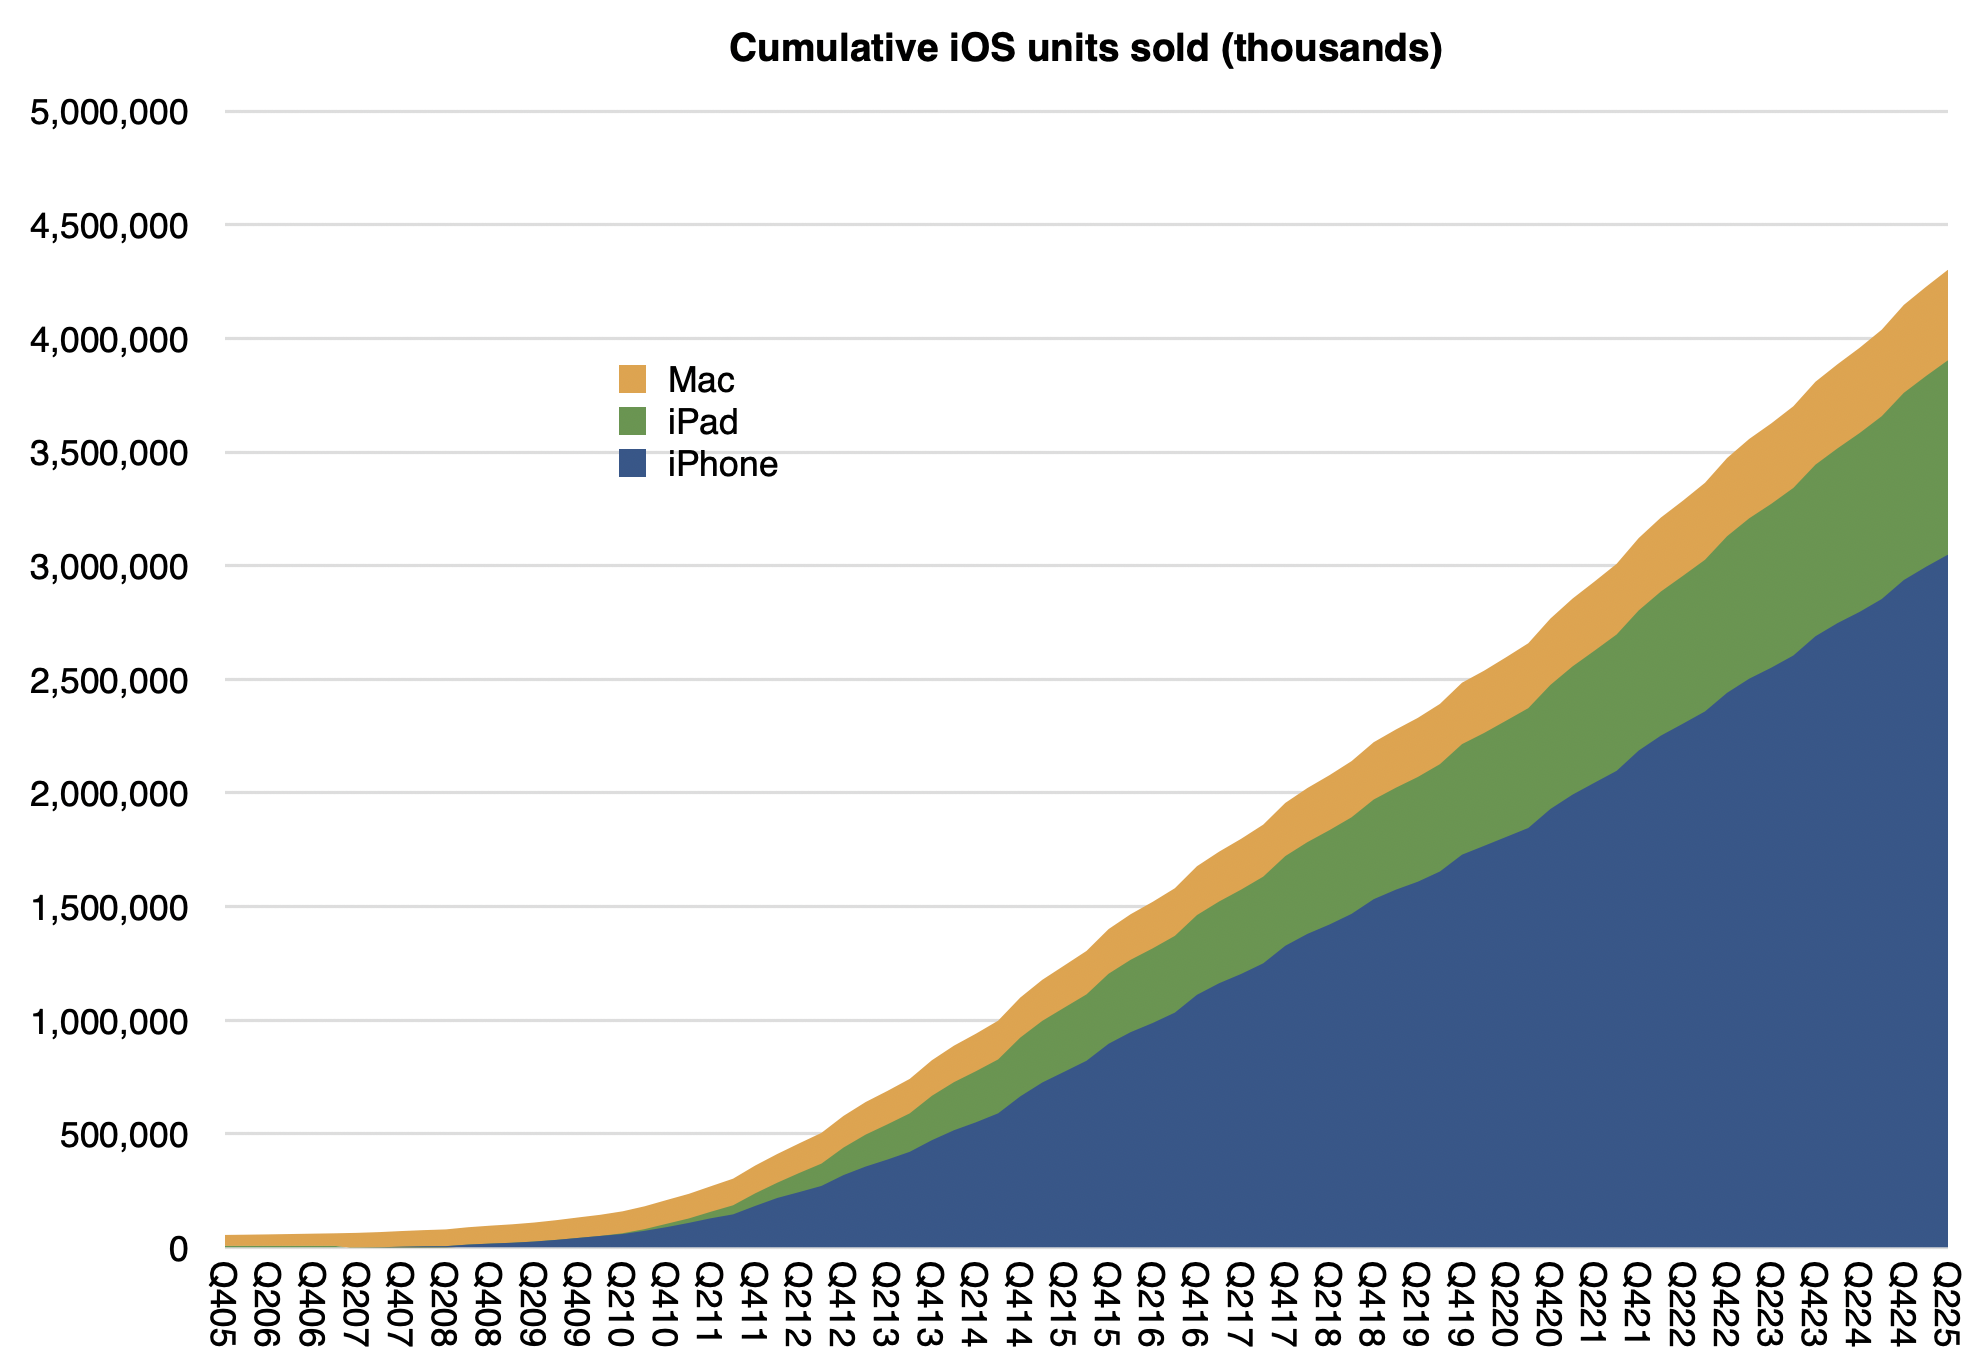
Note also that I also included the iPad, Mac and the iPod touch for comparison. You can try your hand at reading the patterns there. For the record, my cumulative Mac estimate (since Q4 2005) is 398 million[1] and the cumulative iPad is 855 million. Here are the iPhone, iPad and Mac cumulatively with a current total of about 4.3 billion:
Not shown are iPods (touch alone is about 114 million), Watches (probably at least 250 million) and Vision Pro (single digit millions) or wearables and home. If we did include those, it's a safe bet that Apple has shipped over 5 billion devices.
Interesting, but not as interesting as how many are active (in use at least once a month.) For that estimate we have another set of data:
The linear extrapolations for active devices, active iPhone and, on a separate scale, actual Apple Services revenues can be seen. Also subscriptions, as long as they were available, plus other data sets for comparison such as Amazon Prime subscriptions, Netfilx and old Apple Music and iCloud account data.
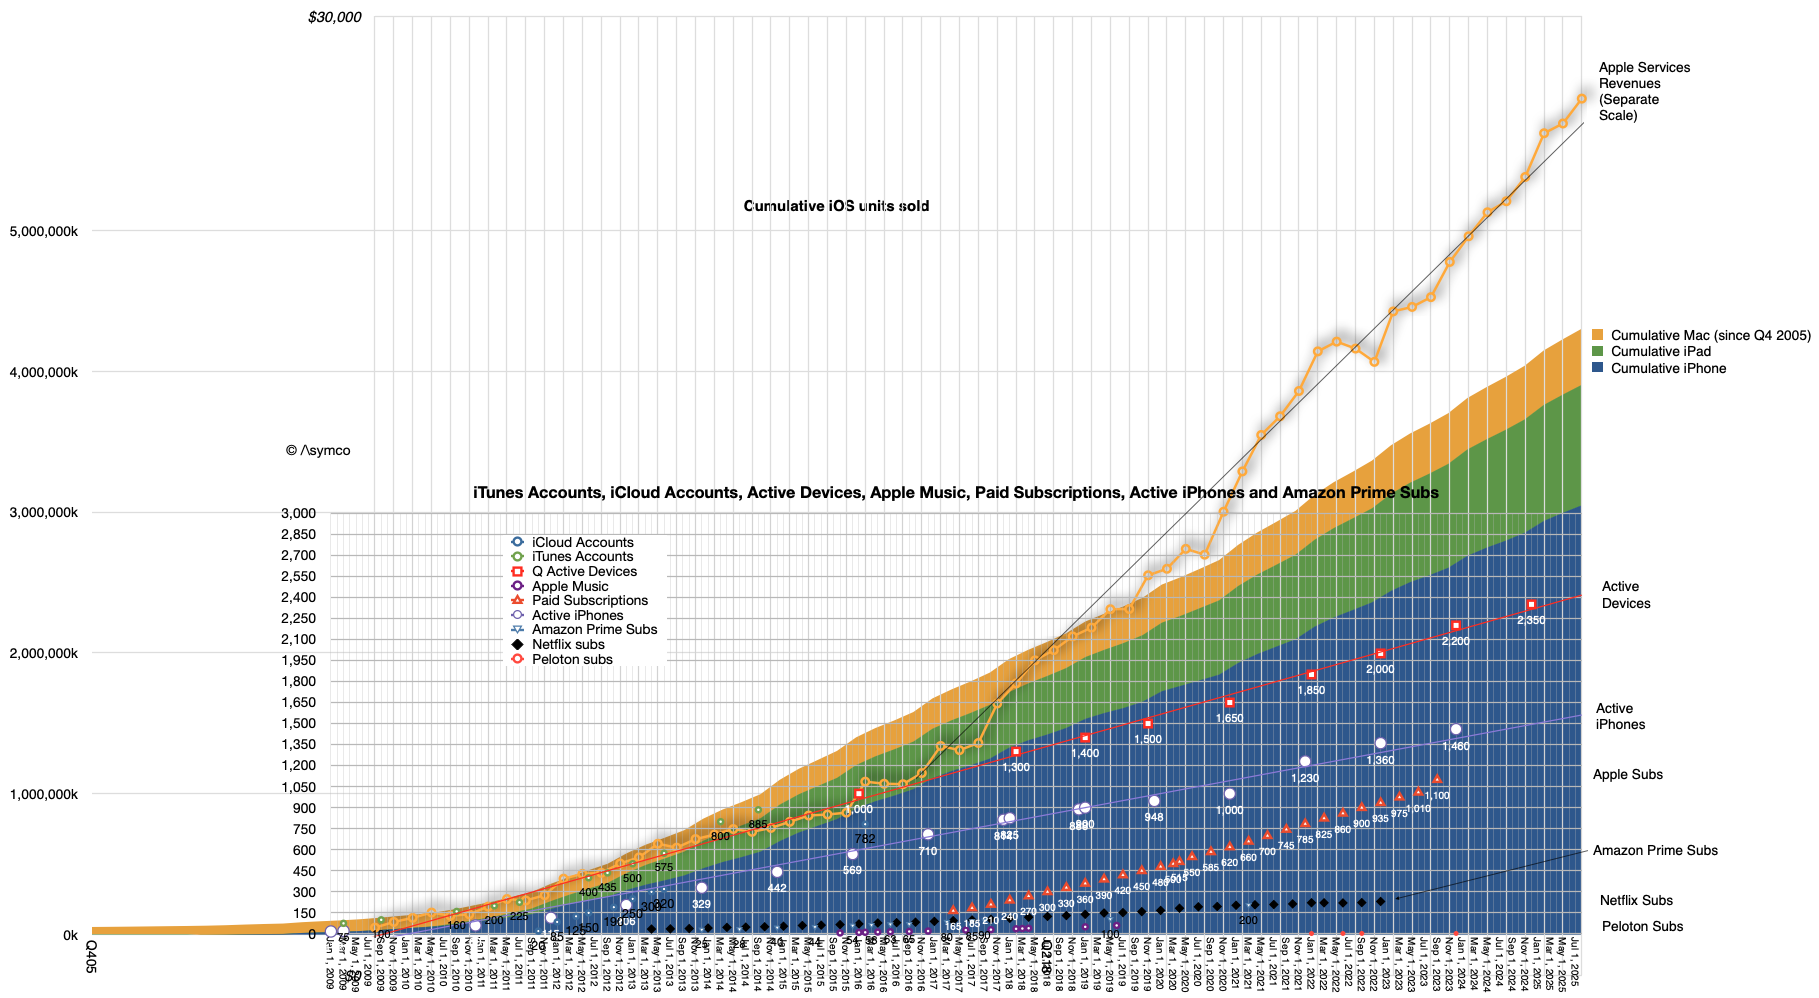
At the risk of overloading an already busy graph, it might be interesting to show cumulative devices vs. active devices:
The top of the area graph seems to be not too different than the top of the red dotted device line. What might be instructive is to calculate the ratio between these two: the active devices and the cumulative devices during the period from 2016 (when 1 billion active were reported) and the beginning of this year when the last figure was reported (2.35 billion active devices on Jan. 30 2025).
Again, excluding wearables, iPod touch, Apple TV and Apple Vision Pro we have these ratios:
Date
Ratio of Active devices to Cumulative iPhone, iPad and Mac sold
Q417
0.66
Q418
0.63
Q419
0.60
Q420
0.60
Q421
0.59
Q422
0.58
Q423
0.58
Q424
0.57
What this suggests therefore is yet another way to forecast the value of Apple as an enterprise. We already know that the prediction of active devices, revenue per device and margin is sufficient to forecast the company's earnings. These all seem to be quite linear and thus predictable. Now we can add the relationship to devices sold as yet another way to calibrate or test assumptions.
After diligently doing so, simply multiplying the results by a random number called the P/E ratio (aka "sentiment") allows you to predict the share price at any point in the future.
Have fun.
It would be interesting to consider that if, as it's been often claimed by Apple, half of Mac users and half of iPad users are new to the products, then there would be 200 million new Mac users and perhaps 400 million iPad users.
According to JP Morgan analyst Samik Chatterjee, citing Sensor Tower, Apple's App Store revenue for May 2025, increased by 4.9% month-over-month (which compares to an average sequential increase of 2.3%) and an acceleration of year-over-year revenue to 13.0% in May versus up 11.8% in April. On a year-over-year basis, the App Store downloads increased by 3.1% in May (versus +5.8% in April) according to Chatterjee.
This analysis is based on app download sampling and may be indicative of the activities of consumers on the App Store. Services revenue in the first calendar quarter was $26.6 billion, up 12% year-over-year and at an all-time revenue record. Services gross margin was 75.7%, up 70 basis points sequentially, also an all-time record.
The world however seems to be having a problem with Apple Services. After years of skepticism of its relevance, now that it has achieved a run level above $100 billion/yr., it's being criticized for being harmful to competition.
The comments that it's unfair to developers or that it deters innovation are uninformed to say the least. What is missing from that analysis is that the App Store is only a small fraction of the entire ecosystem around Apple's platforms and that the economic activity the platforms enable is immense.
Let's learn.
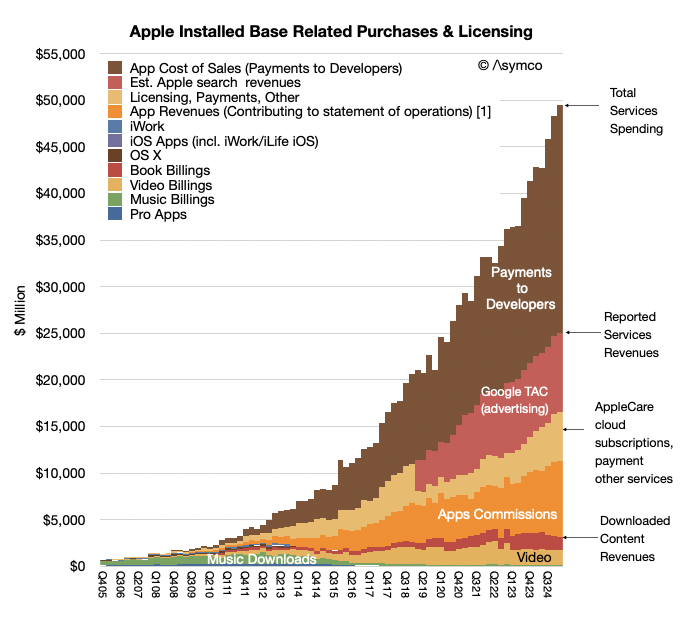
Over the last year Apple reported a bit more than $102 billion in revenues for Services at a very high margin. The reason it was such a high margin was partly due to the fact the Services does book all payments from customers through the App store as revenues. In other words it does not include payments to developers as either revenue or costs. Those payments pass through but they are certainly part of the economic activity on the store. It would be indeed unusual for a physical store not to report what it pays for what it sells as part of revenues. But this is the basis Apple chose (or was obligated to choose) as the way to report App Store revenues.
Thus considering the payments to developers, the economic activity directly related to the App Store amounts to $120 billion/yr which includes commissions of about $30 billion/yr (last 12 months) and payments to developers of about $90 billion/yr (implying about 25% blended average commission rate.)
So including payments to developers the Services business grosses $186 billion/yr. of which 102 billion is reported as revenue, with the 75% gross margin and $90 billion is paid to developers "off the books".
But that $102 billion in revenues is only about 30% App Store commissions. The rest includes many types of income: It includes:
Advertising which consists of Apple's own advertising services and third-party licensing arrangements notably the distribution fees for Google search (accounting for most of Googles "TAC" or traffic acquisition costs.
AppleCare, Apple's own extended warranty service.
Cloud Services which provide content synchronization.
Digital Content which not only includes the App Store but also stores for books, music, video, games and podcasts. Apple also offers digital content through subscription-based services, frequently bundled, including Apple Arcade, essentially a game subscription service; Apple Fitness, a personalized fitness service; Apple Music, which offers music streaming and on-demand radio stations; Apple News, a subscription news and magazine service; and Apple TV, which offers exclusive original content produced by Apple and live sports access licensed sometimes exclusively by Apple.
Payment Services which offers Apple Card, a co-branded credit card, and Apple Pay, a cashless payment service.
The quarterly view is summarized in the graph above. So a fixation on the commission is only a view into 16% of Services as an economic foundation (the orange area in the graph above).
But that's still only a sliver of the whole picture.
A report written by Jessica Burley, Analysis Group and Professor Andrey Fradkin, Boston University Questrom School of Business has estimated that the global App Store ecosystem facilitated $1.3 trillion in developer billings and sales in 2024. As the report writers say: "For more than 90% of the billings and sales facilitated by the App Store ecosystem, developers did not pay any commission to Apple."
How is this not visible? The reason is that this economic activity is distributed over the millions of purchases Apple users make through its iOS Apps every day. This includes traditional App Store "Billings" including paid downloads and in-app purchases, including subscriptions, that use Apple’s in-app purchase system and “Sales” which includes money spent by customers purchasing goods and services in general using any iOS and iPad OS apps. Apps developed by Apple such as Apple Music, Safari or browser apps such as Chrome are excluded from this analysis.
The economic activity unleashed by the App Store now reaches well over $1.3 trillion/yr. As the authors further explain,
While the present analysis captures the major app monetization strategies available to developers, the full economic impact of the App Store ecosystem extends beyond the estimates provided in this report, as the current methodology does not capture all of the ways in which the App Store ecosystem facilitates sales, or all of the benefits created by apps. For example, the App Store supports “companion apps” that raise the value of a company’s goods and services, including smart home apps and health apps. In addition, many apps now use different monetization strategies. As such, this analysis does not account for all the ways in which the App Store ecosystem creates value.
Furthermore the report breaks down the categories as Digital Goods and Services, Physical Goods and Services, M-Commerce (General Retail, Travel, Food Delivery and Pickup, Grocery, Ride Hailing), Digital Payment and In-App Advertising.
In addition the report estimates these categories from 2019 as well as 2024 providing a growth perspective: Over the past five years, the App Store ecosystem has more than doubled in size, increasing from $514 billion in 2019 to nearly $1.3 trillion in 2024.
It also identifies regional dynamics between the US, China, Europe (with select countries) and Rest of World (with select Asian countries).
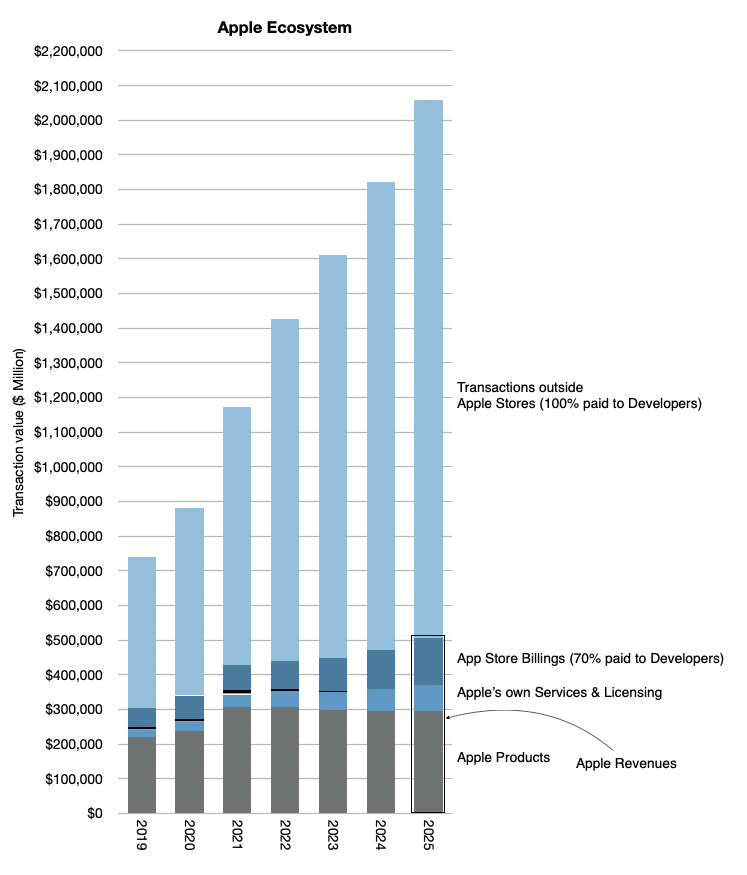
I've been keeping my own analysis of what I called the Apple Economy and it includes these transactions outside the App Store and Apple's own products and services. If I were to subtract Apple's own revenues from the total, for 2024 I was getting about 1.4 trillion (out of a total of over 1.8 trillion).
My point was always to estimate the economic impact of Apple beyond its own sales. This gave us perspective to assume that in 2025 the total would reach over $2 trillion. The graph below gives the perspective which also implies a doubling since 2020 to 2024.
The new report from Burley and Fradkin is a detailed, bottom-up analysis which quantifies what was perceived as the economic value of Apple being far more than what the financial data records.
Bill Gates once stated in reference to Zuckerberg's assertion that Meta was developing a "platform" that it's not a platform unless the economic value of everybody that uses it exceeds the value of the company that creates it.
Apple captures about $30 billion as sales but delivers over $1.3 trillion in sales, a multiple of 43! I would call that generous. In addition it doubles the market in 4 to 5 years. I'd call that market expanding not constraining. Finally, it's a market that Apple created out of nothing. I'd call that market creation not destruction.
If judged on the question of creation and satisfaction of the customer, i.e. the ultimate purpose of the firm, the App Store and Services in general has satisfied 1.4 billion people. That they are spending over $1.3 trillion and doubling in 4 years is nothing short of astonishing.
We'll discuss this topic and other topics related to Apple at ACTIVE: The Apple Investor Conference, which takes place on next Tuesday, June 10th, the day after the WWDC25 keynote.
Apple’s relationship with China has always been a point of worry for investors. Nine years ago Carl Icahn sold his entire stake in Apple due to China fears. In April 2016 Reuters reported that "Icahn had been a huge cheerleader of Apple, acquiring a stake in the company almost three years ago, repeatedly calling the investment a `no brainer.'" In an open letter to Apple Chief Executive Officer Tim Cook in May 2015, Icahn had argued that shares of the iPhone maker were worth $240 ($60 split adjusted), about 90 percent more than they had been trading. At $240 a share, Apple's market cap would be $1.4 trillion, Icahn asserted. But Icahn, who owned 45.8 million Apple shares at the end of 2015, said China's economic slowdown and worries about how China could become more prohibitive in doing business triggered his decision to exit his position entirely.
Icahn’s stake when he acquired the shares was worth nearly $3 billion and he sold it for about $5 billion. A $2 billion profit. But China worries kept him from holding until today when his shares would have been worth $36.6 billion, thus foregoing $31.6 billion in profit.
Leaving $31 billion on the table (not including dividends) seems a high price to pay for a misidentified anxiety on China.
The public reasoning was: "But you worry a little bit, maybe more than a little, about China's attitude."The Chinese government could `come in and make it very difficult for Apple to sell there … [They] can do pretty much what [they] want there,' Icahn said. Earlier [that] month, China shut down Apple’s iTunes movies and iBooks stores within the country, following Beijing's introduction of regulations in March 2016 imposing strict curbs on online publishing, particularly for foreign firms."
That was 2016. Today the concerns appear to be:
Slowing sales due to rising competition from Chinese brands
Slowing sales due to Chinese economic slowdown
Tariffs and other barriers to trade affecting pricing in the US
Geopolitical threats to supply chain, including processor manufacturing in Taiwan
Should today's investor worry about China more or less than Icahn did in 2016?
In the case of competition in China, we have to understand that China does not have a free market or "laissez-faire" economy. The clue would be the middle “C” in CCP which, importantly, has a monopoly on political power in China. In spite of an ideology hostile to private property and market economics, the fact that Apple not only is allowed to operate in China but also is the market leader in urban (read: wealthy) areas and indirectly employs millions of workers and empowers millions more developers should be seen as something of a miracle. It continues to operate only insofar as the CCP allows it to continue and the CCP is nothing if not calculating. Clearly, China has seen Apple’s presence in the market (both as producer and seller) as beneficial. One could argue about who benefited most but overall deals happen (and persist) because both parties benefit.
The competition has been improving lately, but when has it not?
Fundamentally, from the consumer point of view, the competition question is moot since the alternatives are not iOS. The iOS ecosystem is incredible from a value-generation point of view, and Android has been clearly contained as a threat. (A nostalgic footnote. Recent talk of Alphabet being forced to sell Android is a wonderful reminder of the question I asked many, many years ago: why should a search engine need an Operating System (or a browser), but more about this later).
Chinese macroeconomic worries are not new (see Icahn’s from 2015). In most economies cycles are natural but in China there has been such a long expansion (since at least the 1990s) that a slowdown is considered a huge threat to stability. A recession would be seen as an existential threat. The CCP intends to manage its way through economic stress—one of the defining aspects of their semi-controlled economy is that “the state knows best” and markets can and should be controlled. This won’t last but the consequences are not likely to be catastrophic. China’s economy is probably large enough to avoid sharp changes which gives management enough time to muddle through. I would not say that this worry is unwarranted but rather that the changes are gradual enough to allow for some strategic planning.
The Tariff question has been partly touched on in a previous post. But the flip-flopping on the topic suggests that it’s a bargaining method similar to holding a gun to your head while threatening someone else that if they don’t do what you ask for, you’ll pull the trigger. Then relenting when they say nice things. Then repeating it.
Tariffs do not affect the customer relationship with the brand.
In 2016 Icahn’s worries were not geopolitical (they were just political) but has the world become more unstable since? The Covid pandemic was the trigger for much of this instability and we are still dealing with the consequences globally. However the bigger forces behind global changes are demographic and the subsequent loss of growth in China (and Russia) are causing authoritarians to find external threats to stay in power.
This will not play out quickly. There are worries but we should consider China (and India, and Africa) as sources of non-consumption that can and will be addressed with production. So the worry here is again structural and slow-burning. I would argue decades in the making.
Not much has been said about the benefit to Apple of its China strategy. Many assume that lower costs and access to a large market are all that has been gained. But it’s much more complex than that. The access was not to a lower cost base but also a much more agile and flexible production infrastructure. The flexibility allows for a very tightly coupled value chain. The result is a reduction in inventory and a rapid time-to-market which is essential to Apple’s integrated product/software/service rhythm of yearly launches.
I’d argue that without the flexible, at-scale production system China allowed Apple would not have been able to succeed at reaching a billion highly satisfied users. The world would have been awash with cheap Android phones and very few iPhones, a repeat of the PC model where hardware was largely irrelevant.
The challenge of the future is to take this model globally and either transplant it to India and other places or to scale it in such a way that it can be distributed to many centers of production. Toyota famously not only created a product system that reduced cycle time and inventory but did it with 400 plants globally. I certainly hope that the Apple Production System will also be celebrated one day as the “machine that changed the world”.
Come learn more about the Apple Production System at the ACTIVE conference.