Today marks the 16th anniversary of when Apple released the first-generation iPad. After Steve Jobs announced the iPad on January 27, 2010, it launched a few months later on April 3, 2010.
The iPad was the first device that Apple released with a custom-designed chip, the Apple A4.
The concept of a tablet device like the iPad actually predated the iPhone, and Apple had a prototype project in the works in 2004. Then-Apple CEO Steve Jobs wanted to prioritize the iPhone, so the iPad was put on hold until after the iPhone was established.
Apple priced the iPad at $499, and Jobs called it a "magical and revolutionary device at an unbelievable price." Like the iPhone, the iPad dominated the tablet space, and it still continues to do so today. Apple sold a million iPads in the first month, and while competitors like Microsoft and Samsung quickly came out with competing tablets of their own, the iPad has no match.
Apple has led the global tablet market for over a decade and no competitor comes close to matching its tablet market share. As of the fourth quarter of 2025, Apple's market share was 44.9 percent, with Samsung the next closest at 14.7 percent.
Apple has expanded its iPad lineup over the years, and we now have multiple sizes at multiple price points.
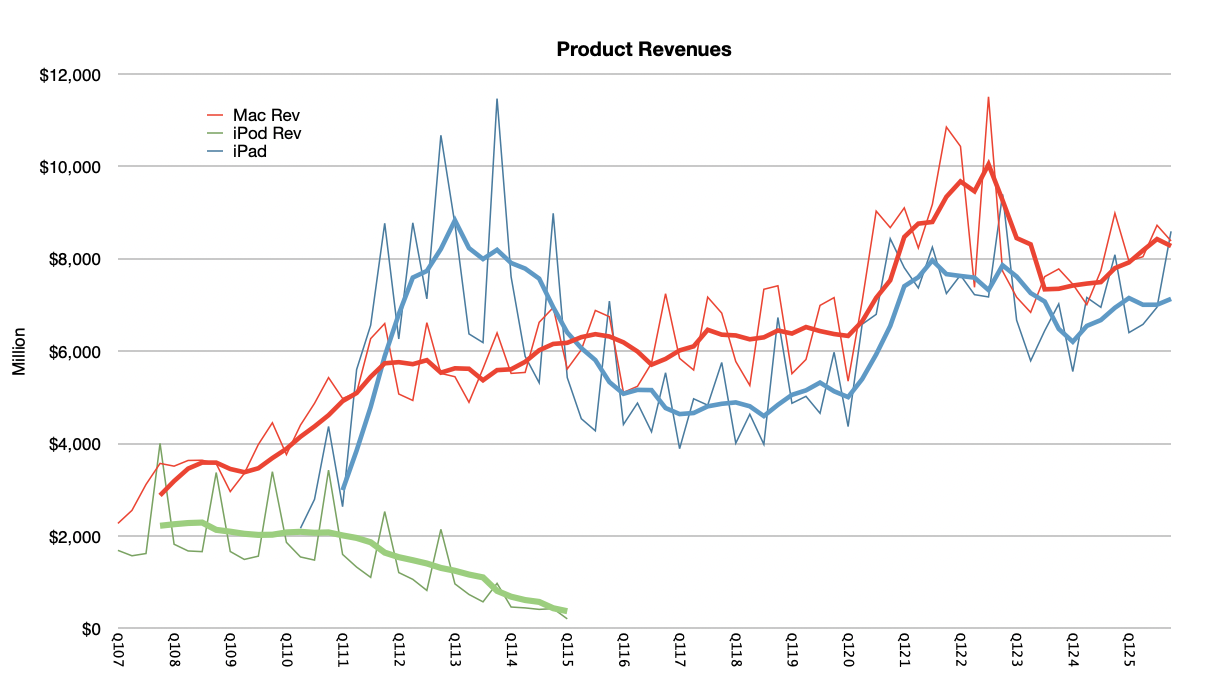
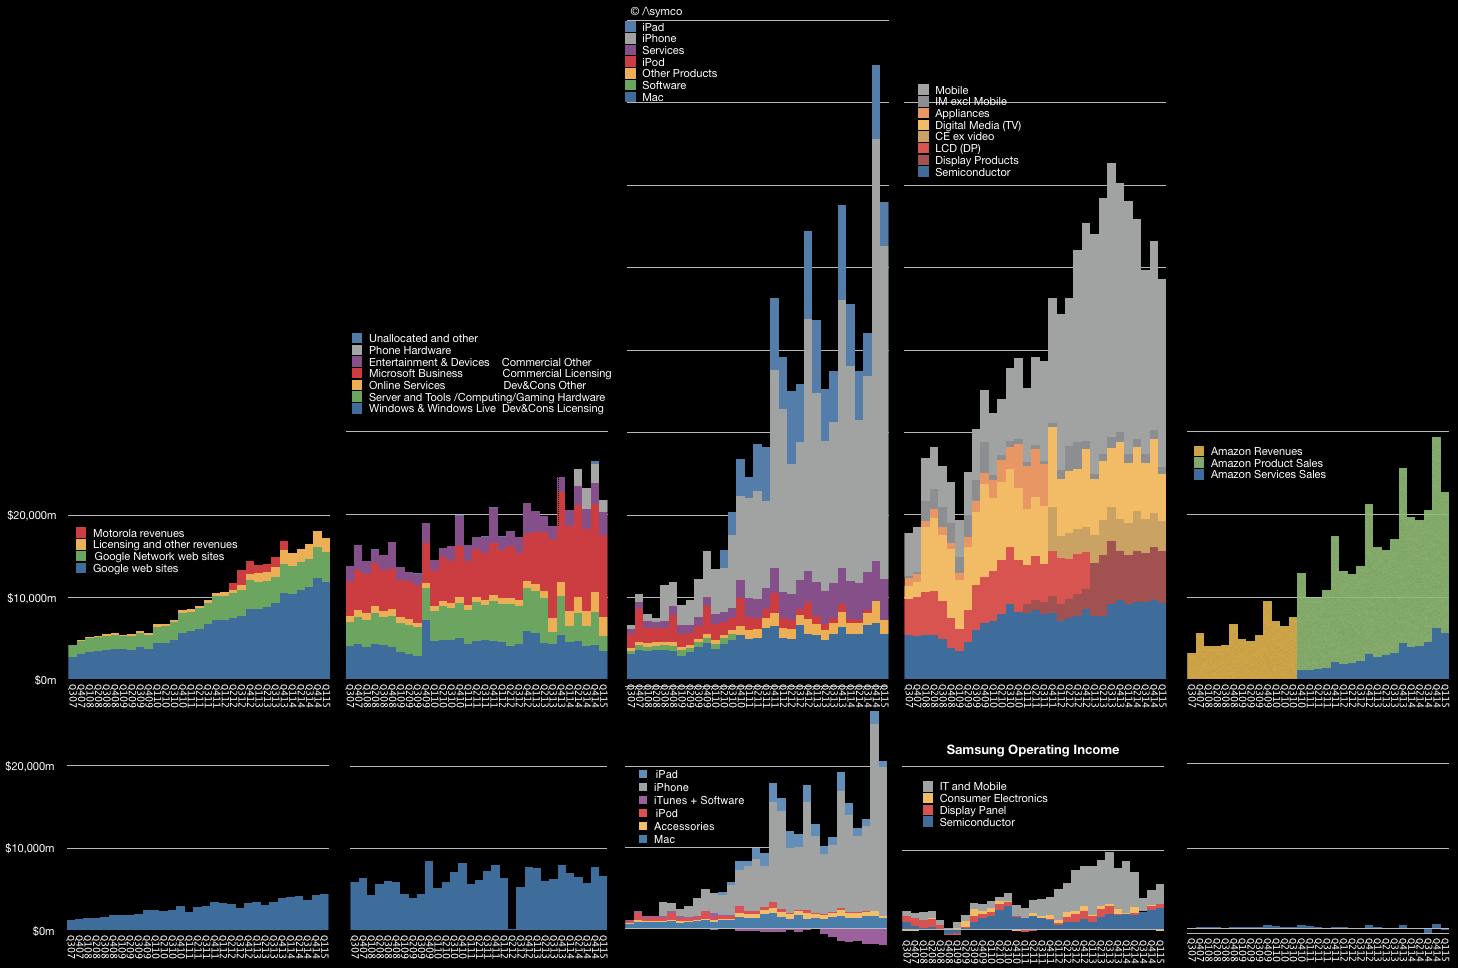
The graph above shows the iPad revenues compared to the Mac and the iPod. I included the iPod since the iPad was originally dismissed as a "big screen iPod touch". On the other hand, it was also seen as a PC or Mac substitute. To many, including Alan Kay, the tablet form factor makes much more sense than the PC form factor. It's more approachable, more intuitive and certainly smaller and more portable. As the graph shows, quickly after launch, the iPad overtook sales of the Mac.
What iPad has done is carved a niche that is resilient. After 16 years, I reckon about 910 million have been sold with about 70 million more sold each year. The product has a particularly long lifespan in use and may continue to be used for as long as 10 years. Total lifetime revenuel has been over $403 billion with about $29 billion last year. The total user base is between 400 and 450 million users. In the U.S., the iPad is highly prevalent, with over 40% of Americans owning an iPad in 2024.
Neither killer nor killed, the iPad is just a great "in between" product with plenty of value. I have no doubt that it will still be popular 16 years from now.
Ben Thompson of the Stratechery interviews Horace on the Stratechery Plus Podcast to discuss Horace's journey to become an influential tech analyst: early career in research, business school under Clayton Christensen, and his time at Nokia during the rise of the iPhone.
The conversation further explores Disruption Theory in the context of both smartphones and AI, why Christensen misjudged Apple, and whether AI could challenge today’s tech giants. It also marks the launch of Dediu’s new paid service Asymco One and reflects his continued conviction in Apple Inc. at its 50-year milestone.
In Apple’s first 50 years it shipped 5.13 billion computers. This shipment total is higher than any other computer company in its first 50 years. There actually are no other PC makers that are 50 years old. But all these things were true also 40 years ago. So what are we celebrating now that we did not celebrate at Apple 40? The answer is Services, the consistency in growth in user base and the potential trajectory of growth to never-before imagine audiences. The biggest change is a change of horizons. →
Says Neal Stephenson who first coined the term “metaverse” This revelation came soon after Meta canceled the Metaverse. Let’s look into Neal Stephenson’s mea culpa:
When I was working at Magic Leap, and people asked me why I thought that [Metaverse] was a good idea, I would ask the rhetorical question: “do you really think that twenty years from now everyone is still going to be going around all day staring at little rectangles in their hands?” →
How everyone is wrong about AI. The newspaper was an unexpected development It was not a product that anyone asked for. Like many innovations, it wasn’t an invention. It was not patented or discovered in a laboratory. It emerged as a result of the convergence of three disparate technologies: continuous roll printing presses, the telegraph, and the railroad. This convergence occurred by the 1830s, facilitated by a business model aptly named “the penny press”. Stepping back, the printing press was initially developed in the 1450s, 40 years before Columbus’ voyage. It went through numerous evolutions. The big change was moving →
Running a data-center AI model on a MacBook → Apple's MacBook Pro, with its unique Apple silicon architecture, could revolutionize personal AI by enabling powerful AI models to run locally without relying on cloud data centers, potentially shifting the competitive landscape in Apple's favor despite current perceptions of lagging behind in AI advancements. →
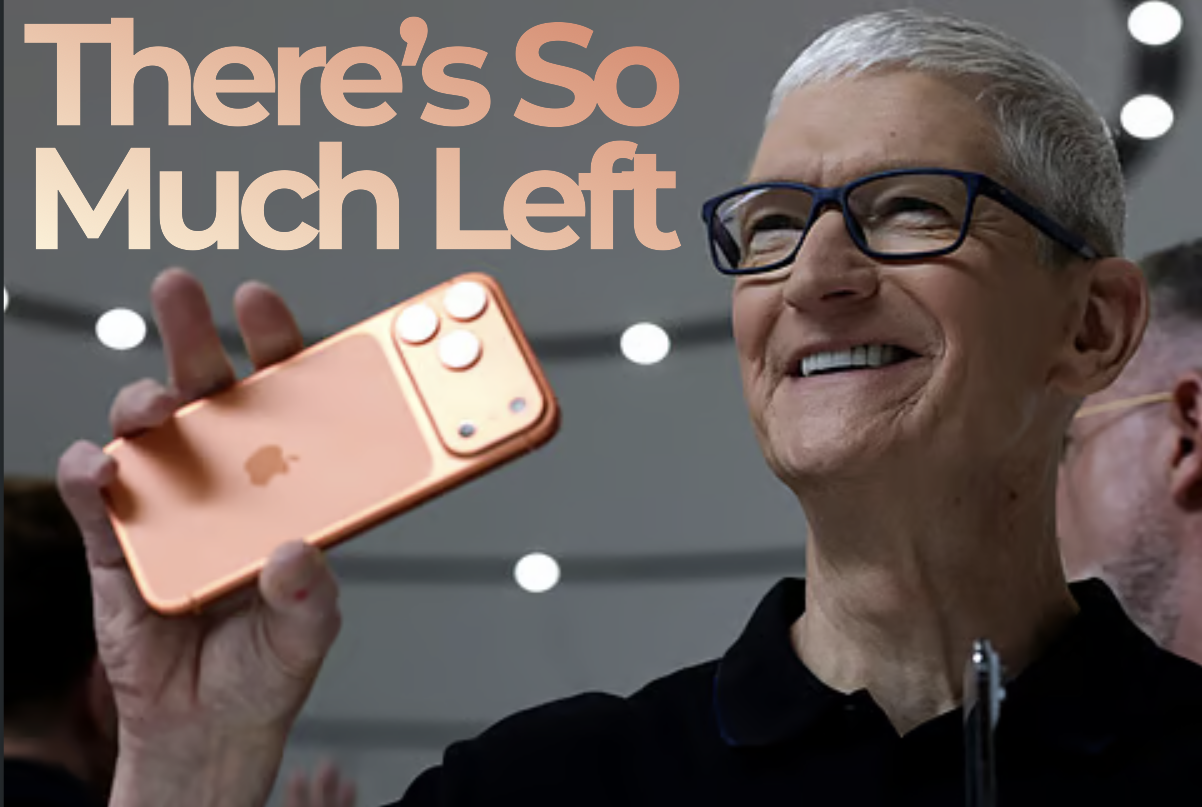
“There’s So Much Left” in iPhone: Tim Cook → Apple's relentless focus on user-centric innovation, epitomized by the ever-ascendant iPhone, underscores its enduring dominance and untapped market potential. →
Amazon developing a new phone more than a decade after its first → Amazon's renewed attempt at a smartphone, "Transformer," aims to integrate AI and deepen Prime ecosystem ties, learning from past Fire failures by addressing trust, scale, and developer engagement challenges. →
Mac fastest growing PC brand in India in Q4 2025 → In 2025, India's PC market soared to a record 15.9 million units, with Mac sales impressively up 24% year over year, hinting at a bright future despite looming 2026 challenges. →
Apple TV is a categorization failure → Apple TV, launched in 2007, struggled for 19 years as a misunderstood, underappreciated gateway to content, overshadowed by Apple's product-centric reputation. →
Apple’s Custom Silicon Opens up Potential for a Cellular MacBook → "Apple's C1X modem not only matches Qualcomm's performance but also reshapes the economic landscape for always-connected MacBooks, hinting at a future where seamless cellular integration redefines portable computing." →
Survey shows record upgrade interest for iPhones → Morgan Stanley forecasts Apple as the sole major smartphone vendor to gain market share in 2026, driven by strong upgrade intent and advanced features, while Android struggles with rising costs and declining loyalty. →
MacBook Neo Market Impact: Analysts weigh in → Market analysts predict the MacBook Neo will disrupt the low-end PC market, especially in education, by leveraging Apple's higher margins and user-centric design, despite challenges from price-sensitive K-12 sectors dominated by Chromebooks. →
World’s most respected Apple Analyst. —Macfilos
Like what you read? Get more from Asymco One: full access to Asymco's research, analysis, and commentary.
In December, the company lost AI chief John Giannandrea, its top lawyer and a key design executive in a single week. Other recent headlines: “Apple faces unprecedented executive exodus”, “Apple rocked by executive departures, with chip chief at risk of leaving next.” “Apple home devices executive leaves for Finland’s Oura” “Lisa Jackson is set to retire late January 2026, while Kate Adams will retire in late 2026”. That’s just the names we hear about. They represent senior executives. But the harsh truth is that Apple lost tens of thousands of talented developers, marketers and mangers last year.
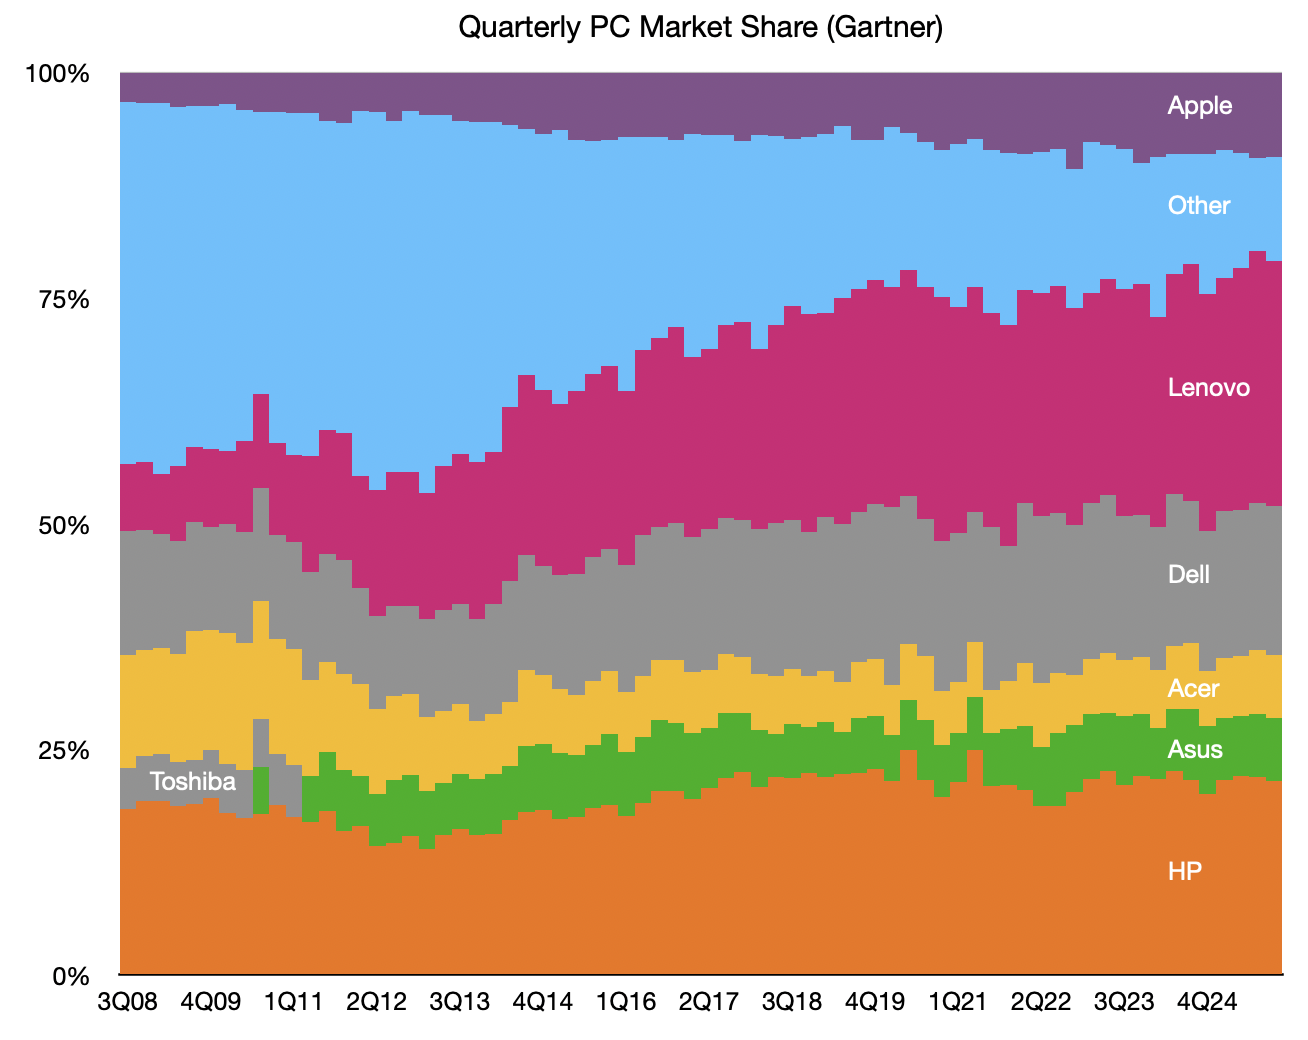
Almost 10 years ago I said “Managing the Mac product line must be one of the most challenging problems at Apple. That may not be obvious given the product’s success.” I pointed out that although the company grew the Mac into a redeemed and prosperous platform, “The big change in computing has not been a growing Mac vs. declining PC. It has been a huge surge in mobile device use vs. a decline in PC use overall.” It’s time to revisit this observation. First, a status update: The Mac is in its 42nd year...
How to read the history of the Mac and how to look at market share gains potential. Also: why the Mac has always been a cheaper alternative for buyers. →
Running a data-center AI model on a MacBook → The article discusses how Apple's MacBook Pro, with its unique Apple silicon architecture, could revolutionize personal AI by enabling powerful AI models to run locally without relying on cloud data centers, potentially shifting the competitive landscape in Apple's favor despite current perceptions of lagging behind in AI advancements. →
Lobster Boil → "OpenClaw, a revolutionary open-source AI agent by Peter Steinberger, transforms personal computing by autonomously managing tasks across platforms, sparking a Mac Mini craze and hinting at a future where AI agents are integral to daily life." →
‘No Near-Term Catalyst,’ KeyBanc on Apple Stock → Near-term catalysts may not sway long-term investors, but if Apple's valuation seems steep, critique the pricing, not its promising 14% revenue growth forecast. →
Harmful chemicals found in popular headphones → Apple's AirPods Pro 2 and JBL's Tune 720BT topped the safety charts, while budget brands like Temu raised red flags for hazardous chemical exposure. →
When does Apple split its stock? → Apple's stock split history shows a pattern of adjusting high share prices to maintain accessibility, with splits occurring around $100-$650 thresholds, potentially hinting at a $300 minimum for future splits. →
Apple led in NAM, Europe and Asia-Pacific, while Samsung led in LATAM and MEA.Premium models led in NAM, Europe and APAC, while entry- to mid-tier models led in LATAM and MEA.
In NAM, Apple’s iPhone 16 5G led the market. Samsung’s Galaxy A16 5G was the only Android device to feature in the top five, driven by volumes in the prepaid segment.
Within APAC, Apple secured all the top five positions. All top five models in LATAM and MEA were 4G smartphones.
Apple and Samsung dominated the list of highest-shipping models globally in 2025, with the two brands capturing the top two spots across major markets, according to Counterpoint Research’s Market Monitor Monthly Shipment Tracker, 2025.
However, regional variations did exist with premium models leading in North America (NAM), Europe, and Asia-Pacific (APAC), while entry- to mid-tier models led in Latin America (LATAM) and the Middle East and Africa (MEA).Top Five Highest-shipping Models by Region, 2025Source: Market Monitor Monthly Shipment Tracker, 2025
NB:Apple led the markets where premium was normative. This suggests that Apple still has opportunities in Latin America, Middle East and Africa. Stay tuned for an in-depth analysis of this at a country level.
As expected, Apple took the top spot in Q4 2025 and increased its share compared to Q4 2024, with shipments growing 7% YoY thanks to a strong performance by the iPhone 17 series.
Samsung took second place, with its shipments growing 4% YoY and share also increasing YoY to 29%.
Apple’s strong growth in Eastern Europe and increased competition in Western Europe ate into Xiaomi’s market share, causing a 6% YoY decline.
About a year and a half ago in Lasts Longer I noted that "keeping iPhones in use" became a top priority for Apple's design for sustainability. I considered this provocative because it prioritizes usage and users over units sold, in contrast to how the company was perceived by investors. This new focus was reinforced by the company's dropping of unit shipments data and the addition of Services data including subscriptions count and gross margins.
Apple effectively transformed itself into a services company with customer acquisition, subscriptions (measured by average revenue per user) and retention/satisfaction as key operating metrics. The 1.5 billion active devices and ~1 billion active iPhones and 500 million paid subscriptions are the new data points rather than units sold.
To succeed with this new Lasts Longer strategy, one of the objectives should be that devices become more durable and their durability should in-turn result in more minutes of use and thus more return on initial purchase price. But how can we measure this? We don't have precise data on the use time. We have some anecdotes but no official data. We do know the iOS operating system is now designed to work on older hardware but that does not give us a measure of what is in use.
Luckily we now have an indicator that can help: Bank My Cell published a new data set on various used phone prices. This is a gold mine.
The data consists of prices for about 220 used phone models that changed hands in 2019. The prices are given for the beginning of the year (earliest date when the model was sold) and the end of the year (latest date when the model was sold.)
It's thus possible to see how various models from a number of companies changed in price during the year. The date of initial release of the phones is also given (though initial selling price isn't. It's a bit tricky to determine initial selling price because the model may have been sold for an extended period of time and discounted through that period.)
What we do have allows comparisons between different manufacturers to see, especially for recent (late) models, just how big the drops have been in prices.
I recommend reading the original post to see some of the comparisons between brands. In addition I chose to illustrate some of the differences with the graphs below.
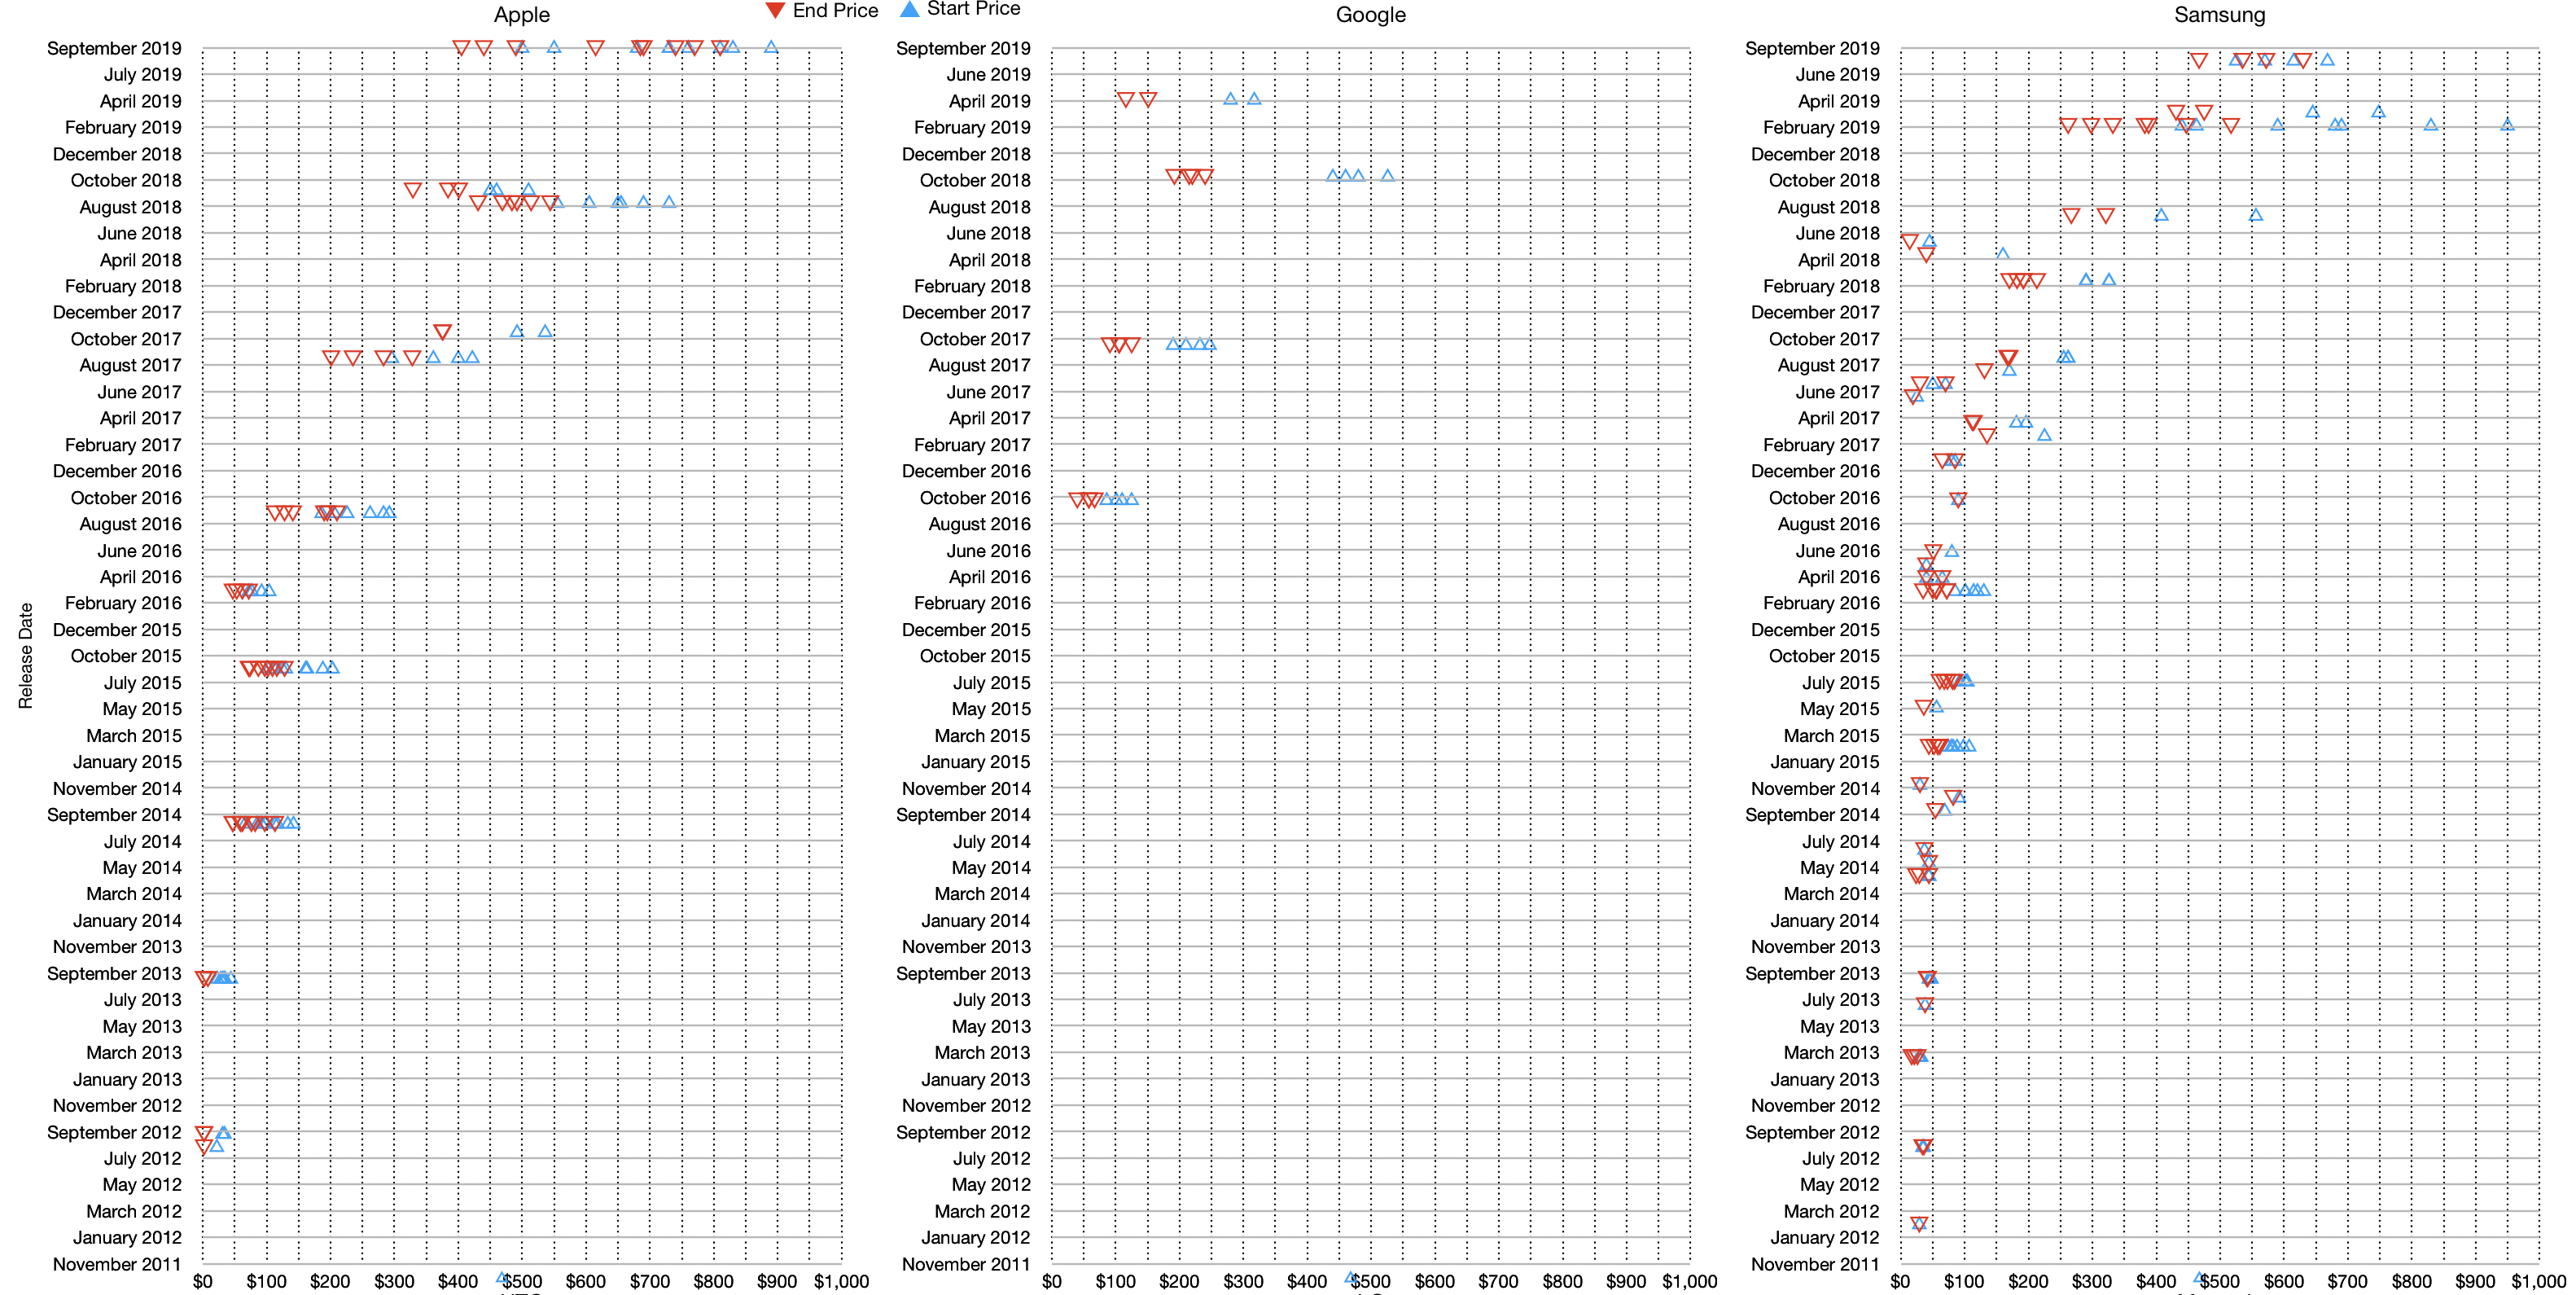
These graphs show phone model prices at the beginning of 2019 (blue) vs. the end of 2019 (red). The models are not individually identifiable but they are shown by the year of introduction. So, in the case of the iPhone, the 2019 cohort (those released around September 2019) are the top line, then the 2018 group is shown in the second line and on down. Thus the oldest iPhones traded during 2019 were iPhones 5, initially released in 2012.
To read the graph, you can scan each line to see the gap between the red and blue triangles to see how much the phones roughly fell in value. The comparison above is between Apple, Google and Samsung.
Here are some patterns I noticed:
Google phones had larger drops during the year than equivalent iPhones. Just how much the drops were is listed by the original post: "Google lost an average of -51.68% between Jan-Dec 2019. The Pixel 3 (2018) was the fastest depreciating and highest value loss at -56.70% (-$267)".
The overall picture of Samsung's phones is hard to discern. Flagship Android phones ($700+) dropped in value roughly twice as fast as Apple's. But the the overall picture is messy. Budget phones are mixed with premium and the average pricing seems to quickly go near zero.
iPhones have a more valuable "mid-range" for models more than 2 years old. Android phones fall hard in the mid range and cluster around zero quickly. This is the heart of the "old but valuable" proposition.
Depreciation rates might seem academic but depreciation is an indicator of a real perception of value and that in itself is a reflection of utility. Users are likely to pay for a used product only if they think it can still be useful in proportion to the price. New product buyers might pay for other things like prestige, status signaling or just wanting to be first. But used buyers are more mindful of what the product can do--they are less likely to benefit from signaling.
Analogously, the used car market often shows the underlying quality or reliability of a car model. If a luxury car plummets in value it means that it becomes a huge burden to late usage, usually due to servicing costs. In previous decades luxury cars were also durable cars but with complexity they became money pits.
In the used phone market hardware repair and maintenance are less consequential but there is a concern for software support, security and privacy. The serviceability of the battery, the camera quality and the fit and finish of the body matter.
Buyers are not stupid. The market speaks words of wisdom. A phone that is worth more will reflect more inherent utility. Remember that a phone is unlocked more than 80 times a day. If it has 4 years of use then it get unlocked 116,000 times. That's not "uses" but unlocks. Actual usage in terms of taps, swipes, or glances could be triple that figure. There are phones on the list that are 7 years old. It's not unreasonable to assume that a moderately well used iPhone has enabled a quarter million interactions.
Remember that phones are used all day, every day. At home and at work. In cars and in planes.
Even on weekends, and on holidays. And even when you're "social distancing".
In fact, the more physically isolated you are the more likely you are to rely on the phone as your social lifeline. In difficult times the product people turn to first and last isn't one of luxury or frivolity. It's a product that keeps you informed, connected, lets you help others and may even keep you alive.
It's in difficult times that the true character of a product shines through. The smartphone, derided, mocked and blamed for all kinds of societal ills is what we turn to first to avoid getting ill.
Will there come a time when Samsung will earn more profits from the iPhone franchise than from its own Galaxy product line?
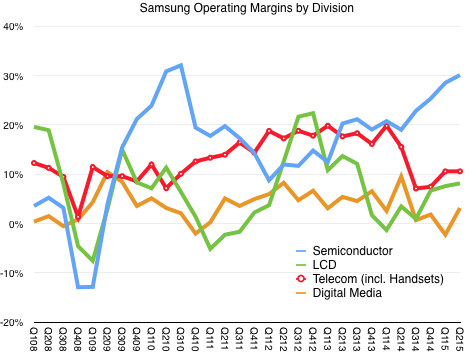
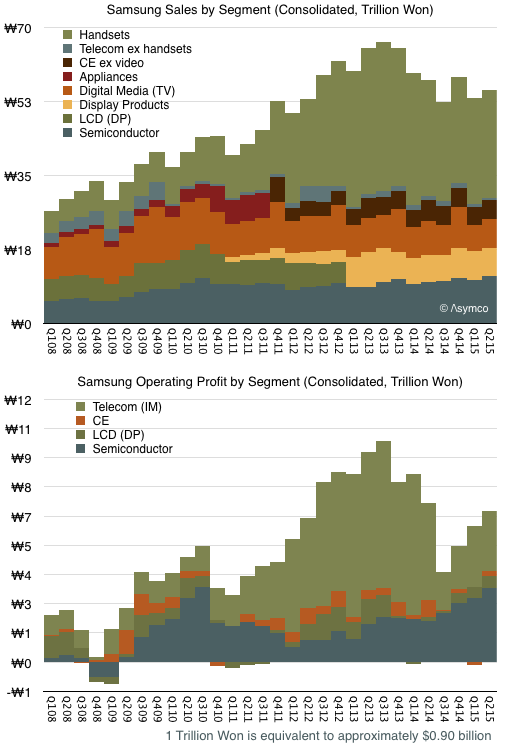
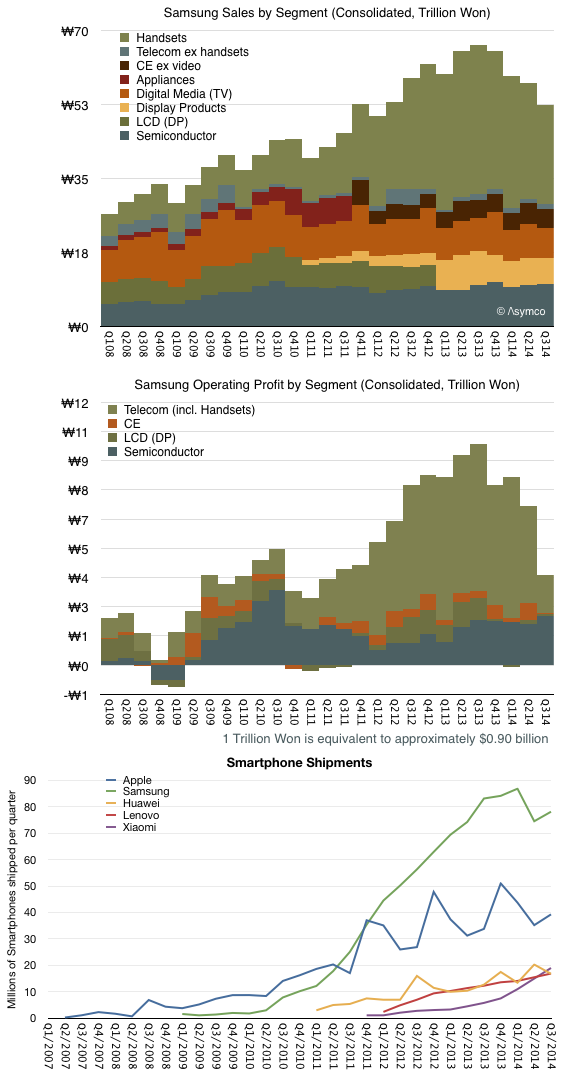
The problem for Samsung is that although it still sells the most phones ((over 80 million but we don't have a precise figure)), and the most smartphones, the price and margins for these products are collapsing. The pattern is shown in the graphs below:
Phone operating margins peaked in Q1 2014 at 20% but are half that level today. These margins have dropped to levels Samsung had in 2009, before the Galaxy launched and before they had any substantial revenues from smartphones.
In contrast, the semiconductor group is growing both revenues and margins. Margins and operating profits are both 50% higher than those of devices.
We also know that Apple is Samsung Semiconductor's single biggest customer. We can't be sure how much of the total revenue/profit comes from Apple but if the pattern continues then Apple could be the greatest contributor to Samsung's profitability in the near future.
How could this be? Wasn't Samsung supposed to "disrupt" Apple?
The reality is that Samsung's own smartphones are being disrupted by good-enough Android devices, typically made by Chinese brands. This low-end disruption is also affecting LG, another phone maker and Apple supplier.
Unlike Samsung and LG, Apple is less susceptible to low-end disruption. What Apple offers is a brand promise, an ecosystem, associated products and services and what amounts to a new market. It's this parallel value network that competes with Android/Google, rather than with Samsung.
Samsung is a supplier in the Apple network and a licensee in the Google network. As a result, it has a near monopoly position with a platform controller (Apple) and a commodity position with a platform licensor.
Neither position is one of control, but the current market stage benefits Samsung within the Apple ecosystem more than in Google's ecosystem. It's a situation analogous to one where Intel made both x86 chips and PCs that ran Windows. Long term it's likely that the sole-source chip business does a lot better than the multi-source systems business.
That should be a warning to others who hoped to survive as Android OEMs. They don't have semiconductors to sell to Apple.
Searching for "iPhone killer" returns millions of hits. It's hard to remember any phone/product/service/platform/initiative/merger/startup which was not at some point considered an iPhone killer. A sampling is offered here.
In reality, the killers seem to have all faded away while the iPhone continues. We could just shake our heads and move on, but a deeper analysis is possible. Take a look at the graph above. Note that iPhone's (and hence Apple's) ascent has not caused decline in its nominal competitors. When seen in the context of the graph above, the success of the iPhone has in fact been complementary to those companies who would be its killers.
Consider that the iPhone drives a large portion of Google's revenues as it is the home to many Google services and engagement through the iPhone is higher than any other platform, including Google's own. iPhone users tend to make better customers. In exchange Google pays a great deal for traffic acquisition on iOS devices. The placement of search on Safari is probably the biggest single cost item on Google's income statement ((Estimates are a few billion dollars a year.))
The iPhone example drew Google to build Android as a facsimile and that, coupled with Brobdingnagian spending on marketing, led to Samsung's Galaxy success. That success seems to have peaked and the brand is now a victim of low-end disruptors which copied it and the iPhone in turn. However, Samsung electronics benefits from the iPhone in terms of its semiconductor division. Apple is Samsung's biggest customer and the semiconductor division is now the largest source of operating profits.
The explosion of Android has led to IP licensing revenues for Microsoft and now Microsoft is extending its software applications to iOS, hoping to participate in the iOS ecosystem rather than competing with it. The time may come when Microsoft shows growth from the iPhone.
Finally, although it may seem oblique, Amazon is benefiting from the iPhone. Instead of killing it with the Fire ((presumably as a low-end disruption)), the iPhone and iPad offered much more mobile shopping opportunities to the Amazon store. Data shows that iOS leads in shopping traffic and order size precisely at a time when Amazon obtains its largest volumes. Amazon's AWS also handles a great deal of iOS-originated traffic.
This alternate reality shows that the benefits from the iPhone revolution are broad and deep. It's not just the direct revenues (($25 billion paid so far)) from app sales on the App Store but also the creation of entire new communications modalities (Instagram, Snapchat, WhatsApp) new services (Uber, Airbnb) and the multi-billion dollar accessories markets. These benefits are largely unmeasured and therefore not visible in accounting systems. They are perceivable however.
Users perceive the value, developers perceive the value and, in the end, the only account that matters, the brand, accrues these perceptions to grow in value.
As the brand flourishes, the perception of vulnerability dissipates and the narrative shifts from Apple getting killed to killing it.
It's taken eight years and 500 million loyal users but, perhaps, just perhaps, this change in perception is entering the collective consciousness.
The adoption curve has been used to categorize adopters into groups by their behavior: innovators, early adopters, early majority, late majority and laggards. This categorization asserts that adoption is function of psychology, or the likelihood of people to act or react within social systems. [Rogers first edition 1962]
It's a compelling model and has been proposed as a tool for firms to help with their marketing strategy. As diffusion proceeds through each adopter category, the product is re-positioned to address each group's presumed behavior. Innovators (first 2.5% of the population) are offered novelty, a chance to experiment and uniqueness of experience; early adopters are offered a chance to create or enhance their position of social leadership; the early majority build imitate the leadership of the early adopters and justify it with productivity gains; the late majority are skeptics but, given a set of specific benefits, join the earlier adopters. Finally the laggards reluctantly agree to adopt as their preferred alternative of not adopting disappears.
The theory suggests that a firm can be successful if they modify their marketing and perhaps product mix to accommodate these adopter categories in a timely manner.
If this is the case however, why is it that those who have access to these data (i.e. who is buying and when) not to do the right thing? Why is it that during a technology adoption curve, there is a high degree of turnover in the firms which capture profits from the products that deliver this technology?
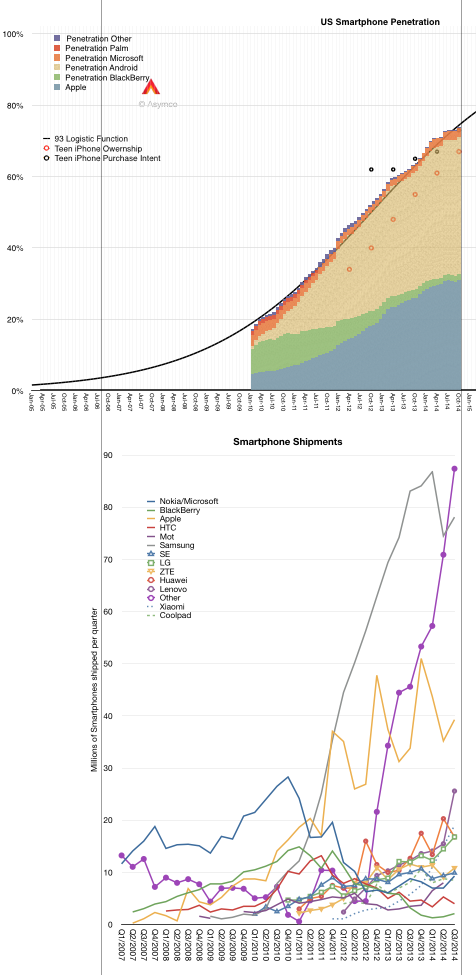
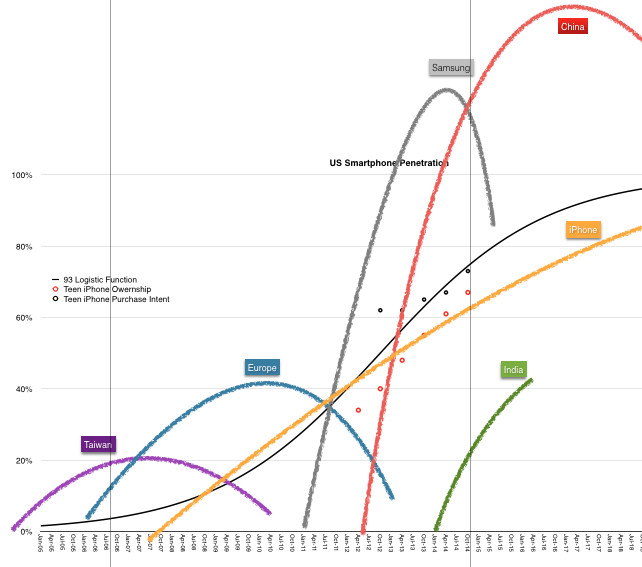
If you don't believe this to be the case, consider the smartphone market. The data about buyers is easily obtained (even without paying a fee). Shown below is the US smartphone penetration data as obtained by comScore (including teenage survey data from Piper Jaffray).
Following the penetration data there is a second graph showing the smartphone shipments for the largest vendors as well as the sum of the "others" which make up the difference with the total market. I used vertical registration lines to align the different data sets to the same time scale.
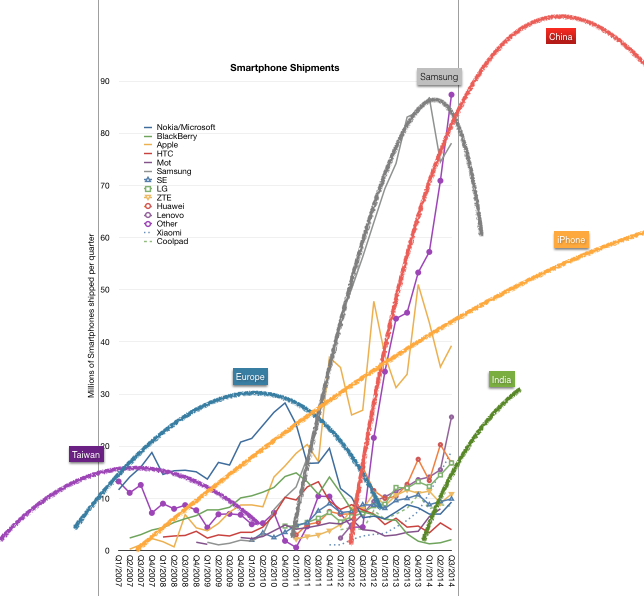
Having observed the market for some time, it's possible to see a set of "epochs" which show the rise and fall of various platforms/vendors/geographic production areas. I applied these "epochs" as a rough sketch over the production data.
I define these epochs as:
The Windows Mobile epoch from 2003 to about 2010 peaking in 2007. Competitors from Taiwan using Windows Mobile fielded a large number of devices and led that platform to win over proprietary Palm and Symbian.
The Nokia/RIM epoch from 2005 to about 2012 peaking in 2010. Nokia's distribution power takes its platform to global dominance. At the same time BlackBerry surges in popularity peaking at about the same time.
The Samsung epoch from 2010 to (probably) 2016 peaking in 2014. Samsung surges from almost no smartphone volumes to double the nearest competitor in a matter of three years.
The Chinese epoch from 2012 and ongoing. With a vast number of new competitors doubling or tripling sales over a few short years, "Other" becomes once again the bulk of volumes with additional brands like Lenovo, Huawei, ZTE, Xiaomi, Coolpad adding to the total.
The (probable) Indian epoch from 2014. This epoch is not so much of or about India as the "local brands" which begin to have large, even majority, market share in markets such as India, Indonesia, Philippines, Vietnam, etc. This epoch is the triumph of the local over the global and represents the latter stages of adoption.
Now I deliberately left out Apple because, as can be seen in the shipments data, Apple never held a pre-eminent volume position. It is however a competitor with a steady rate of growth. So steady in fact, that it seems to mirror the overall market. Essentially, Apple shows that there is a potential for growth without competitive flux. A type of growth that is "systemic" rather than a function of some rivalry and hence turnover.
But Apple is an exception. As so often it tends to be.
The real puzzle is why are there so many turnovers in leadership in such a short span of time. The idea that five distinct eras can exist in a mere decade seems preposterous. These turnovers are not without economic drama. They are booms as well as busts. They happen in a market where there are literally billions of consumers spending the equivalent of $300 billion/yr. so the stakes are pretty high.
But it's even more strange. If you super-impose the epochs on the (early) diffusion curve you can observe how a predictable adoption curve ((I.e. one whose shape can be determined well in advance and updated with very high precision)) results in unpredictable success in the market.
There must be something about the way companies behave *while* they are watching the evolution of the market. They seem to be running at a cycle time far faster than the market's overall absorption rate. Is this because competition is forcing them to mis-spend their energies?
Could it be that the behavior of firms is also a function of the psychology and reward systems of managers? That they seem compelled to optimize for a time frame shorter than the economic lifespan of the technology? That this mismatch of phase between lifespans of a technology market and their profit model leads to premature demise of their market position?
Samsung's smartphone ascent was breathtaking. From having essentially zero market share in the category in late 2010 to becoming the largest vendor took less than two years. In doing so it grew to become the largest phone vendor, smart or not--a goal which eluded them during the previous decade of effort. Samsung went on to capture not only the lion's share of unit volumes, they also took almost all the profits in the Android mobile phone market.
And in a market filled with competitors. Literally hundreds of vendors and thousands of products were available at every conceivable price point. Samsung did away with HTC, LG, and Motorola. HTC, the first Android vendor (and first to market with Windows Mobile), Motorola, Google's launch partner in the US and "Droid" brand partner (and future owner). Google's own Nexus products. Samsung Galaxy ruled them all.
Galaxy swamped the Chinese market and the Indian market, the largest in the world. They were so powerful that they were singled out both by Microsoft and Apple for IP royalties.
All within two years or the average life-span of one smartphone.
But something went wrong in 2014. Growth in shipments suddenly stopped. This was not a problem with the overall market, which kept growing. The slowdown did not affect other vendors, especially the up-and-coming Lenovo and Xiaomi and the second and third tier vendors whose names are known only in the local markets they serve.
The result of this slowdown is shown in the following graphs:
<>
Note how the wobble in units shipped was foretold by slowing revenues and an even more profound effect in profits. Peak revenues and profit occurred in Q3 2013 while volumes continued to grow until Q1 2014. Even in the last quarter, shipments are at near year-ago levels. Profits however have dropped to 2011 levels.
At the same time, Apple shipments continue to grow as do those of Lenovo, Huawei and Xiaomi. Xiaomi in fact is growing in a trajectory eerily parallel to that of Samsung from 2010. It just hit the same level of volume that Samsung had in Q2 2011. And Samsung had been making phones for decades while Xiaomi is barely two years old.
Having seen a boom/bust rise/fall pattern with other vendors (e.g. Nokia and Blackberry) it should behoove us to ask what are the causes of success and failure in this business. Samsung management suggests that they perceive speed of action, product mix/portfolio choices and hardware experimentation are the keys to their success.
However, competitors which are rising rapidly (at the expense of Samsung) are not acting in the same way. Xiaomi is patterned as a Chinese Apple, offering design, brand, attention to detail and software as differentiation. Lenovo is building on its computing roots and expanding with acquisition. Huawei and ZTE leverage networking business and operator relationships.
The crisper answer to causality may be that the market is bifurcating into an "upper" market where new jobs-to-be-done are being explored with integrated offerings (Apple and Xiaomi) and a "lower" market which is in the throes of low-end disruption. Both are competing with non-consumption though the upper market is service non-consumption and the lower market is feature non-consumption.
Samsung is stuck right in the middle ((Just like Nokia was.)) It defines itself on the basis of what exists. It competes only within a defined market and positions itself agains existing products. They claim to be "better" than the competition and make the point loudly with their advertising. However, being better is never a solid foundation. At some point you'll be either good enough or someone more agile will be faster than you.
At some point the fast follower exposes themselves to being faster followed. Better to find new lands to conquer.