Asymco

Asymmetric Intelligence

search engine

  1. Android Economics

    Research · 88 comments

    Charles Arthur, writing for The Guardian, has noted that court filings seem to be revealing Google's Android revenues. If this is the case, we have a significant breakthrough in understanding the economics of Android and the overall mobile platform strategy of Google.

    The new data is a reference to a settlement offer Google made to Oracle of $2.8 million and 0.515% of Android revenues on an ongoing basis. The key assumption to make this data useful is that the $2.8 million offer represents 0.515% of revenues to date.

    In other words, that revenues from 2008 to end of 2011 multiplied by 0.00515 results in $2.8 million. That implies that revenues from 2008 to 2011 were $544 million.

    I think that's a fair assumption. I don't see why Google would offer a higher or lower royalty rate for years 2008 through 2011 than for years after 2011. The offer would seem to be 0.0515% in the future as well as retroactively in the past.

    If we work with this assumption then the next question is how to distribute this $544 million over the four years 2008 through 2011? The installed base of Android has grown exponentially and it would seem logical to assume that revenues have followed in a similar pattern. Here is a chart of installed base given activation data supplied by Google.
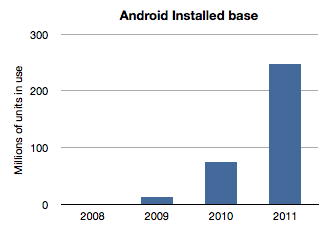
    If we assume revenues were distributed the same way we would get something like this:
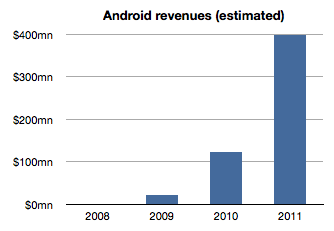
    The sum of the bars in this chart equals $544 million and the ramp is approximately the same as the installed base. The relationship between the first graph and the second is a multiple equivalent to the revenue per device.

    Therefore a second assumption is that revenue per device remained fairly constant. In this model the revenue comes out to be about $1.70 per device per year. It's possible that rev/dev/yr. is increasing as Google services are discovered by users. It's also possible that the rev/dev/yr. is decreasing as later adopters are less likely to engage as early users. I just don't know how to adjust this value so by leaving it at the average, I can avoid introducing more assumptions.

    Now we can stop and look at this figure and do a test. Does $1.70 make sense as a device revenue for Android? Google had spoken about targeting $10/device/yr. but we have no indication that they are nearly at that level. If they did achieve that level, with an installed base of 300 million, Google could be collecting $3 billion a year in Android income. Are they getting it?

    As of October, Google mentioned that it had a $2.5 billion "mobile run rate". But we know that this figure is not only from Android. Mobile includes all mobile devices and services including those running inside iOS, Symbian, BlackBerry, Windows Phone, etc.  They could be counting ads on all mobile browsers as well as ads running inside all apps on all platforms. Furthermore, Google also testified that iOS accounts for two thirds of their mobile search revenues[1].

    Adding run rate to the Android revenue chart results in the following:
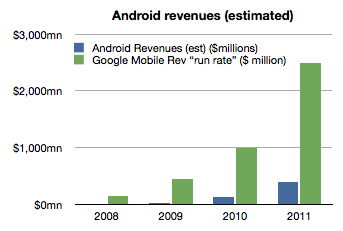
    So the step is to take the "run rate" figure of $2.5 billion and assume, as Charles Arthur did, that iOS income is what is left after taking out the Android part[2]. I also noted that Google previously mentioned a run rate of $1 billion and I will assign that run rate to 2010 and $2.5b to all of 2011. Since we know the number of iOS devices in use for years 2010 and 2011 we can calculate Google's revenues per iOS device in use.

    If we thus combine all the data we know (revenues derived from settlement offer, units in use, run rate and iOS installed base) we get the following revenue profile:
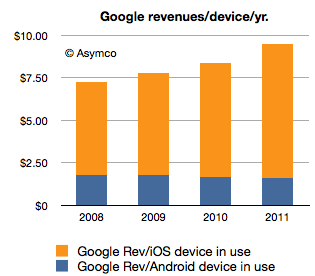
    This shows a positive trend for Google: revenues per smartphone per year is increasing. However, the growth is coming from non-Android devices which means mostly iOS. Revenues per device for Android is probably declining.

    The story for iOS revenues however is not all rosy for Google. Google has to pay for that revenue. The mechanism is a payment that Google makes to Apple for the prominent and default placement of Google search on Safari.

    We don't know the terms of the arrangement but if we assume $2/device Google needs to shave $2 from the top of the chart above with that money going to Apple (attached as iPhone/iPad service revenues.)[3]

    That still leaves a healthy $8.33 in 2011 as operating income from mobile with $1.70 or so coming from Android.

    However, to make this operating income into bottom line profit, we have to extract the R&D and SG&A associated with mobile at Google. This would be, therefore, Andy Rubin's yearly budget.

    Andy Rubin has stated in the past that Android is profitable. That is certainly believable. The budget would have to be about $400 million/year in 2011.

    Charles Arthur concluded that Google obtains four times more revenue from iOS than from Android. My estimates indicate that in 2011 the revenue ratio was closer to 5 but if we subtract the cost of those sales in the form of payments to Apple then the ratio could well be four to one.

    Many of these figures begin to "hang together" as we balance assumptions about costs, revenues and statements made in public. There is a consistency within a comfortable margin of error. If that is the case, then the economics of Android begins to take shape.

    My take is that it's not a bad business. But it's also not a great one. As long as there is exponential growth in units, Android will improve its position inside Google relative to iOS. But from Google's perspective, iOS is today a bigger business. And iOS is not standing still. It's growing not only in terms of units but in revenue per unit.

    Strategically, and historically Android was never one thing. P&L considerations were not the only (or even at all) factors in investment for Google. Having a hedge against hegemony of potential rivals, having a means to learn and develop new business and having a role in defining the post-PC computing paradigm are all probably bigger considerations than profitability.

    So in terms of returns, Android is sustainable. However, in relative terms the value created leaves much to be desired. Whereas Android generates $1.70/device/year and thus an Android device with a two year life generates about $3.5 to Google over its life, Apple obtained $576.3 for each iOS device it sold in 2011[4]. The economics of Android are nothing like the economics of iOS.

    ---

    Notes:

    1. This figure is also not conclusive as search is not the only form of revenue on a mobile device but it does imply that Android is not the majority of Google's mobile revenues.
    2. Clearly this is overstating iOS as the non-Android income is broken up between several platforms. We can only say that iOS is the vast majority of non-Android income.
    3. Assuming a $2/device payment model means Google paid $312 million to Apple in 2011 and $171 million in 2010. This would go toward boosting Apple's revenue per iOS device. Naturally, if this distribution cost is higher or would be subject to re-negotiation then it could vary widely.
    4. The iOS figure includes accessories and licensing of trademarks but excludes income from App Store, iTunes music, movies, TV shows, iBooks, greeting cards or textbooks.
  2. Why Carol Bartz was fired

    Research · 40 comments

    Occasionally I write articles titled "Why CEO X was fired." You can read one here, and here and here.

    These are allegorical stories. I don't base the opinion on evidence but on perception of what's wrong with a particular company's strategy and then try to trace the point of strategic failure which should have triggered management change. Of course, the reasons are often something else, probably mundane or "political" in nature.

    The objective therefore is to analyze strategy and more precisely strategy failure.

    So, Yahoo! What went wrong?

    Before we answer that, we should know what went right. Yahoo, like Google, depends on advertiser revenues. For that, it sells the behavior of its users. It processes over 25 billion events every day and builds a database (estimated to be in 10s of petabytes) to mine for information that is, hopefully, worth something to advertisers.

    But in order to get user behavior it needs to provide compelling reasons for user participation. For that, Yahoo licenses content and offers communication services (among other things.)

    This sounds like a reasonable business model. So what could go wrong? As always, we begin by measuring performance along a prevailing basis or axis of competition. Has Yahoo's product been improving in ways meaningful to its customers? Is that improvement beyond what buyers value or can absorb? To answer, we need to be careful in recognizing that the customer is the advertiser, not the user. Like in all advertising business models, the user is the product.

    So when seen in this context, the problem becomes clearer. We have to determine whether the product (user behavior) is good enough or too good. We have to compare it to alternatives which might offer better price/performance for a given customer need.

    There is little data we can draw upon, but my initial hypothesis is that the behavioral product that Yahoo has been delivering is over-serving while search and social data is what customers are increasingly looking for.

    Part of the reason is that Yahoo's raw material is licensed content. The value of that material has decreased as users turn to either social media or seek out filtered, niche information sources which are outside the generic feeds Yahoo provides. Therefore, as Yahoo's traditional raw material has commoditized, so has its user behavior data. The patterns that are emerging from the data are "unactionable" by advertisers. There is little insight that can be gained from data on patterns of reading generic news. People are differentiated through their reading of niche sites and that data does not reside with Yahoo!

    Thus customers (advertisers) have felt that the product (user behavior from reading licensed content) is commoditized. There is much more value in looking at patterns in Facebook or search. But those rich fields of data are under the control of competitors.

    This is the core problem with Yahoo's business and it's been a problem for a long time. The question for a CEO should be how to fix this. The remedy is not better administration but either a change in the core business or innovation in terms of content sourcing (away from big media and toward blogs and niche media.)

    Sadly, the steps required to get there should have been taken years ago. And perhaps the required changes imply so much displacement and disruption in the operating and financial structure of the company that it would just not survive the operation.

    Which is why Bartz was fired. There is no evidence that she tried to engage in surgery or that there was any therapy process under way during her tenure. The patient, I'm afraid, is still dying.

  3. Pattern recognition for smartphone investors

    Research · 42 comments

    I spent the last few days in Hong Kong at a conference discussing the smartphone industry. The participants were mainly investors or investment managers. One of the most frequently asked questions was how to spot investable trends in this notoriously unpredictable sector.

    The data I presented did not offer much of an answer. If anything, it showed just how much the industry has changed and how unlikely it is to remain a facsimile of what it is today.

    But theory allows us to still make some bold claims. Grounding your investment thesis in pattern recognition rather than extrapolation should be the better strategy. So here are the telltale signs I recommend watching for investable ideas.

    1. In hardware look for what's not good enough. The smartphone is great. But it's not good enough for many jobs that we can recognize with little effort. For example, smart devices never seem to have enough battery life. Storage, screen quality and speed are pretty good, but battery life is worse than what voice phones offered years ago. Companies dedicated to improving battery technology or charging technology should be worthy of a bet. Breakthroughs in power saving will be much more valuable than breakthroughs in storage or processing speed or screens.
    2. Pricing needs innovation. Phone pricing is opaque, user unfriendly and often leaves buyers confused and angry. I use the word innovation instead of reduction because it's not about making prices necessarily lower, but removing complexity and defining value clearly through price. The challenge is not just for devices but for service providers as well. Companies innovating by abstracting pricing complexity will do very well. Interestingly, pricing innovation is not as easily copied as it may seem. It is often coupled with business model innovation and cost restructuring.
    3. Applications currently conform to platform needs but there will come a time when platforms will need to conform to application needs. By applications I mean not just apps but the app/service bundle that will drive consumer purchasing behavior. If we consider social media, entertainment and shopping as applications, it will make sense for those applications to eventually take some control or equity in the platforms. Android is the first sign of this: search and services associated with search and advertising sought control over platforms. Perhaps Facebook, Amazon and Baidu will feel a similar need.
    4. As a new medium, apps will eventually be more valuable than the tools used to render them. The global app brands are probably not yet born, but some day they will be as important as Disney, News Corp and Universal Pictures in their heyday. The App Store is the incubator for these embryonic megabrands.

    I realize that these are not specific enough investable ideas but casting your eye on patterns should yield better returns than selecting winners from a set of "current players".  After all the great returns from smartphones to date have come from bets on entrants (HTC, Apple, RIM) and not from incumbents (Nokia, Microsoft or Motorola).


  4. In memoriam: Microsoft's previous strategic mobile partners

    Research · 223 comments

    Microsoft's new "strategic partnership" with Nokia is not its first. For a decade the software company has courted and consummated relationships with a variety of companies in mobile and telecom. Here are the ones I can remember:

    • LG. In February 2009 Microsoft Corp. signed a multiyear agreement for Windows Mobile to be included on devices from LG Electronics Inc. LG would use Windows Mobile as its "primary platform" for smartphones and produce about 50 models running the software.

    What happened? LG made a few Windows Mobile devices but with WinMo uncompetitive, they abandoned the platform and moved to Android losing years of market presence and all their profits.

    • Motorola. In September 2003, Motorola  and Microsoft announced an alliance. "Starting with the introduction of the new Motorola MPx200 mobile phone with Microsoft Windows Mobile software, the companies will collaborate on a series of Smartphone and Pocket PC wireless devices designed to create a virtual "remote control" for the Web-centric, work-centric, always-on-the-go mobile professional." In addition, the alliance includes cooperation on joint marketing and wireless developer programs.

    What happened? Motorola launched a series of Windows Mobile phones culminating in the Motorola Q "Blackberry killer". As Motorola hit the rocks in profitability new management reached for the Android liferaft. The company now relies exclusively on the Droid franchise.

    • Palm. In September 2005 Palm and Microsoft announced a strategic alliance to "accelerate the Smartphone market segment with a new device for mobile professionals and businesses. Palm has licensed the Microsoft Windows Mobile operating system for an expanded line of Treo Smartphones, the first of which will be available on Verizon Wireless’ national wireless broadband network."

    What happened? Palm shipped a few Windows Mobile, famously dismissing Apple's potential entry as something "PC guys" could never achieve. A new CEO, a private placement and an acquisition later the company is a division of HP making its own operating system.

    • Nortel. When Steve Ballmer was famously laughing at the iPhone and saying that he likes the Windows Mobile strategy "a lot" he was sitting next to the then-CEO of Nortel (Mike Zafirovski formerly of Motorola) with whom the company had just closed a strategic deal.  "an alliance between Microsoft and Nortel announced in July 2006 ...  includes three new joint solutions to dramatically improve business communications by breaking down the barriers between voice, e-mail, instant messaging, multimedia conferencing and other forms of communication".

    What happened? Nortel declared bankruptcy two years later.

    • Verizon. In January 2009 "Verizon Wireless has selected Microsoft Corp. to provide portal, local and Internet search as well as mobile advertising services to customers on its devices. The five-year agreement will go into effect in the first half of 2009 when Microsoft Live Search is targeted to be available on new Verizon Wireless feature phones and smartphones." The deal would ensure Bing distribution to all of Verizon's smartphone customers.

    What happened? Bing did ship on some devices but in October 2009 Droid came to Verizon.

    • Ericsson. In September 2000, "Ericsson and Microsoft Corp. today launched Ericsson Microsoft Mobile Venture AB. This previously announced joint company will drive the mobile Internet by developing and marketing mobile e-mail solutions for operators. The first solutions are expected to be on the market by the end of the year. The company is part of a broader strategic alliance between Ericsson and Microsoft"

    What happened? Ericsson divested itself of the mobile division forming a joint venture which would go on and make more strategic alliances with Microsoft over Windows Mobile culminating in a loss of profits and eventual flight to Android.

    • Sendo. In February 2001, Microsoft announced a partnership, in which Microsoft bought $12m of Sendo shares and a seat on the board. Sendo was to be Microsoft's "go to market partner" for the Stinger smartphone platform that would become Smartphone 2002.

    What happened? Sendo after litigating IP issues with Microsoft went bankrupt in 2005.

    And finally,

    • Nokia. No, not this OS deal, but in August 2009 "The worldwide leader in software and the world’s largest smartphone manufacturer have entered into an alliance that is set to deliver a groundbreaking, enterprise-grade solution for mobile productivity. Today, Microsoft Business Division President Stephen Elop and Nokia’s Executive Vice President for Devices Kai Öistämö announced the agreement, outlining a shared vision for the future of mobile productivity. This is the first time that either company has embarked on an alliance of this scope and nature."

    The plan was to bring "Microsoft Office Mobile and Microsoft business communications, collaboration and device management software to Nokia’s Symbian devices."

    What happened? One and a half years later the same Stephen Elop announced that Symbian will be deprecated.

  5. Why Eric Schmidt had to go: Google's innovation dilemma

    Research · 48 comments

    Charles Arthur provides a convincing back-story to the Google exec re-shuffle.

    Google shuffle: why Eric Schmidt had to be pushed from the top | Technology | guardian.co.uk.

    There is evidence of execution failure and indecision or muddled messages to stakeholders. Shared leadership arrangements never end well.

    But in this forum I've been critical of their strategy. Though I'll be the first to admit that such criticism is not founded on data but on intuition, strategy is always made in a vacuum of data. It is just an unfortunate fact of life that we don't have data about the future.

    But what data we do have is about the past and it shows the contrast between Apple and Google.

    As a sample, let's look at the performance in the last quarter:

    [nohang]

    GrowthGoogleApple
    Revenue26%70%
    Earnings29%75%
    P/E24.1318.57

    [/nohang]
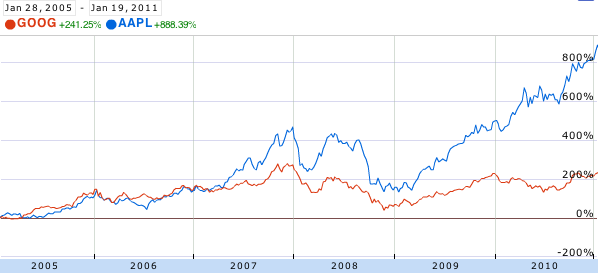
    Apple grew about 2.5x faster. The companies are in very different businesses, but the money they make is the same color. The investors have been paying attention:

    Source: Google Finance.

    In 2005 and 2006, Apple and Google were neck-and-neck in terms of returns to shareholders. However, with the iPhone's arrival in 2007 the stocks diverged. Google gained 38% since January 2007 while Apple gained 300%.

    However, going forward, the market is kinder to Google than to Apple, punishing Apple's 75% growth with a P/E of 18 (ex-cash 15) and rewarding Google's 29% growth with a P/E of 24 (22.5 ex-cash) . Although Google's P/E is proportionate relative to its growth, Apple's P/E implies deep pessimism.

    But does Google's performance suggest management failure? Certainly not. It's been a great performance. Google is arguably at the top of its game. Market share of search has never been better.

    Cracks in strategy are hard to spot. One hint is that most of Google's R&D efforts are defensive. Building browsers and mobile operating systems are methods to ensure they have distribution of search to as many screens as possible. These are expensive means to ensure channels are available for distribution. Expensive not only in terms of engineering costs but also in terms of relationships and opportunity costs.

    But even a defensive posture is not sufficient for management change.  What I think is the most serious failure is that for the past five years Google has not addressed the possibility of search itself becoming commoditized. Social media and app economies are asymmetric to search. They make money in different ways and appear to be less efficient or effective means to reach users, but they are growing. Facebook has overtaken Google in terms of page views and apps are a new interaction model for cloud-based content that does away with the indexing model Google champions.

    The real condemnation of the leadership at Google is that there has been a failure to create entirely new disruptions. As the stock chart above confirms, Android and Chrome are, if successful, sustaining technologies for Google. That's not going to be enough.

  6. Is Android more efficient than iOS at generating search revenue?

    Research · 63 comments

    Thanks to David Chu for forwarding the data that made this possible and reader Narajanan for spotting the divergence in platform efficiency.

    iOS and Android are both growing rapidly. According to Gartner, during the first three quarters of 2010, about 44 million iOS devices and 36 million Android devices were put into use. That's 80 million devices. An amazing achievement for two platforms that did not exist 3 years earlier.

    But obviously not all devices are used the same way. Devices which have unused capabilities limit network effects for a platform and for the category of product in general. Question is: how can we measure the "smartness" of a device; how much more likely is a device to be used as a mobile computer vs. being a regular phone?

    The best proxy I can think of is a measurement of browsing use. The smarter the device, the more browsing is a joy and the more it is actually done. Browsing leads to more data load on the network and creates a virtuous circle of revenues for the mobile computing value chain.

    If we could measure the increase in browsing generated by each additional phone, we could compare whether one platform is better (specifically, more efficient) at generating value asymmetric to voice.

    Fortunately we have data from Netmarketshare.com (see sources below) which attempts to track browser consumption and hence allows us to measure this variable. What we need to pair that with is the incremental increase in the installed base of devices.

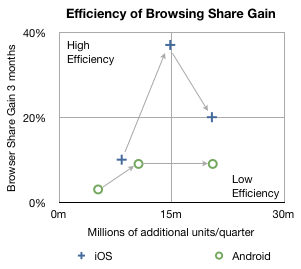
    In the chart below I plotted how much browsing share increased for every phone sold by platform over the first three quarters of 2010.

    The arrows indicate the sequence in time from Q1 to Q3. The vertical axis shows gain in share three months after the corresponding number of units shipped in the previous quarter on the horizontal axis. So, for example, the second circle means that in the second quarter approximately 10 million new Android devices created a gain of about 9% in browsing share. In the same quarter, 14.8 million iOS devices created about 37% gain in browsing share.

    In the third quarter approximately the same number of iOS and Android devices shipped (iOS  including iPads and iPod touch) but the browser gain was 20% for iOS vs. 9% for Android.

    A line drawn diagonally from lower left to upper right (0,0 to 30m,40%) could represent the average gain in share per units sold--the sort of measure we're looking for.

    Measuring that slope tells us that, on average, every million devices sold should generate a gain of 0.75% share[1]. I took the additional step of labeling two quadrants which are orthogonal to the expected trend. If browsing increases dramatically faster than 0.75%/million units then I call those devices sold as creating "highly efficient" browsing gain. If browsing increase lags dramatically below 0.75%/million units then those devices added share with "low efficiency".

    So four data points follow the trendline down the middle of the chart, however, there are two notable outliers. Finding the causes for these outliers gives clues to what's happening with the platforms.

    I believe the explanation for iOS's second quarter's extraordinary efficiency is that was the quarter when the iPad launched. It seems to have yielded a very strong spike and the trajectory of iOS improved even into the next quarter as those iPads continued to be in use. iPad seems to be a very effective way to gain browser share.

    I also believe that the cause for Android's fall in efficiency in the third quarter was that it began to be sold in large quantities in the developing world. The third quarter saw a rapid acceleration of sales without a proportional increase in what was measured as sales in the US (and Europe).

    Interpretation

    If this trend continues, and there is no guarantee that it will, then a question could be raised about Android's value to, of all people, Google.

    The core value of Android to Google is the increased use of browsing and hence search. All the other Google services and in-app ads are tiny opportunities in comparison to the potential of search on mobiles. One could argue that the raison d'être for Android since day one was to create browsing consumption. In that regard it's not as good at doing that as iOS is.

    Perhaps Google can justify the under-performance of consumption of browsing (and hence search) on Android devices as benign since there is no marginal cost added to supplying Android to non-consuming devices.

    But I wonder. There is the problem of opportunity cost: Those iOS devices that create more browsing activity are going to take more share. The more they do that the more Google will have to pay Apple for placement as the default search in mobile Safari.

    It may be a stretch, and perhaps the data is wrong, but that's what this exercise is all about: how much can we learn from fragmentary data? Without a hypothesis there is no discovery.

    -----

    Notes:

    1. Since these platforms have very low shares (less than 2% for iOS and 0.3% for Android by November) almost all the gains can be assumed to be against other browsers (e.g. Internet Explorer) and not against each other.
    2. Update: the original Unit estimates excluded iPad and iPod touch which have since been added.

    Sources:

  7. Stats update: Asymco reaches one million pageviews

    Research · 16 comments

    I began writing in February of 2010 but I moved to my own domain in June. More than 95% of my traffic came after June 1st (during which time 284 articles were written.)

    Since then 270,036 visitors came to visit 592,351 times and saw 1,063,355 pages. 65,331  stopped by more than once. 337,270 of the visits came because someone told them about Asymco. 27,113 visits came because a search engine sent them. 1,548 of those who came had something to say and they said 5,273 things. Over 2,500 asked to keep in touch.

    Here is the less lyrical breakdown of that traffic as reported by Google Analytics:

    1,063,355 Pageviews

    270,036 Unique Visitors

    • 269,167 New Visitors
    • 65,331 Returning Visitor

    592,351 visits

    • 337,270 from referring Sites (56.94%)
    • 227,277 direct traffic (38.37%)
    • 27,113 from search Engines (4.58%)

    Views by operating system (top ten of 25):

    1. Macintosh 433,624
    2. Windows 271,938
    3. iPhone 201,940
    4. iPad 102,870
    5. Linux 19,898
    6. iPod 14,033
    7. Android 12,191
    8. (not set) 3,954
    9. SymbianOS 1,399
    10. BlackBerry 1,196

    5,273 comments from 1,548 readers

    1042 Twitter followers

    248 Facebook "Like"

    Approximately 1000 active RSS feeds

  8. Did Google Arm Its Own Enemies With Android?

    Research · 42 comments

    James Allworth, a Fellow at the Forum for Growth and Innovation at Harvard Business School writes:

    Baidu,... has taken an even bolder approach. It's reportedly in negotiations with a number of smartphone manufacturers to remove all references to Google, and replace them with Baidu.

    ... Microsoft recently negotiated with Verizon that some of the Android phones that ship to Verizon customers will have Microsoft's Bing, not Google, as the default search engine. And the manufacturers are getting in on the act too: Motorola recently released a new phone, the Citrus, based on Android, but shipping with Bing.

    Yes, it's Google's operating system. In both these instances, it counts as a "win" in the handset volume war against Apple, Microsoft, Nokia and RIM. But Google will not make a cent on this handset, despite having enabled its creation with Android. All the search revenue will flow to Microsoft.

    via Did Google Arm Its Own Enemies With Android? - James Allworth - The Conversation - Harvard Business Review.

    Readers of this blog might find these arguments familiar.

    Since February this year, I wrote four articles under the headline "Google vs. Android" documenting these contradictions in Google's strategy. There have been numerous other opinion pieces that described how Google's approach was not consistent with an innovation-based disruption.

    I've also argued that there is strategic incoherence in building systems software and hardware while selling web services.

    Android is powerful, but as Google is finding out, power can be very dangerous without control.

  9. Is Android share of Web lagging iOS share of Web?

    Research · 12 comments

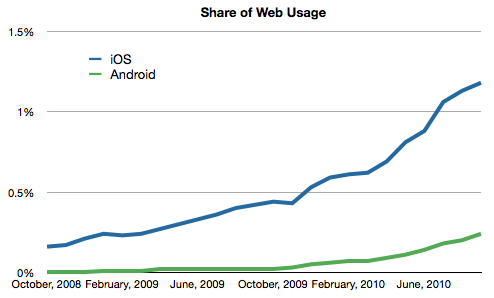
    Of all the public statistics about platform share, Share of web use must be the most important measure for Google. The more browsing people do, the more searching they do and if Google search is most likely for a platform then the more income Google derives from that platform.

    NetMarketshare.com has offered an insight into the split between Android and iOS as search platforms and it shows how iOS is still five times more likely to yield search revenue than Android. That multiple is likely to shrink as the gap narrows, but it still demonstrates the power of iOS to drive Google's bottom line. It's no wonder then why Google has renewed their default placement of Google search in mobile Safari (a guarantee they don't seem to share with all Android licensees.)

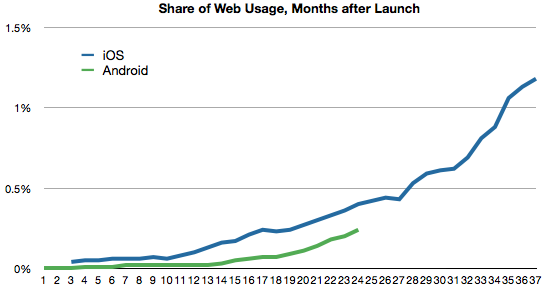
    But Android launched later than iPhone, so everyone should be asking how rapidly the share of Web has grown since the start of each platform. When iPhone launched in 2007 it was almost competing with mobile web non-consumption. The alternative mobile browsing experiences were so bad that it's hard to remember anyone putting up with them. A year later, the bar was set higher and Android filled a vast chasm of demand for mobile browsing for people who could not buy an iPhone.

    At the same point in the life of each platform, Android seems to be exploding in units sold. With this proliferation of Android licenses, it should be interesting to see if their unit share numbers are reflected in web share numbers. So far the story is not convincing. The growth in Web share is not pacing faster than iOS achieved at a similar point in time.

    So far, 24 months into the life of each platform, iOS leads by almost 50% higher share.

    iOS/mobile Safari has the advantage of iPod and iPad for distribution but that does not explain the relative lag of Android with respect to Web share as Android has a large number of SKUs.

    It may be too early to draw conclusions, but anyone trying to analyze Google's strategy with Android should be paying close attention to this.

  10. Is Google's income from the iPhone offsetting its losses from Android: Cataloging Google's non-Google Phones

    Research · 27 comments

    Google has created a partial list of phones that run Google services.

    Google Phone Gallery.

    I notice with interest that it's called a Google Phone Gallery not an Android Phone Gallery.

    What's more, there is a distinction of All Phones and Phones "with Google". Of course that implies that we can get a list of Google Phones "without Google" (or maybe more accurately, "with partial Google").

    To clarify, according to Google there are three categories of Android Phones:

    • Google Phones "with Google" have been optimized for use of Google Mobile Services, providing easy access to Search, Voice Search, Google Talk, Google Maps, Gmail, Sync, YouTube and Android Market (where available).
    • Google Phones "without Google" list includes Android phones that have the Android market, Search, Maps and Gmail. You can get this list by subtracting the Google Phones "with Google" from all the Google Phones.
    • Non-Google phones. Android phones that have no Android market or any Google services. You can get this list by taking a list of all Android phones (e.g. from pdadb.net) and subtracting all Google Phones.

    I would also add a fourth category of Google phones:

    • Non-Android phones that serve up Google services just fine.

    Since the list is not complete, I won't tally it here, but it suggests a large number of Non-Google phones is possible.

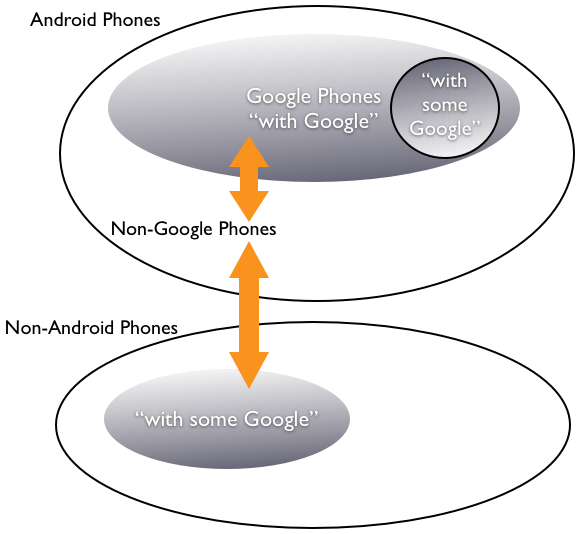
    [I drew the following Venn diagram to help explain the situation. The shaded areas are those which generate revenue for Google. The interesting struggle (marked with arrows) is between the non-Android Phones with some Google and the Android Phones without any Google.]

    Now the question that needs to be asked is: How many of the Non-Google Android phones are built to compete with Google (e.g. on Search, Voice, Maps, Media and App sales)? And a second question: How are the Non-Android phones "with some Google" competing with the Non-Google Android phones.

    In other words, from Google's point of view: how successful are companies other than Google at delivering Google services in spite of competition from companies with Android phones delivering services that compete with Google?

    The classic example being: how effective are iPhones with Google services at competing with Verizon Droid Android phones that deliver Microsoft services? In this scenario Apple is delivering value to Google shareholders while Verizon (using Android) is taking it away.

    Is this trade-off a net positive?

    In other words, is Google's income from the iPhone offsetting its losses from Android?