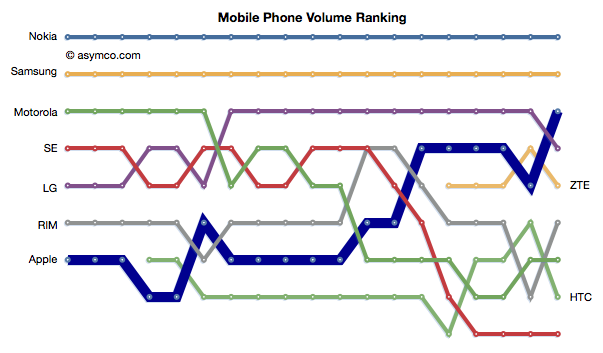
Apple reached the third place rank in total units shipped during last quarter. The following chart shows the ascent in rank.
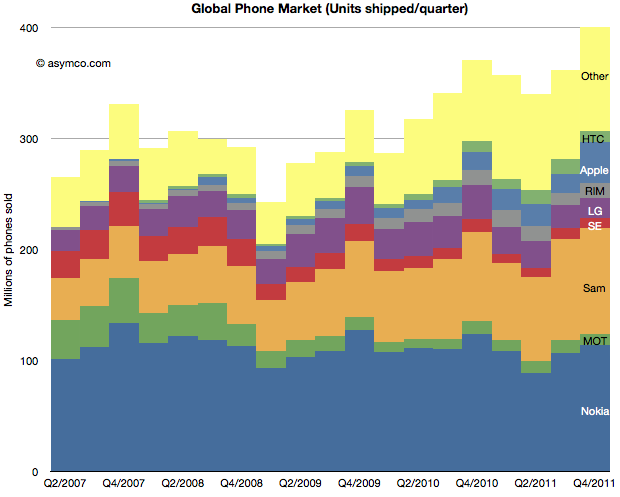
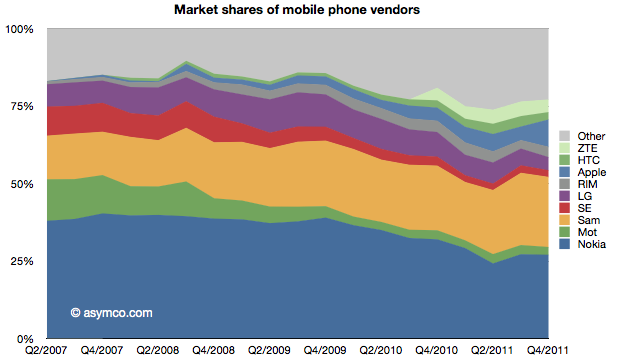
Apple achieved this with a total market share of about 9%. Second place Samsung has 22.6% so there is significantly more room to go before Apple gets to be second. Nevertheless, the climb to third was achieved in less than five years. At the time when Apple entered the market third place was held by Motorola with shipments of 35.5 million units (Q2 2007). Motorola only managed 10.5 million in the last quarter.
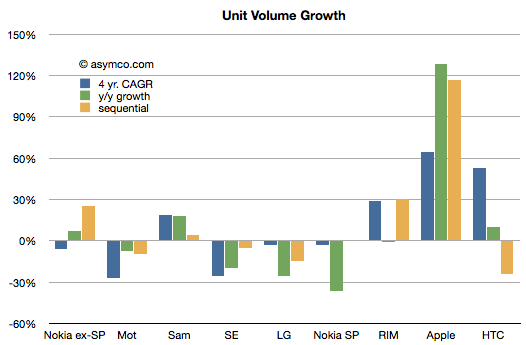
To see growth I prepared the following chart showing the fourth quarter's growth by vendor according to four years' compounded, sequential and y/y growth.[1]
On a four year compounded basis, the pattern is that of Apple, HTC and RIM showing significant growth with Samsung showing moderate growth. The other vendors all had negative real volume growth. The list does not include "Others" which had 13% compounded growth.
Projecting Apple's 60% rate of growth and a market growth of 10% leads to Apple obtaining 27% share by the end of 2014. My guess would be that is when we'll be able to write a post about Apple being second.
---
Notes:
I don't have HTC data for Q4 2007 so the compounded rate is measured for three years.
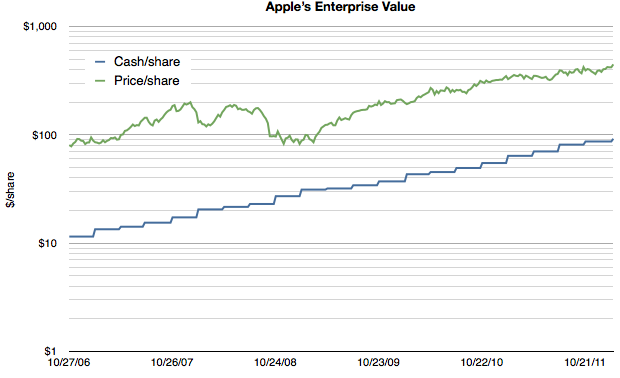
As Apple's extraordinarily low valuation is being more widely noted, explanatory hypotheses are proliferating. Everyone seems to have an opinion. Some explanations come in and out of fashion. Others are reliable old clichés. We've seen liquidity issues with large funds forced to sell, "too much cash", management transitions, an impending loss of mojo, share price too high to afford, "law of large numbers", and that old chestnut, competition. None of these satisfy. They don't explain why reliable growth is not valuable. And reliability is indeed what Apple offers in spades. Consider the following chart:
Note that the scale is logarithmic so that the growth patterns can be seen clearly.
It shows Apple's cash/share vs its price per share. First, it should be noted that the company's cash has been growing reliably on a log scale, increasing by a factor of 10 in five years. As a proxy for retained earnings, the cash trajectory shows exceptionally predictable earnings.
Second, although the share price has grown it has not grown either as reliably or as quickly. It's as if the reward for reliable earnings is a significant dissent.
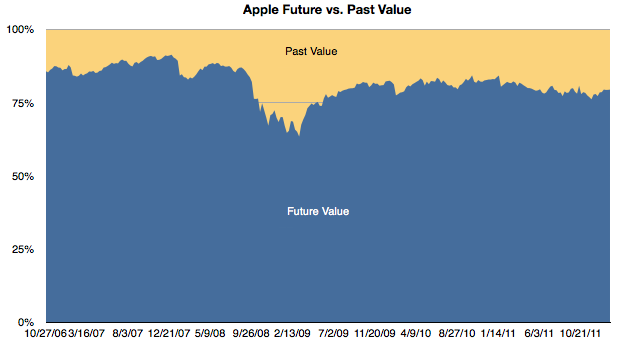
Third, if we subtract the cash/share from the price/share we obtain the enterprise value (EV) per share. The EV reflects the future value built into the price. It reflects the expectation of more earnings. In the chart above one can see the shrinking of the gap as a multiple of the cash value. To bring that gap into focus, I prepared this chart showing the percent of the share price allocated to past value (cash) and future value (EV).
One can see the gradual erosion of emphasis of future value. With the exception of the credit crisis induced equities crash, future value as a percent of total value is at a new low. In late 2006 the future was was about 86% of the share price. At the end of last week it had dropped to 79%.
Another way to interpret this is that in 2007 when the iPhone was born nearly 90% of the business value was thought to be in its future. Today only 80% is future value.
To clarify further, if a company reaches a price where 100% of its value is cash then it's seen as having no future value. Having any significant portion of the price attached to the past is extremely rare for a growing company and I would say unheard of in a company growing as rapidly as Apple is.
This preoccupation with the past and discomfort with the future is, I believe, the key to understanding the valuation paradox for Apple. I have gone over the conventional metrics of P/E and P/E/G(trailing) that illustrate absurd pricing (updated below). But they don't help explain the mis-pricing.
A disruptive company is inherently unpredictable. Success and growth are unrewarded because there no understanding of the underlying causes of these phenomena and therefore there is no expectation of repetition.
In other words, a five year dead-straight line of logarithmic growth is not a sign of anything resembling reliability if the underlying causes are not understood. Today Apple is still a mystery wrapped in an enigma and without a causal understanding of its suceess its pricing will remain paradoxical.
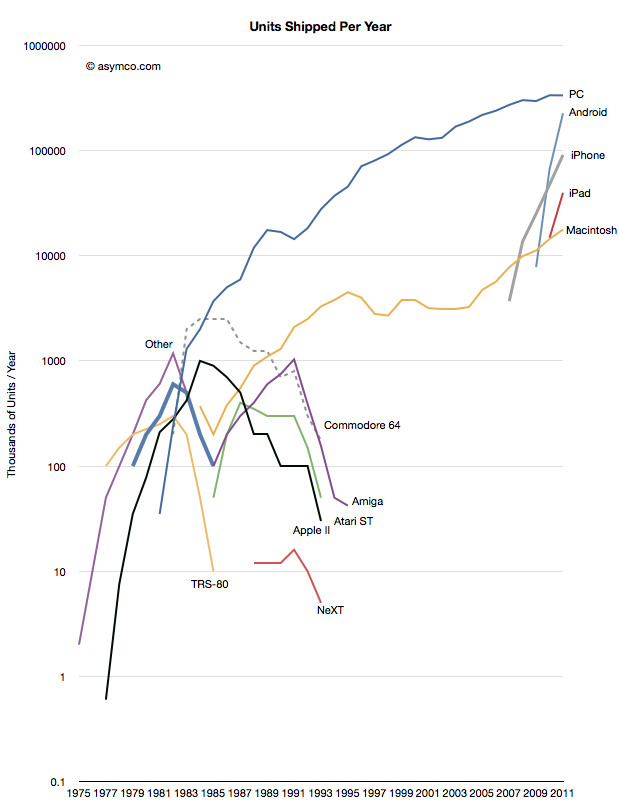
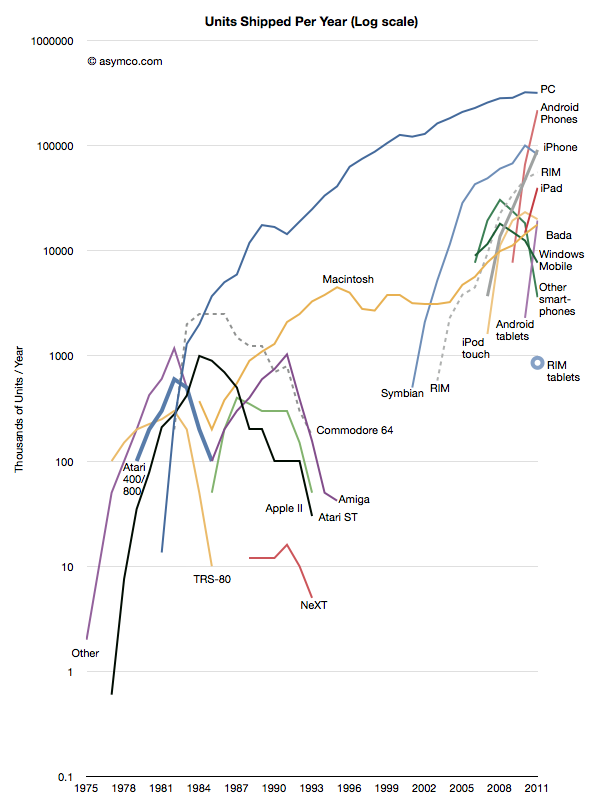
Thanks to Jeremy Reimer I was able to create the following view into the history of computer platforms.
I added data from the smartphone industry, Apple and updated the PC industry figures with those from Gartner. Note the log scale.
The same information is available as an animation in the following video (Music by Nora Tagle):
httpv://www.youtube.com/watch?v=8h-C6u4yLj4
This data combines several "categories" of products and is not complete in that not all mobile phone platforms are represented. However, the zooming out offers several possible observations into the state of the "personal computing" world as of today.
We cannot consider the iPad as a "niche". The absolute volume of units sold after less than two years is enough to place it within an order of magnitude of all PCs sold. We can also observe that it has a higher trajectory than the iPhone which became a disruptive force in itself. Compare these challengers to NeXT in 1991.
The "entrants" into personal computing, the iPad, iPhone and Android, have a combined volume that is higher than the PCs sold in the same period (358 million estimated iOS+Android vs. 336 million PCs excluding Macs in 2011.) The growth rate and the scale itself combine to make the entrants impossible to ignore.
There is a distinct grouping of platform options into three phases or eras. The first lasting from 1975 to 1991 was an era of rapid growth but also of multiple standards and experiments. It was typical of an industry in emergence. The personalization of computing brought about a new set of entrants. The second phase lasted between 1991 and 2007 and was characterized by a near monopoly of Microsoft, but, crucially one alternative platform did survive. The third phase can be seen as starting five years ago with the emergence of the iPhone and its derivatives. It has similarities to the first phase.
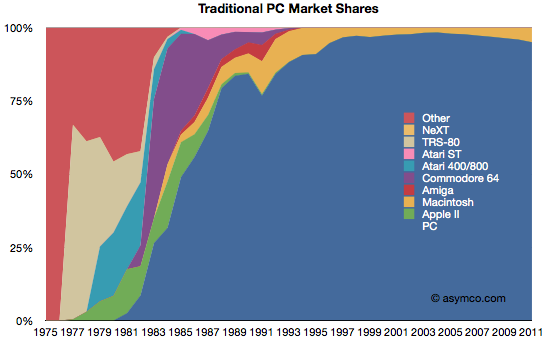
We can also look at the data through a slightly different view: market share. Share is a bit more subjective because we need to combine products in ways that are considered comparable (or competing).
First, this is a "traditionalist" view of the PC market as defined by Gartner and IDC, and excluding tablets and smartphones.
This view would imply that the PC market is not changing in any substantial way. Although the Mac platform is gaining share, there is no significant erosion in the power of the incumbent.
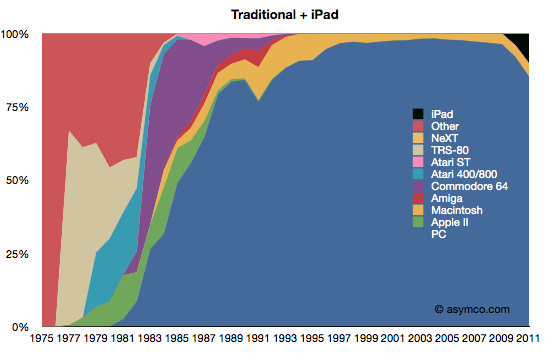
Second, is a view where the iPad is added to the traditionalist view.
This view is more alarming. Given the first chart, in order for the iPad to be significant, it would need to be "visible" for a market that already ships over 350 million units. And there it is. If counted, the iPad begins to show the first disruption in the status quo since 1991.
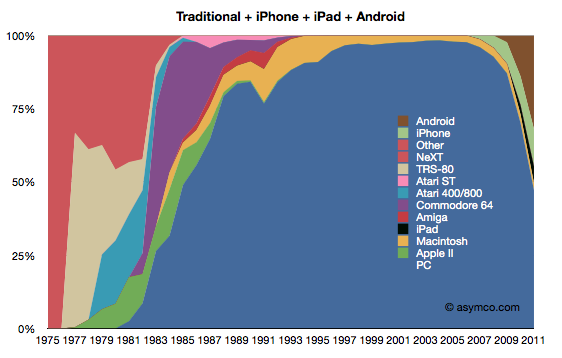
The third view is with the addition of iPhone and Android.
This last view corresponds to the data in the first graph (line chart). If iOS and Android are added as potential substitutions for personal computing, the share of PCs suddenly collapses to less than 50%. It also suggests much more collapse to come.
I will concede that this last view is extremist. It does not reflect a competition that exists in real life. However, I put this data together to show a historic pattern. Sometimes extremism is a better point of view than conservatism. Ignoring this view is very harmful as these not-good-enough computers will surely get better. A competitor that has no strategy to deal with this shift is likely to suffer the fate of those companies in the left side of the chart. Treating the first share chart as reality is surely much more dangerous than contemplating the third.
I've used anecdotes in the past to tell the story of the disruptive shift in the fortunes of computing incumbents and entrants. I've also shown how the entry of smart devices has disrupted the telecom world and caused a transfer of wealth away from the old guard.
The data shown here frames these anecdotes. The data is not the whole story but it solidifies what should be an intuition.
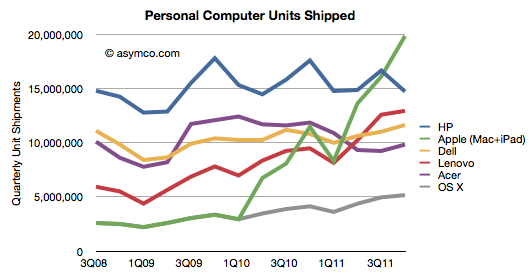
However, according to Gartner, HP shipped 14.7 million PCs in the last quarter. While we don't have the total global figure for Apple, my estimates are 5.2 million Macs and 14.7 million iPads, for a total of 19.9 million computers in the same period.
There might be an error in both Gartner's and my numbers, but the gap of over five million in Apple's favor is unlikely to disappear.
The history of shipments from these vendors is shown below.
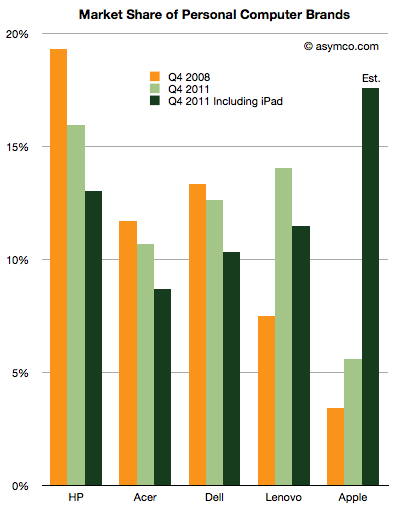
The market shares are also shown here:
I included the market shares thee years ago, and the rankings with the iPad excluded.[1] Apple went from 3.42% share at the end of 2008 to 5.6% share today excluding the iPad or 17.6% including the iPad. HP went from 19.3% in 2008 to 16% today or 13% if iPad is included.
Apple is ahead of schedule on their taking[2] the top spot in terms of units.
Notes:
Although vendors other than Apple also sell tablets, their totals are unpublished and I am not aware of any estimates so. If anyone has seen estimates I would be happy to amend the data.
Throughout the history of the industry, Apple never held the top spot. The Apple II peaked at 15.8% in 1984 and the Mac at 12% in 1992.
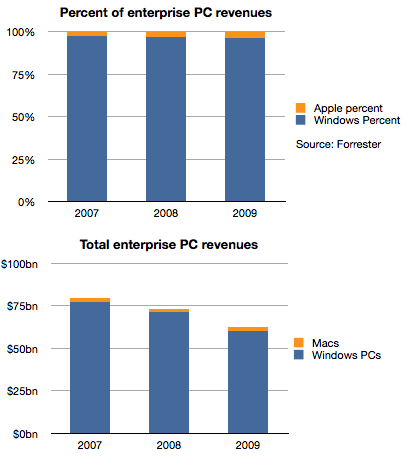
Historically, Apple's sales to business and government buyers of personal computers have been, in a word, minuscule. To put a number on it, Forrester published data where the estimated value of those sales in 2007 were 2.8%. A figure lower than Apple's overall market share of PCs in that time frame.
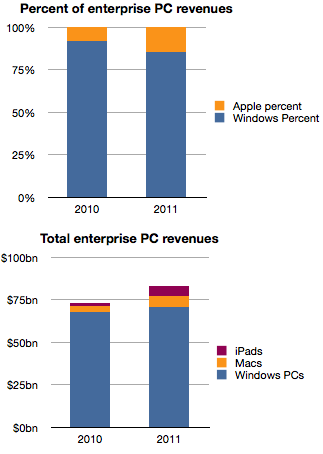
Things did not improve much in the years following. The following chart shows the split between Windows and Mac OS X for the value of enterprise computers sold in 2007 through 2009.
Apple's share of value went from 2.8% to 3.7%, an increase of 1 point of share, but one which in real terms was not very valuable because the overall market declined due to recession. Revenues for Apple were basically flat at around $2 billion each year as shown in the second chart.
However, the situation changed very rapidly in the last two years.
Apple's share of enterprise revenues doubled from 3.7% to 7.8% in 2010 and nearly doubled again to 14.6% last year. A large part of that acceleration was due to the iPad which generated an estimated 6 billion in sales in 2011, triple what Macs were grossing in 2007.
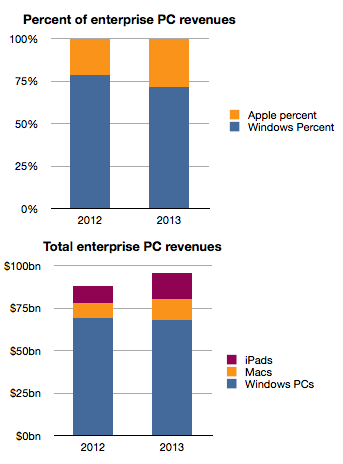
Forrester goes further and estimates the same data for the next two years.
The estimate seems to be an extrapolation of the last two years which may or may not happen and we should treat it with caution.
However, if the pattern emerges as an extension of the near past, Apple's position in the market at nearly 30% share next year would be a sea change. It may challenge for the top spot among all vendors to the sector.
It's been said many times that "if only Apple put more emphasis" on Enterprise sales, imagine how much more growth they would obtain. However, I believe that this reversal of fortune did not come about from paying more attention but rather from paying less attention to Enterprise.
Enterprise buyers are demanding customers. They have highly specific requirements and ask vendors to conform to multiple layers of dependencies. As a result, enterprise vendors (led by Microsoft) have done all they could to make their software and hardware conformable to these needs. For decades this was the modus operandi and, due to the early adopter nature of businesses in personal computing, the resulting product was passed on to consumers as the "standard". Consumers accepted it as it was better than having no computers at all.
The problem is that customers, especially demanding ones, don't realize that a new basis of performance might be more beneficial. Apple and mobile devices in general presented this "low-end" alternative not in response to requirements from business but in response to requirements from consumers who had been much more eager in the last decade to adopt new technologies with fewer strings attached. All the security, conformability and legacy issues of the early business adopters turned them into late adopters as technology shifted.
So a company focused on an asymmetric market led with new solutions to problems that enterprises did not think they had. Mobility was something few IT managers asked for and was granted begrudgingly to only those "most valuable" who needed it due to cost and security considerations. As Apple willfully ignored these Enterprise needs it, paradoxically, created exactly what they needed.
It pried entry into the most difficult of markets by not even wanting to enter.
In thinking about how this market will evolve, I hear about "consumerization" and cost reduction as benefits and justification of this shift. But fundamentally, what is happening is a classic low end disruption. Enterprises increased their demands beyond what the users in those enterprises could absorb. Instead of ultra-secure, locked-down and immobile computing, users were looking for flexibility, agility and mobility. That's what Apple was listening to.
Apple's best strategy today would be to persist on this trajectory and listen to the under-served consumer rather than the over-served and over-demanding IT manager.
Data on Q4 performance is starting to trickle in. Last week Motorola, as part of a profit warning, revealed their Q4 smartphone shipments were 5.3 million. RIM had reported 14.1 million units (quarter ending November). HTC has also warned that their shipments of smartphones (and tablets) totaled 10 million. Samsung provided guidance on overall sales but since they don't report data on smartphone (or phone) sales, the estimates are ranging between 32 and 35 million.
Many have forecast Apple's performance but there are many other companies which are not easily estimated (Sony Ericsson, LG, Nokia, ZTE, Others.) But rather than dwelling on the specific quarter, we can make some long-range estimates of performance based on the historic data.
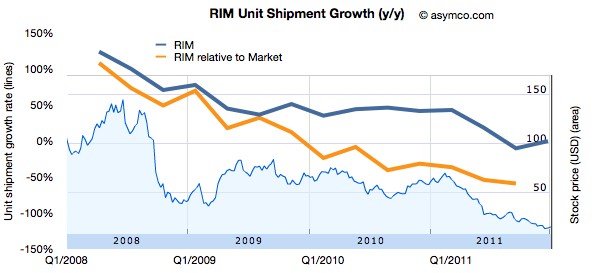
One method I use is to look at patterns of growth. Growth is the first derivative of market performance and it sometimes shows patterns which the performance itself does not. Consider the following chart showing the growth pattern for RIM.
The blue line shows the absolute year-on-year quarterly growth based on reported numbers of smartphones shipped. I've also shown the growth "relative to market" which is unit growth with market growth subtracted. This orange line represents how much faster (or slower) the company is growing relative to the market. If the orange line is above zero, the company gained share. If it's below zero, it lost share.
I also overlaid the performance of the share price (right scale).
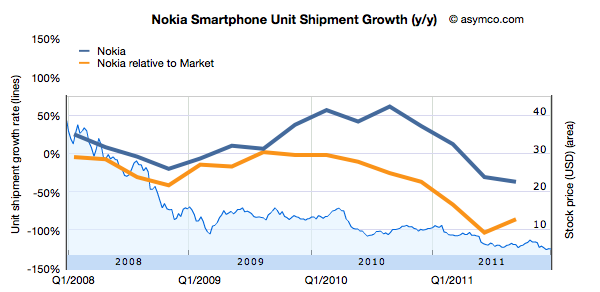
Now compare that with another long-term incumbent in the smartphone market, Nokia.
Bearing in mind that the scales are identical, Nokia's relative performance has been negative since early 2008. Persistent negative smartphone performance relative to market growth causes persistent loss in share price.
What about other, more recent competitors?
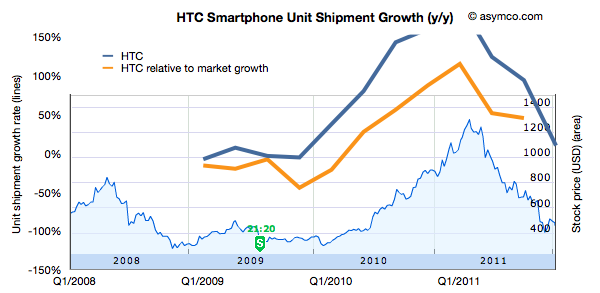
HTC is not a recent entrant in smartphones, and has gone through a phase of growth with Windows Mobile in the 2000's. This is its pattern of growth (and its share price).
Keeping the scale for growth consistent with the other companies leads to a bit of clipping but the pattern of rise and fall also seems correlated to share price performance.
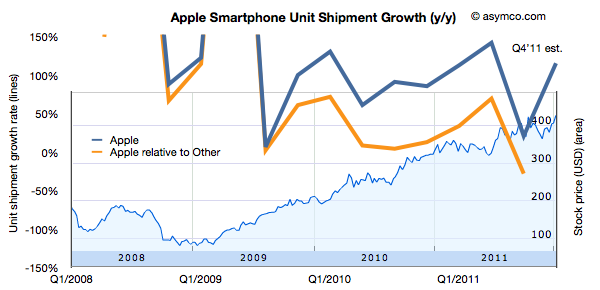
Finally, the following is the same analysis applied Apple.
Again, keeping the growth scale consistent leads to some clipping, but the pattern remains observable.
What seems to be rewarded to various degrees is consistency in growth of smartphones for companies which are primarily engaged in the market. However, failure to grow is punished with severe share price declines.
Being able to forecast smartphone growth seems to be useful, at least in the time frame of one or two years.
When asked where Apple's growth will come from, most analysts or observers will cite new products. As long as there are new products, then there is growth. Conversely, if there are no new products, then there will be no growth. This is such a commonly held belief that it's axiomatic: Apple is being valued based on short-term foreseeable growth.
To be more precise, analysts value the wave of growth of every new product and heavily discount the post-growth phase assuming commoditization. There is no value assigned to Apple for extending market reach to the mass market.
Consider: Analysts currently forecast an operating income (or EBIT) of $43.3bn for 2012 and $49.7bn for 2013. That implies growth of 28% in 2012 and 15% in 2013. These growth rates are modest in light of Apple's recent historic growth and especially 84% in 2011 on EBIT level. Much of this growth has been due to iPhone which quickly captured 4% market share in four years. To suggest 15% growth in 2013 is to suggest that Apple will not increase its phone market share by an appreciable amount. The implicit assumption in that growth figure alone is that Apple will remain a niche player.
Bear in mind that 15% growth is so low as to be half the the growth in the Mac business and below the likely growth in the overall phone market. Considering the risk premium on equities, this growth forecast assumes essentially a no growth scenario. But even with no growth, Apple's cash flows are huge and thus they should add up to some significant present value. Since we know the value as reflected in the current price, we can work backwards to determine the discount rate being applied to those future flows. In other words, we can calculate how risky Apple's existing product cash flows are seen to be.
Based on assumptions originating from analysts' consensus, we can construct a simple model that will approximate the discount the stock market puts on Apple's future cash flows. Let's have a look at an adjusted Gordon or dividend discount valuation model on EBIT basis:
Shares are valued based on the projected future cash flows of a company. Discounting EBIT with Weighted Average Cost of Capital and subtracting growth will yield enterprise value (= market capitalization - cash).
Applying analysts’ assumption of close to zero growth to Apple's post 2012 EBIT means EBIT stays constant for 2013 and beyond. Let’s solve for the implied capital costs. Right away we can eliminate growth (g) as it equals zero. EBIT reflects operating cash flow since in a zero growth scenario CapEx will equal deprecation and there are no changes in net working capital. As Apple has no debt but a cash surplus, WACC will be equal to cost of equity[1].
Solving for capital cost (WACC) with available analysts' EBIT estimates reveals a discount rate of 15%.
But let’s remember that analysts have consistently and by a large margin missed Apple's financial performance. So let’s dial in a more aggressive estimate of around $56bn of EBIT for the fiscal year 2012. The discount rate goes up to 19% and implies an EBIT multiple of 5.3x.
In other words, Apple's cash flows for a zero growth scenario are being discounted at a rate of 15% to 19%. This places the company in an extremely risky category of investment. It is certainly not something that can be categorized as a value stock.
The discussions on this blog regarding Apple’s valuation have been insightful, but only danced around the triangle of price, earnings and growth. When the growth forecasts are considered vis-a-vis current pricing, the assumptions built into 'consensus' forecasts for Apple are condemnations of the company.
They present a view of a company that is extremely vulnerable and can neither preserve its current cash flows nor find new sources of growth. It is, quite plainly, a company doomed to commoditization.
---
Notes:
Or one can even assume that cash has a positive effect lowering costs of equity (less indirect bankruptcy costs).
Here are the highlights from RIM's latest quarter:
14.1 million BlackBerry smartphones shipped, 13 million sold through
150k PlayBook shipped with sell-through slightly higher. 800k PlayBooks shipped so far.
BlackBerry subscriber base up to 75 million
High growth cited for U.K., France, South Africa, Mexico and Argentina, Indonesia, Saudi Arabia and South Africa. RIM is the #1 smartphone vendor in the Latin America and Caribbean region. Sales outside the US, UK and Canada were 61% of revenues. US is now 20% of sales, UK 11%.
Hardware growth outside the US was 56%
There are 630 carriers
50k apps in App World with 5 million downloads per day
Forecasting 11 to 12 million smartphones next quarter
Given the channel fill with a new product, the device business was marginal at best. The company obtained -1% growth y/y in units but 31% sequential growth from a transitional quarter. The average selling price (inclusive of service revenues) is $354 and about $280 excluding service revenues. I estimate that operating margins have dropped to about 11%. Not a good story, but one we have been warned to expect.
But a crucial new twist to the story is that RIM announced that they don't expect new BlackBerry 10 devices until late next year. That came as a surprise and the stock sold off significantly, valuing the company at well below book value.
Stepping back, the biggest surprise is that the company seems to have had no plan for sustaining itself.
Let me explain.
If you go back to 2005 or so the world of smartphones was a mix of modular OSs and integrated platforms, much as it is today. Not unlike Android today, Windows Mobile was successful in licensing to dozens of vendors who in turn released hundreds of products. Symbian also was licensed but most volumes came from Nokia and they held the lion's share. Then there was the BlackBerry integrated solution which worked smoothly and had devoted fans who upgraded every chance they had and operators who were joyous at the new ARPU. There was also PalmOS as offered by PalmSource trying to be a "third horse" and unseat stodgy old Microsoft.
It was into that fray that both Apple and Google jumped. Google acquired Android in 2005 and Apple was busy polishing a version of OS X that would became iOS. In three and two years respectively these platforms would be in the market.
Regardless of the actions of rivals, all competitors must have faced the same questions in 2005: As technology was changing rapidly and as they all had access to component roadmaps, what is the best technology approach to this market? Should they embrace certain innovations to sustain their business trajectory? RIM had a tightly integrated software, hardware and service offering. What could make it better? Nokia was also basing its products on a more loosely integrated offering (nominally it was modular, but only just). It saw the writing on the wall and began developing a Linux variant (Maemo) as a potential candidate to replace Symbian. Microsoft was basing its solution of a modular approach. Windows CE was ok as a kernel but they had layers on top which were optimized around stylus-based user experiences (analogous to mouse actions). Could it take on a rich computing experience?
There were many experience candidates. Stylus, keypad, keyboard all had adherents. There was a lot of hesitation. After the iPhone launched with capacitive (finger) touch, resetting user expectations, it still took a year for many of the vendors to re-consider their technology plans. The weakest changed first.
Microsoft felt the pain quickest. They also had the least to lose since revenues from Windows Mobile were paltry. By 2008 internally they turned 90 degrees. They embarked on re-building their user experience and orphaning the Windows Mobile ecosystem and many of the vendor relationships they had built. Palm dropped PalmOS and built WebOS internally quite quickly. They licensed Windows Mobile as a stop-gap. Around the same time Nokia doubled down on Maemo and joined with Intel to form MeeGo. They did not orphan Symbian though and kept trying to adapt it to the new experiences and input methods.
But RIM did nothing. Almost nothing. They were the healthiest competitor. They felt no pain from iPhone's entry. The platform they had built was still growing and they were tweaking it constantly. There were always improvements to point to but fundamentally the code was limited. It was very difficult to adapt it to touch input and the first attempts at a touch UI were embarrassing. But there were no signs of a new platform that reflected the Unix-like competition.
As I pointed out in an earlier post, Unix-like operating systems were having their revenge. To a computer scientist the future of mobile computing would mirror that of personal computing in terms of architecture. The foundations of the early smartphones were built on constraints that were disappearing while being unable to accommodate new input methods. In other words, the early efforts were optimized around those constraints and sub-optimal for rich user experiences. They had to be. There were limited processors, memories and screens and battery life.
It turned out that all the early mobile operating systems were unsuitable for the advances in technology that came after 2007. Companies which were able to adapt or embrace Unix-like operating systems in a mobile context gained the ability to grow with the new input methods. The sooner they "pulled the trigger" on the shift, the better off they were. This is in fact what enabled entrants to gain footholds. Entrants entered with Unix-like OSs straight away while incumbents had to justify changing and the more successful they were the harder it was to justify changing.
RIM had trouble justifying this change. It waited until 2010 to finally acquire the QNX asset that would offer them a stronger software foundation. It still had to adapt this acquisition and it looks like it won't be done until at least 2012, seven years after they should have started. And this should be seen as a sustaining technological change. A new OS is not a disruptive technology to what is already a mobile computer.
However, delays like these can be fatal. We see the impact on Microsoft who was earliest to push the reset button in 2008. It still took two years to rebuild Windows Mobile into Windows Phone and is now still struggling to regain lost share (less than 2% today). We see the impact on Nokia which was unable to affect a transition to MeeGo due to a litany of issues and had to throw in the towel on self-determination. We see the impact on Palm which lost its independence as WebOS was a bit too little too late.
These companies had the right technical strategies but suffered from execution and business architecture issues. RIM is years late in embracing what appears to be a sustaining improvement.
But whenever you see what appears to be a coordinated effort by companies to fail simultaneously you have to ask if the change they struggle with is really sustaining or disruptive. The pattern makes me suspicious that what RIM, Microsoft, Palm and Nokia faced was more than a failure to embrace a sustaining improvement. I suspect that the failure is evidence of tectonic shifting of business models.
Imagine it's late 2005. Apple's fiscal year just ended and they reported their performance. You're an analyst whose job includes forecasting the company's performance for next year. This is a weighty responsibility. Your forecast will be blended with those of your peers and used as a "consensus" average. That consensus for the next year will be used to measure the current value of the shares in a ratio called the forward PEG or Price/Earnings/annual earnings Growth. You are supplying the earnings and hence growth forecast while the market offers a price. As a stock is meant to measure future earnings, your forecast is a crucial and frequently cited figure about whether a stock is priced fairly.
There is some comfort in knowing that there will be many others who will offer such a forecast and your contribution is thus not the only way investors can calibrate the price. However, you should think hard about what you are predicting as it also will reflect your skill in predicting such a visible company.
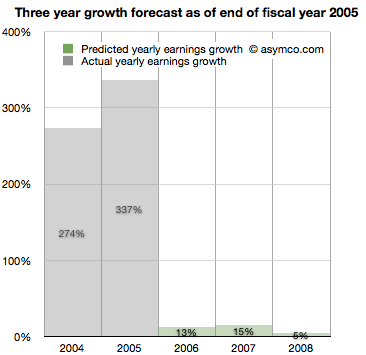
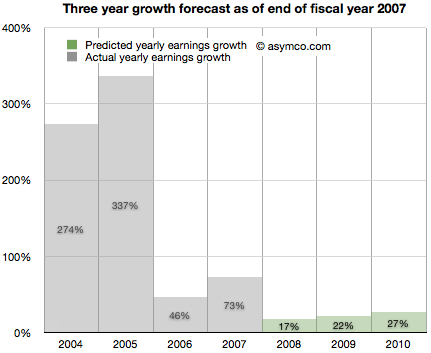
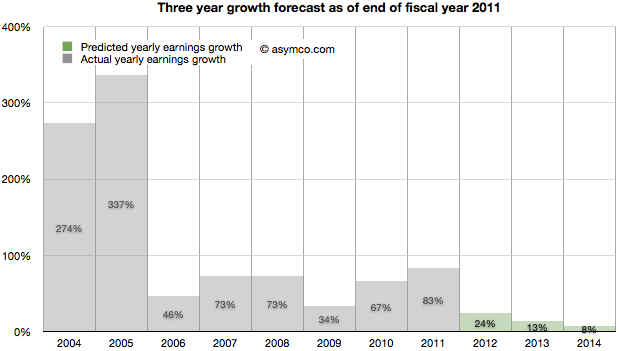
Apple just had a tremendous two years. 2004 and 2005 saw EPS grow at 274% and 337%. This is largely due to the runaway hit iPod. Given all that is known about the company, what will you put forward? While you're at it can you also forecast two years forward, namely provide a growth forecast for 2006, 2007 and 2008?
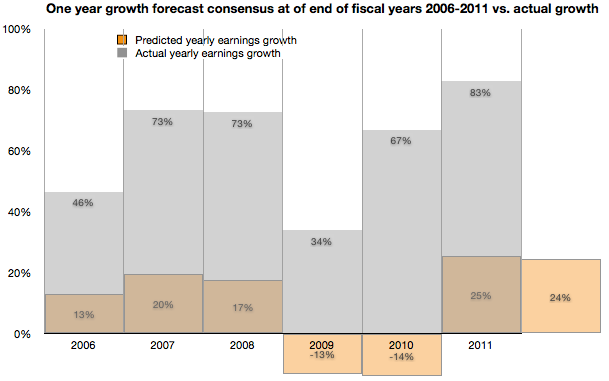
Here is what you and your cohorts publish as a consensus:
You go with a 13% growth for 2006, 15% for 2007 and 5% for 2008. The chances are, you reason, that the iPod will not carry the company's growth much longer. The competition is sprouting all over and Microsoft is rumored to be launching its own music player.
It makes sense to be conservative and offer a modest growth of 13%. At the same time you can rate the stock a buy as it is still growing. The stock just doubled in the last 12 months and the law of large numbers says that growth cannot last at the same rate as we've just seen.
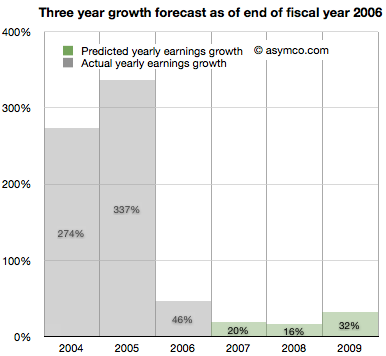
It's now late 2006. Apple just closed out another big year. Contrary to your forecast last year, the company grew at a rate of 46%, more than three times faster than you expected.
It turns out the iPod still has some legs and the company's Mac business seems to be growing. Looking forward you take your 15% growth for 2007 and increase it to 20% and suggest 16% for 2008 and 32% for 2009.
There are rumors of Apple getting into the phone business.
It's now late 2007. Apple just launched the iPhone and even though it was available in limited numbers on one carrier for one full quarter, the company still turned in an amazing 73%. Again more than three times faster growth than you forecast. What do you do about 2008?
It might make sense to increase the previous 16% estimate to 17% but since there is a real estate bubble brewing, the 32% growth for 2009 should come down to 22% and defer that growth out to 2010, dialing in 27%.
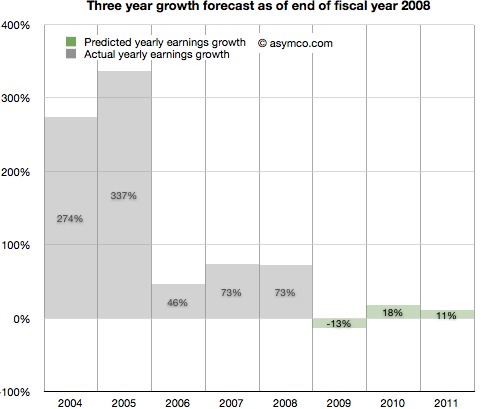
It's now late 2008. Apple closed out another huge year. 73% growth was once again more than triple your forecast of 17% growth. It's clear that the iPhone is a huge hit.
However, there is a credit crunch and talk of a huge recession, even depression looming. Apple is a luxury/premium brand and it is unlikely that those expensive products will sell well into these "macro headwinds". You predict a decline in the earnings of 13% in 2009, inline with many other tech stocks. You are optimistic however that 2010 will be a year of recovery and predict 18% increase from recession lows followed by a more reasonable 11% growth in 2011.
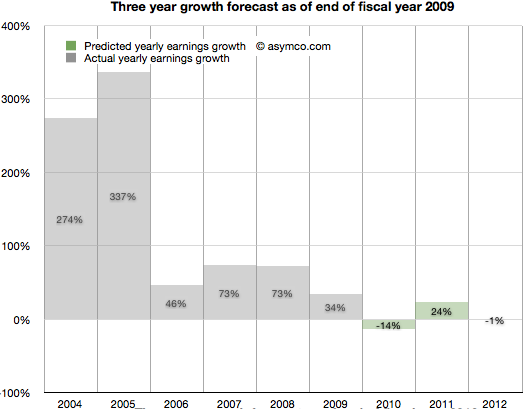
It's now late 2009. To everyone's surprise, Apple grew through the credit crisis. It turned in 34% growth (vs. your predicted 13% decline). The success is hard to believe but the iPhone had a lot to do with that. There are new competitors coming and the recession has proven resilient. With unemployment still high you predict 2010 will still be a tough year. You go with -14% growth for 2010 and postpone recovery out to 2011 with 24% "bounce". Longer term you see 2012 as a flat year, with Apple earnings shrinking slightly by 1%.
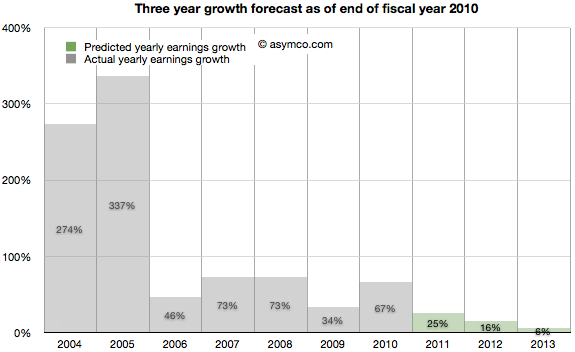
2010 ends with Apple achieving 67% growth. Shocking relative to a -14% growth forecast. But then again, Apple launched the iPad and who could have thought that was a hit? Apple achieved growth throughout the recession and it looks like it might keep going. Your 2011 forecast of 24% looks weak so you increase it to 25%. The 2012 decline thesis is abandoned in favor of 16% growth and, given the likely competition in smartphones, you tone down growth in 2013 to 6%.
It's November 2011. The company turned in 83% growth. It's more than three times faster than your forecast. Some people are suggesting that Apple may have a lot of headroom with the iPhone and iPad but the law of large numbers is what it is. The company became the largest by market cap in the world and Android is gaining huge market share. However, in deference to their strong recent performance you increase the 2012 forecast from 16% growth to 24% growth. 2013 goes from 6% to more than double: 13% and 2014 is when growth begins to slacken, though still a healthy 8%.
As the following chart shows, look ahead one year accuracy has not been all that great, but you are at least consistent. In any case, everything you based your decisions on showed remarkable consistency with consensus. You're just reflecting common sense.
Note:
Though the numbers are all real, the narrative is fictitious. I suspect however that the truth is actually stranger than this fiction.
Before diving into the answer to the question in the title, there is some new data to digest.
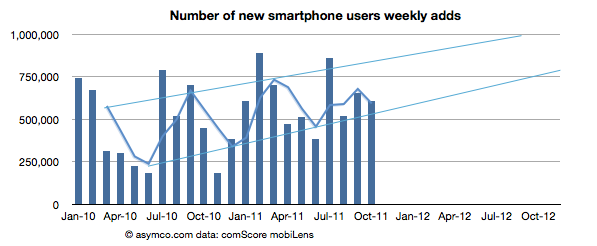
The latest from comScore shows consistency with the previous months of smartphone growth in the US.
The growth rate was 607k/wk new-to-smartphone users. This is slightly down from 654k/wk for the previous month but up significantly from 450k/wk the year before.
The penetration of smartphones reached 38.5% (non-smartphones are at 62%)
The penetration should reach 50% before September 2012 with about 1.2% being converted every month.
The following chart shows the weekly add rate with a three-period moving average:
This chart is important in that it should first show signs of inflection in growth. That does not seem to be happening yet.
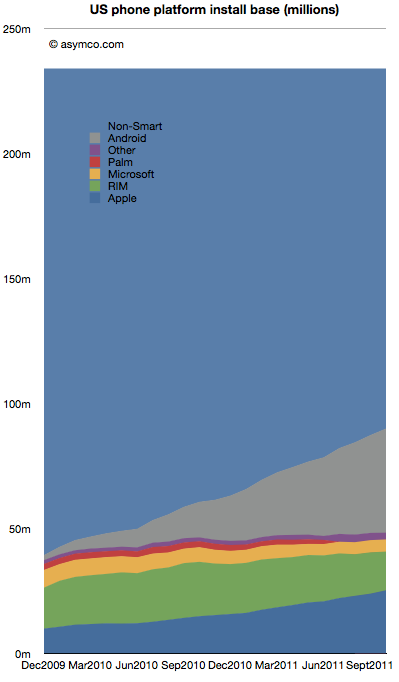
The installed base by platforms is shown below:
Android is estimated to have grown to 41.7 million users in the US, adding 2.5 million users in the last month. Android is adding half of Microsoft's entire US mobile base every month.
RIM BlackBerry lost one million users in October. RIM's slide has accelerated again with over 3.7 million leaving the platform in the last six month. With 15.5 million subscribers, RIM has fewer users in the US today than it did in late 2009.
iPhone gained 1.34 million. Installed share increased slightly to 28% from 27.4% the previous month. There are now over 25 million iPhone users (above age 13) in the US.
Windows Mobile/Phone had no perceptible change (-34k) indicating perhaps that the losses in Windows Mobile are being erased by gains in Windows Phone. Microsoft's platform stopped losing significant users six months ago. Whereas the bleeding has been stopped, overall number of users remains at a rather poor 5 million or 5.4% share.
"Other" which includes Symbian and WebOS lost another 184k users to reach only 2.7 million users.
There are still 144 million smartphone non-consumers.
Android and iPhone now make up nearly three quarters of all smartphone ownership in the US. That's a total of 67 million users. With no sign of slowing, the chances are that there are at least 100 million users still remaining to convert. Sounds like an attractive target. But that target is shrinking fast. The rates of adoption signal saturation of most likely buyers will happen toward the end of next year.
At least 25 million new Android users will be gained and at least 10 million new iPhone users will be created in the next 12 months. That's 35% of remaining non-consumption. Assuming some acceleration, it's not hard to see 50% being claimed by the two entrenched incumbents.
This leads to an interesting positioning question. Is Windows Phone destined to compete with consumption or non-consumption? If traction is not forthcoming in the next 12 months, that leaves a very difficult last 50 million available as non-consumers. They are more difficult as they will be late adopters and perhaps more price sensitive and less motivated by features.
Windows Phone still has quite a bit of opportunity outside the US, but in the US (and in Europe which is not much different) the competition will increasingly be with rival incumbencies not with non-consumption. As the custodians of the Windows franchise, Microsoft should be well aware of the inherent difficulties with competing with installed platforms.
Andy Zaky at Bullish Cross wrote a great post on Apple’s valuation, showing the deep discount of Apple's earnings vs. an average company. It essentially states that Apple's money is not green.
Felix Salmon took it forward by enumerating a few explanations that might be used for the despondent valuation. None are successful arguments, but that should not be a surprise.
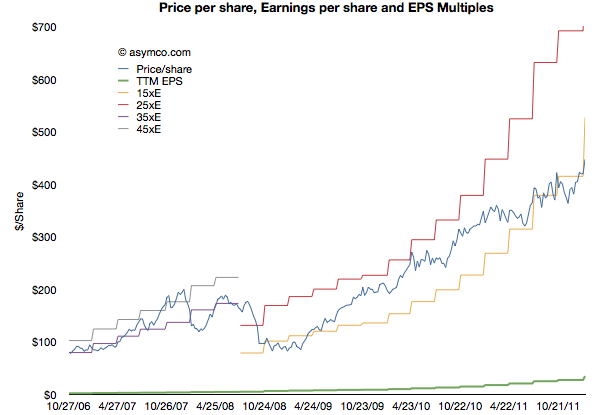
To understand the phenomenon a bit more precisely, I maintain and think about these charts:
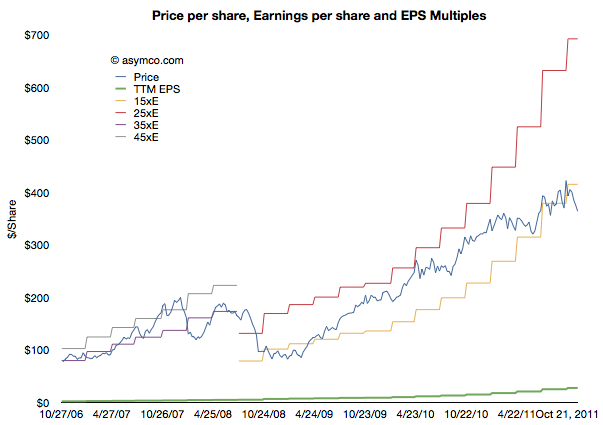
This shows Apple's share price ("P" in blue) and its earnings per share ("E" in green). In addition there are multiples of the earnings in "bands". The first band is 35xE to 45xE which bounded the price during the period of 2006 through most of 2008. The second band is 15xE to 25xE which bounded the price since then. The data is updated weekly so it is current as of last Friday.
Illustrating it this way shows how the stock is seen as representing different companies at different times. The 2006 era (iPod) Apple was seen as a high growth, dynamic company with loads of headroom for growth. The current (iOS) Apple is seen as a slow growth, fairly static company with most forecasts showing 20% growth potential.
Note that the price has dropped outside the current band for the first time since the great recession. It is still below 15xE today. Perhaps a new band is forming.
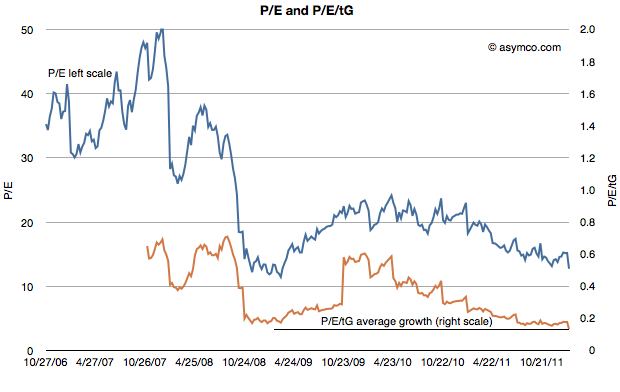
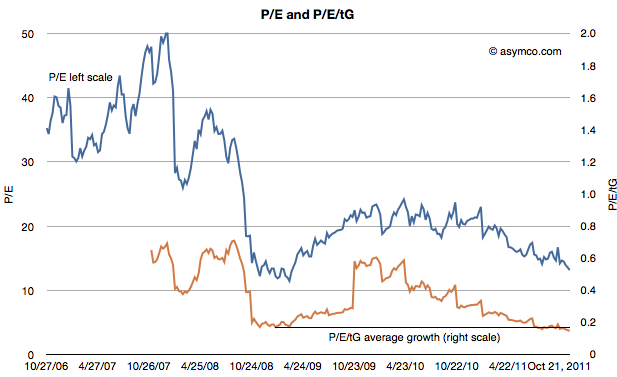
The second chart shows the P/E on its own (in blue) but with a second measure where the P/E is divided further by the average trailing twelve months' growth (P/E/tG). This is a variation on the P/E/G (aka PEG ratio) where instead of (mostly wrongly) estimated future growth I use actual growth history--hence the t for trailing. The P/E/tG is a way to normalize P/E as a function of growth and hence a more appropriate index of value potential.
I added a horizontal line to the chart to show the minimum value P/E/tG reached during the recession (0.17 in January 2009). As you can see, the P/E/tG is now lower than at that time (0.15). It implies a deeper discount for the company's earnings growth than during the time when the world faced economic contraction.[1]
Note also the trend of that line as it shows a steady linear path toward zero.
Of course, it cannot reach zero unless Apple files for bankruptcy. But until it does file, the line can only reach zero asymptotically as E/tG increases. Which is a relief, I suppose, as it means the rate at which P/E/tG drops will decrease. This implies that as earnings growth persists, the drop in price will have to moderate.
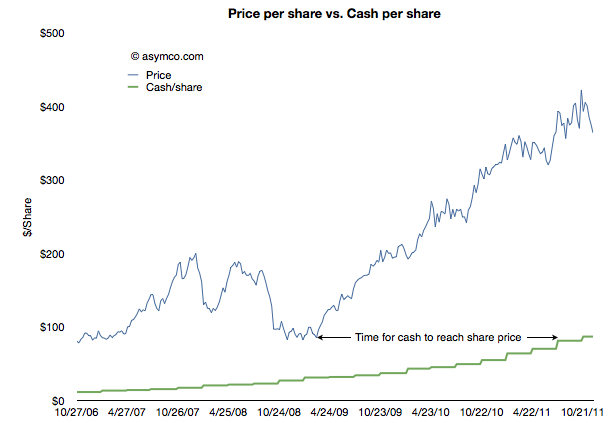
The other threshold to keep an eye out for is when Apple's share price will reach its cash per share. That's the point when investors will consider the company to be a net value destroyer. If you performed that analysis in January 2009, and you were accurate about earnings forecasting, the answer would be well before today. See the following chart:
In other words, in January 2009 the stock was trading at a price (<$80/share) below the current cash per share (>$85/share). It took Apple 18 months to grow its cash to reflect the price set on the company. Had the stock not risen then the company would today be trading below book value.
The amazing thing is that today the valuation structure (P/E/tG) is even worse than in it was January 2009. An interesting exercise would be to project how long it would take for the cash to increase to the current share price.[2]
I imagine this time interval should have a name. How about the time to boil: the time for growth pressure to become sufficiently high to exceed disbelief that growth can happen.
---
Notes:
Note that the low values were placed on the company after the crisis took hold, not as an anticipation of contraction. See the behavior of the index during the summer of 2008 as the credit crisis was unfolding.
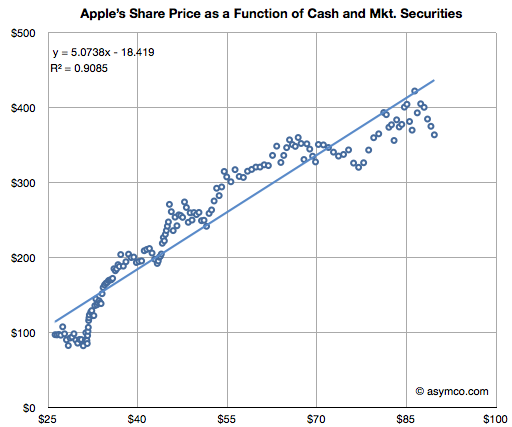
This analysis is consistent with the analysis that Apple is not valued on earnings or earnings growth but on its balance sheet. The ratio of Price/Cash has been fairly constant but if it breaks down (as it has been--see below) then we need to assume a new dynamic is in place.