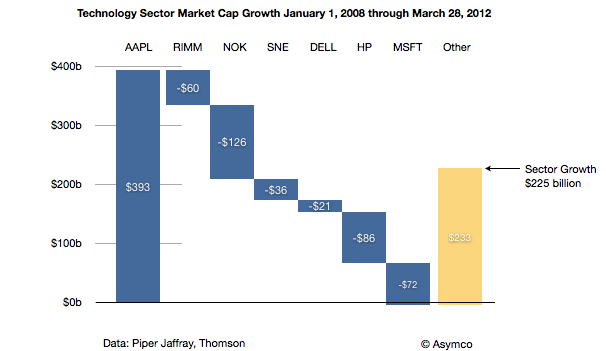
Philip Elmer-Dewitt published a table from Piper Jaffray's Gene Munster which has some interesting details. Munster has taken a four year "tech sector" view of value creation (and destruction) and tried to see if there is a bound on the value Apple can continue to capture. This "share of value" is one of many approaches to bounding an opportunity. You could consider "share of wallet" by measuring disposable income, or "share of eyeballs" by measuring screen time available or even "share of GDP".
The attractive part of the share of value of industry is that we have an implicit way to see winners and losers, or the transfer of wealth from one group to another. I charted the data published as follows:
Seen in this context, Apple generated nearly as much value[1] as RIM, Nokia, Sony, Dell, HP and Microsoft destroyed. The rest of the sector generated $233 billion of value but if it were not for Apple, the tech sector would have declined by $168 billion.
As a result, Apple went from being 5.6% of the value of the sector to being nearly 17%. The argument goes that its share of value could still increase further even if the overall sector does not. At 30% of current total value, Apple would be valued above $1 trillion.
My observation is that the conservation of value exhibited in this data is not the entire story. What is gained by Apple should be more than what is lost by others. The disruption under way has had victims but the net value created should be more than what they lost. The iPhone and iPad should be competing with non-consumption, bringing new value into the sector from other sectors or from non-productive capital. Perhaps they are and the losses by the cohort arrayed above are incidental, but there is likely to be a blend of competition and new market growth.
Does the analysis satisfy?
Perhaps. It's one more perspective into the puzzle. Growth rates, market sizes, technology improvements, brand and satisfaction analysis as well as jobs to be done are all offering perspective views. I would say there is consistency in the data but they should all be weighed with vigilance.
---
Notes:
Market cap is the perceived net present value of all future cash flows discounted to the present for a publicly traded company and hence defines the value created by the firm. It's measured by markets so there is room for error but it's the best measure available and has historically been accurate over long periods.
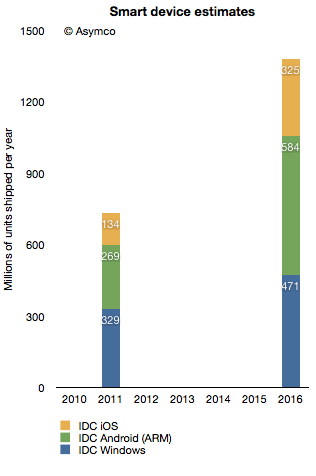
In terms of platforms, IDC expects a relatively dramatic shift between 2011 and 2016, with the once-dominant Windows on x86 platform, consisting of PCs running the Windows operating system on any x86-compatible CPU, slipping from a leading 35.9% share in 2011 down to 25.1% in 2016. The number of Android-based devices running on ARM CPUs, on the other hand, will grow modestly from 29.4% share in 2011 to a market-leading 31.1% share in 2016. Meanwhile, iOS-based devices will grow from 14.6% share in 2011 to 17.3% in 2016.
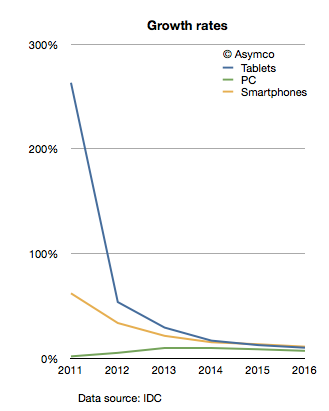
The company provides a stacked bar chart (follow link above) to illustrate their view of the market. I took the data they included and measured the implied growth rates for the product categories:
IDC is implying that in four years the tablet market will be growing at 10%, the Smartphone market will grow at 11% and the PC category will grow at 11%. In other words, five years from now the PC market is expected to grow faster than the tablet market and just as fast as the smartphone market!
What's more remarkable is that this situation is not going to happen in four years. The slowdown in growth is actually expected much sooner. The growth rates two years from now are expected to be: Tablets 17%, Smartphones 15% and PC 10%. IDC is unequivocal: by 2014 the good times will come to an end to the post-PC challengers. These growth rates would be catastrophic for share prices and the value propositions of the new platforms to developers, partners and consumers.
What's more, these growth rates are striking not only because they predict a collapse in the value of most market challengers but that they also predict a strongly resilient PC market. How can we test this forecast?
I tried to reconcile this doomsday scenario with what is known about the components making up the data. I.e. what "bottom-up" data is IDC using? In the quote above, IDC offers some insight into this market participant data. Based on the category and share data they published it's possible to infer the following:
Bearing in mind that neither iOS nor Android existed five years ago, we can observe they are bigger together than the PC market. And yet, IDC predicts a compounded average yearly growth rate of 16.7% in Android, 19.4% in iOS and 7.5% in Windows between today and 2016.
In aggregate, IDC forecasts that in the next five years Android will not manage to double and that iOS will only increase by a factor of 2.4. Is this believable?
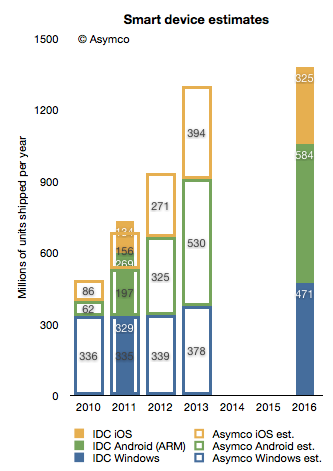
I try to stay away from long term forecasts, but I do maintain a short term forecast based on recent growth data. My forecasts for this year and next year are shown below.
I super-imposed my short-term forecast (outline bars) on IDC's long term forecast (solid bars) and a several differences become apparent.
First, my 2013 forecast is nearly the same as IDC's 2016 forecast. To see why we need to look at each platform separately.
Perhaps we might (with difficulty) agree on Microsoft's potential. I believe Windows 8 will have a catalyzing effect and that Microsoft will begin to see its platform grow again. However, my expectations are modest. To increase Windows sales rate by 100 million units/yr between 2013 and 2016 is possible but ambitious.
The real problem is that our Android and iOS forecasts are outside any zone of possible agreement. Maybe there is a difference in what we measure. For a hint, we seem to disagree on the number of Android devices shipped in 2011. I used Google's own reports of activations to work out the yearly shipment estimates. Perhaps IDC is including versions of Android that are not Google sanctioned.
We also disagree on the 2011 iOS figures. I obtained 156 from Apple's own reports. Again, perhaps the difference is the inclusion of the iPod in my case.
Nevertheless, the difference in the long term cannot be accounted for only through these categorization differences. I would put the cause of the difference down to the methods used in forecasting. As can be seen from the first chart above, IDC's growth rate reductions are extraordinarily steep. Perhaps the approach used by IDC was to forecast the overall market growth and then assignment of shares to participants. This can be called the "top-down" approach. In contrast, my approach is to forecast growth rates based on recent growth rates and moderating these rates gradually. This can be called the "bottom-up" approach.
My experience and all the data I've ever collected about historic disruptions tell me that the entrants tend to win these types of paradigm shifts. They win through a vast expansion of consumption and the recruitment of non-consumers. Markets tend to experience vast shifts in composition. If we believe this to be true then the bottom-up approach focused on entrants is likely to be more effective vis-a-vis the top-down approach of projecting steady state markets and the implicit assumption of incumbent share preservation.
Apple's share price has increased rapidly in the last few weeks. The rise to $600 was swift and broke the pattern of slow growth the the stock was able to obtain over the past few years. The level, however, shouldn't have been a complete surprise.
I think Apple is going to $600...It's really not that complicated. Apple has a number of key drivers in its business model which have yet to be properly priced into the stock because I think it's very cheap at this level.
-Stephen Coleman, chief investment officer at Daedalus Capital
This prediction was made October 26, 2007. On that date Apple's share price closed at $184.7. It may have seemed like a bold bet, but as Coleman noted, the reason why it would reach $600 was easy to spot.
The real story on how I get to that valuation doesn't even involve the sale of (the Leopard operating system) or the growth in the Mac business. How I get there is through the iPhone itself.
What was not easy to tell was when it would reach $600. Back in October 2007 the stock had a P/E ratio of 48. It's PEG(trailing) was 0.65, and cash per share was $17. Sales were $6.6 billion for the quarter and earnings were 98c/share. If an analyst were to take those ratios and apply a forecast of sales five years hence, the $600 price would have been reached much sooner: Sales had tripled by 2010 and earnings had tripled by 2009. In contrast, the stock took until 2012 to triple.
The delay of one or two years is perhaps reflecting the risk involved in investing. Namely, you can predict outcomes but not their timing.
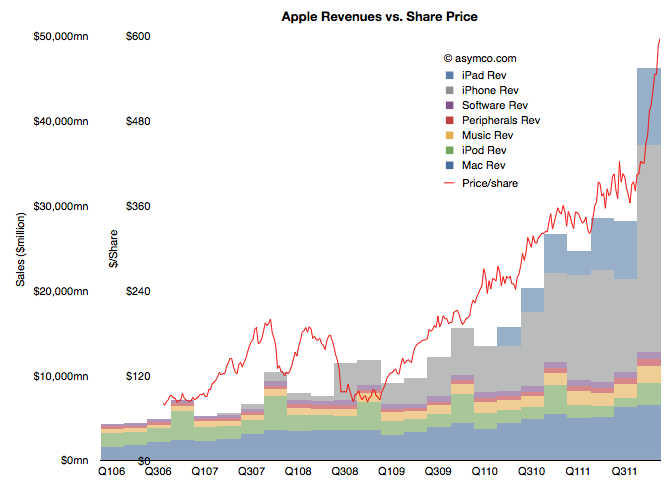
But still, we have to return to the question of why the stock has rallied in the past few weeks. There has been no new information about the company since it reported earnings and any product launches (e.g. new iPad) or increased distribution (China) are completely predictable. Curiously, the market did not react until late in the quarter. The following chart shows the phenomenon.
(Note the two scales on the left: inner is share price, outer is net sales)
It shows the share price as a line superimposed on the sales chart with stacked product revenues. The recent rise can be attributed to the rise in revenues/earnings from the fourth quarter. But why would a stock react in March to data from six months earlier (and published two months earlier).
Classical market theory suggests that markets anticipate and "discount" the future. Efficient markets supposedly react to all available information and do so instantly. If that was the case, the chart above would show the red line shifted significantly to the left.
What we are observing is market inefficiency.
Inefficiency implies that perception of reality is not the same as reality. It happens when people are reluctant to believe the truth. It's also implies that with $15 billion being "bet" on the share price every day, each one of those bets is misinformed!
The cause of this divergence between reality and perception is that disruptions are divergent from perceptions. A disruptive company always "leads" its valuation. There is cognitive delay for the vast bulk of observers. You can then argue that for those, like Mr. Coleman, that don't suffer this delay, there will be profit.
In the recent event discussing Apple's cash plans, Tim Cook stated that the primary objective of the stock repurchase program is to reduce dilution from the ongoing distribution of shares to Apple's employees and executives as part of their future compensation.
The amount allocated to this is $10 billion over a three year period.
This sets up an interesting analysis. The company is saying that they will continue to pay employees with newly issued shares (in addition to wages) but that a portion of those shares will be purchased back from the market to reduce dilution.
To understand the impact, it would make sense to look back and observe how many shares were issued in this way historically and consider how much $10 billion buys.
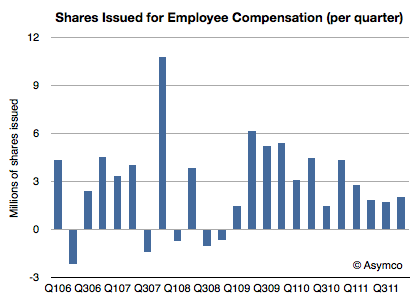
The following chart shows the quarterly change in shares outstanding.
The absolute number of shares outstanding grew from 874.2 million in Q4 2005 to 941.6 million last quarter. That's a net increase of 67 million shares over a six year period. The rate of growth has been accelerating. Over the last three years 40 million shares were issued.
These issuances have an effect for shareholders. They "dilute" the total shares outstanding and thus spread the earnings more thinly. You can get an instant feel for this as the EPS figure must be re-computed each quarter with a different denominator. This is a real cost.
Here is how to compute it. Last quarter there were two million shares issued at a "cost" of about $400/share. That means that shareholders lost the equivalent of $800 million (2 million x $400/share average price in Q4) of value.
Now what Apple has just promised is that they would buy back the equivalent of $833 million per quarter ($10 billion/(3 years x 4 quarters/yr)) for the next three years. Note how close this figure is to the one calculated above.
What we can also obtain is a ratio between stock-based compensation and wage-based compensation. Since we can estimate the total Apple employee wages at $3.2 billion per quarter (average R&D and SG&A over the last year), the stock compensation of $800 million amounts to a 25% bonus.
In other words, on average an employee is likely to get compensation of $X in wages and 0.25X in stock grants.
Therefore Apple's $10 billion dollar pledge is not only a commitment to shareholders that the dilution will be eliminated. It's also a signal to employees: for at least three years, Apple will continue to offer shares as compensation and will do so in a ratio of 1:4 of wages.
Today Apple announced both a dividend and a share re-purchase plan which, when combined, will consume 45% of Apple's current US cash reserves.
The dividend will be $2.65/share/quarter and the buyback will cost $10 billion over three years. The dividend will therefore cost about $2.5 billion per quarter (starting next quarter) and the re-purchase will cost about $833 million per quarter (starting next fiscal year).
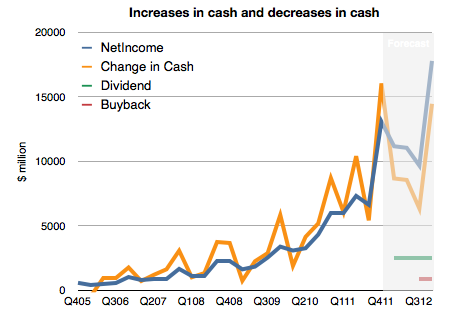
However, note that Apple's cash has been growing far more quickly. It increased by $16 billion last quarter or $37 billion over the last year. This rate of increase is itself increasing.
To illustrate, I prepared the following chart. It shows historic net income, change in cash and a forecast of the costs of the new uses of cash and future net income (based on my estimates).
I made an assumption that future cash growth will equal net earnings minus costs for the new dividend and share re-purchase. What we should see is that the previously tight coupling between increase in cash and earnings will remain but that there will be a negative offset by $3.333 billion each quarter. In other words, cash will increase but at a slower rate.
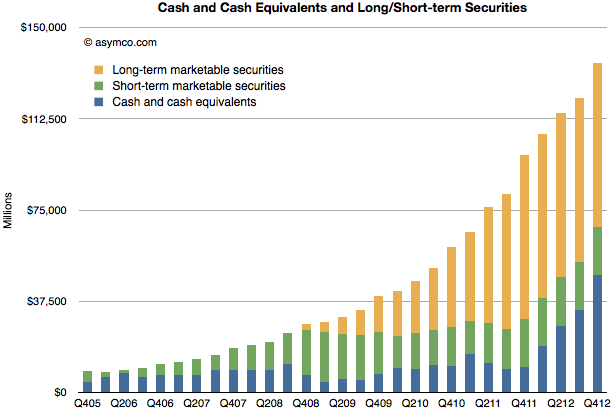
This means Apple's total cash should still grow by more than $35 billion this year.
That would result in the following, more subdued, total cash trajectory (for simplicity, I assumed all added cash would be in cash and cash equivalent accounts)
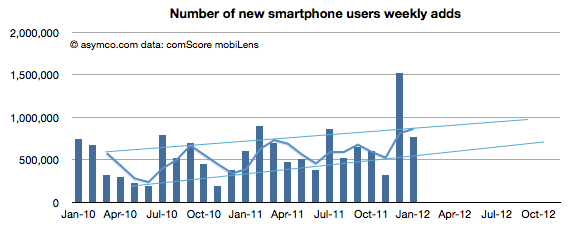
January saw a return to trend line growth in US smartphone add rates. The 767k/week rate is within the band after November's below- and December's above-the-line outliers. The weekly add rates are shown (with projection of trend) below:
The pattern shows a likely 1 million new smartphone users per week being added consistently by the fourth quarter of this year.
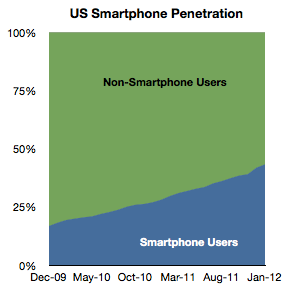
Overall, penetration of the sampled population (above age of 13, primary phone and excluding business purchases in the US) reached 43.3% in January. The increase was 1.45 points from December.
A significant 35 million US users switched to smartphones in the last 12 months, equivalent to 15% of the user population. My current forecast is that 50% of the user base would be smartphone users by June 28th.
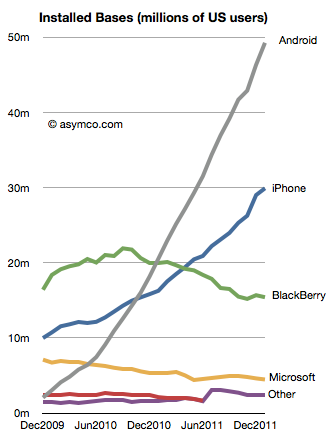
The platform data shows a continuing pattern. In terms of absolute users Android has reached nearly 50 million users, iPhone 30 million, BlackBerry 15 million and Microsoft (Windows Phone and Windows Mobile combined) 4.5 million.
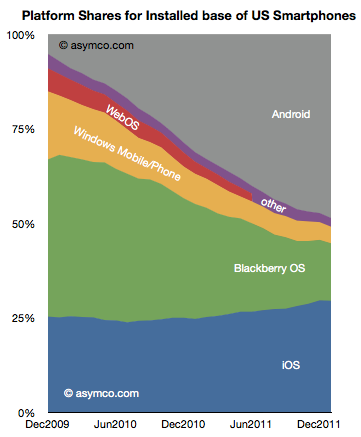
In terms of market share of the smartphone population, the various platforms stack up as follows:
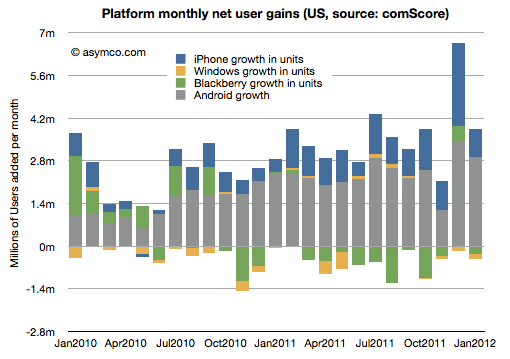
The net gains for each platform by month are shown in the following diagram:
RIM and Microsoft have continued to lose users while Google and Apple have continued to gain.
The two trends that continue are that overall penetration is nearing saturation and that two platforms seem to be increasing their share of that base. The "comeback story" for any of the hopefuls will depend either on switching users away from their current platforms of trying to engage with late adopters. The first option is daunting due to latent network effects related to platforms and the second sounds to be symmetric to existing incumbent strategies.
Without an asymmetric approach, the challengers are unlikely to succeed.
We've been very, very focused on China. China, we've had incredible success with iPhone. Over the past few years, we've gone from a few hundred million dollars of revenue in greater China, to last year $13 billion. So we really've been focused on trying to understand the market there and then taking those learnings to other markets. As it turns out--and not very many people agree with me on this, probably--but what I see is that there's a lot of commonality in what people around the world want.
People do want the same things globally, but due to various constraints they typically don't get the same things at the same time.
One of the most important constraints on the purchase of iPhones is the state of 3G (or, more broadly, mobile broadband) networks. An iPhone is a mobile computer whose primary value is derived from high bandwidth data communication. Because this bandwidth is not universally available, the iPhone faces a restricted addressable market.
The good news is that 3G networks are being adopted very quickly. The International Telecommunications Union reports that 20% of mobile users have "active subscriptions to mobile broadband" (1.2 billion out of 6 billion). That's encouraging but the subscription rate varies widely by country. Ideally we should look at the data on a country-by-country basis.
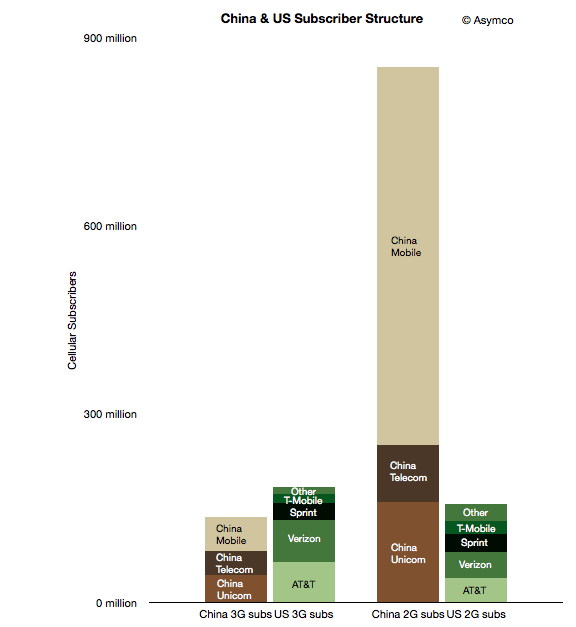
To start, I took a look at two countries which may form an interesting sample: the US and China. The following chart shows the subscriber structure in the two countries grouped by 2G/3G subscription and by operator.
The two left-most columns represent nominally addressable iPhone markets. The two right-most columns represent currently unaddressable markets. Note that
although China is a far bigger market, the lower 3G penetration means that the theoretically "addressable" market for the iPhone is smaller in China than in the US (136 million vs. 183 million respectively).
However, there are further restrictions. Apple does not have distribution agreements with many (most?) of the world's operators. In these particular countries, China Mobile, T-Mobile and "Other" US operators do not distribute the iPhone. We should subtract those operator customer bases out of the addressable market. But those conditions are variable: operators may sign up for future versions of the phone and 3G subscription rates are increasing. That means we can segment the market as follows:
Currently addressable operators and 3G subscribers
Potentially near term addressable users if all operators agree to distribute the iPhone in these countries
Potentially longer term addressable users if all users switch to 3G and all operators distribute the iPhone.
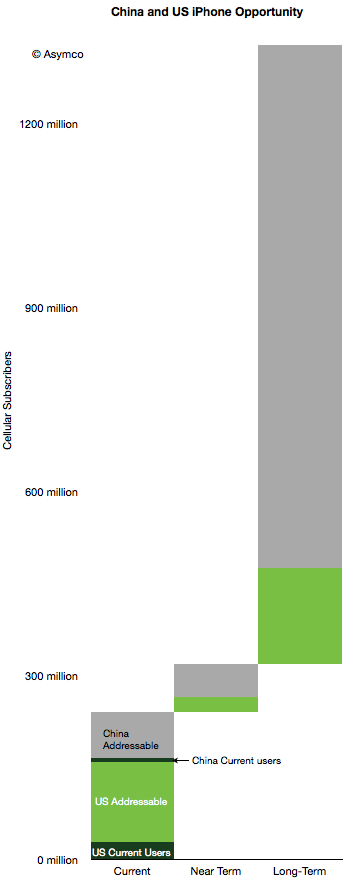
This segmentation leads to the following diagram.
I also added the current users given comScore data for the US (29 million) and an estimate of 8 million Chinese users. Here are some observations:
10% of China's currently addressable market is penetrated while the US penetration is 18%.
If all operators would agree to distribute the iPhone (i.e. including "Near Term" in the addressable total), the Chinese penetration would be 6% and the US 16%.
If we include all users as addressable, China is about 0.8% and the US is at 8.5%.
The penetration of the iPhone in the US and China combined therefore stands at about 3% today.
The question that comes next is what is a reasonable limit to total penetration? What can we reasonably expect or what could Apple reasonably target?
I've been using a global share of 20% as a reasonable target to test growth assumptions. Assuming no significant growth in user bases, 20% share in the long term (>5 years) yields a total of about 258 million users. That's equivalent to a 7x increase. Put another way, a 5x increase yields a market share of 14%.
Note that these are "penetration" figures or share of available users. This is in contrast to share of units sold in a given quarter. Apple has maintained 20% share of smartphones fairly consistently. If share of units sold in any given time period remains at or above 20% and if smartphones and 3G networks become ubiquitous then reasonable men might consider these targets obtainable.
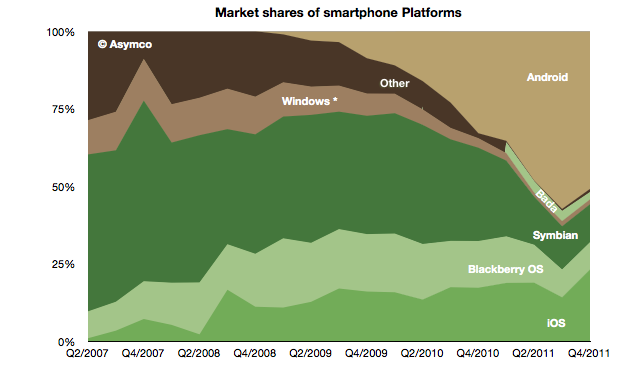
The global mobile OS market shares for Q4 shows a continuing (but diminished) leading share.
At the end of last year Android's unit share reached 51% which is down from about 57% during the third quarter. iOS reached 23%, followed by Symbian at 12%, RIM at 9%, Bada at 2.4%, Windows Phone at 1.6% and Other at 1%.
When seen on a year/year basis Android gained 18 points of share in Q4 while Symbian lost 18 points. iOS gained 6 points of share and RIM lost 6 points. Bada gained 2.5 points and Windows lost 1.5 points.
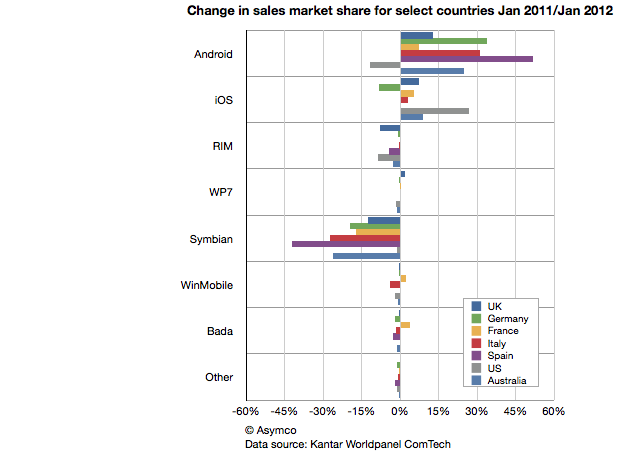
This symmetry can also be observed in another set of data. Published in The Guardian Kantar Worldpanel ComTech data shows the OS share changes for January on a year/year basis for a select set of countries.
Android share gains do seem to be mirrored by Symbian share losses on a country-level.
This should be most interesting to Nokia and Microsoft as both have a lot riding on Windows Phone replacing Symbian sales. If there should be a recovery in the fortunes of these companies, it would seem that their strategies should focus primarily on stemming and then reversing the losses to Android.
Microsoft's strategy of increasing the cost structure for Android through IP licensing is certainly part of this picture but it's a slow process to turn that disincentive for Android into a large incentive for Windows Phone.
Indeed, the speed with which Android handsets can be developed seems to be a key value of that operating system and one for which Microsoft does not have a good answer. Nokia is now one year into its commitment to the Microsoft platform and it has a very limited portfolio to show for it (and limited sales as well.) As a result, Nokia's Symbian business evaporated very rapidly. More rapidly than the company anticipated.
The dilemma for other vendors may well be how long will it take for them to develop a replacement for their Android portfolio in Windows Phone.
The opportunity cost of this switch is subtle and insidious but may be the root of why we don't see a stampede toward Microsoft. Conversely, Android contract-free, implement-at-will availability may be its greatest selling point.
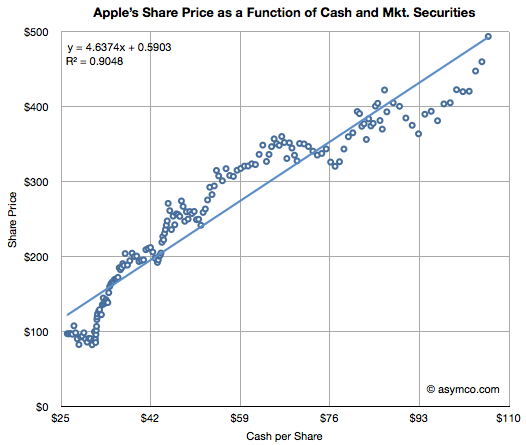
Apple's valuation since October 2008 has been very highly correlated to its cash (R-squared of 0.91). This tight relationship to Apple's value is shown in the chart below:
(The chart shows weekly, ending each Friday, share price (vertical axis) vs. interpolated weekly cash per share (horizontal axis) assuming linear growth between quarterly announcements. Share price data is current as of last Friday (Feb. 10) though cash per share is based on announcement date and hence delayed by about three weeks.)
I noted this relationship in May 2011 and followed up in September 2011. With current cash per share reaching $95 to $100 $103.66 it seems that the share price should be around $500 any time now.
It's perhaps fitting that an industry that produces illusions is in itself an illusion. The absence of public scrutiny of its finances and business model leads to a lot of myths or misconceptions. Some of these are discussed anecdotally in books and other works[1], but the absence of data makes the anecdotal evidence unsatisfying to an analyst.
What if we could find patterns in data about the industry to confirm or deny these oral histories? Fortunately some data actually exists. There are collections of data about movies released and some of the attributes of these releases such as box office receipts, theaters opening, budgets (sparsely), and distributors. This data is typically used for marketing purposes to celebrate the "hits" and thus entice more people to see the movies.
However, other information can also be obtained through analysis of the data. In fact, a rather compelling story can be told. That's the purpose of this post. Our story will be expanded over time but this first draft should be enough to allow a discussion to begin. The story is built in four sub-stories:
Drama / Comedy vs. Adventure / Fantasy: Why the Ancient Greeks had it all wrong.
The magic of summertime: Market access and school schedules
The perpetual incumbency: What happens to Hollywood startups
The Popcorn economy: The peculiar power of theaters in an age of television
These stories were the result of observations in data alone. We have no first-hand knowledge of the industry and have only used basic software tools to seek out patterns in public data[1].
The data set includes approximately 12,000 titles released between 1975 and present with various degree of completeness. Some of these years are not completely populated and some data is undoubtedly in error. However the large sample should offer enough substance for patterns to emerge in spite of this.
Drama / Comedy vs. Adventure / Fantasy: Why the Ancient Greeks had it all wrong
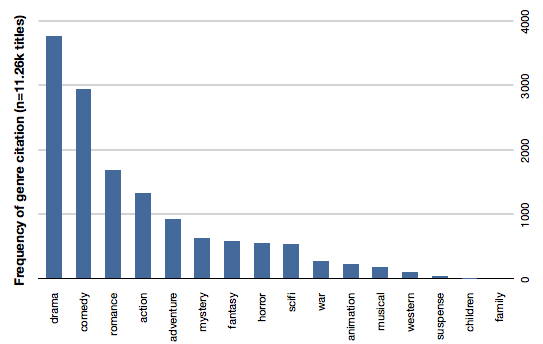
Storytelling has not changed throughout history. The same types of stories affect audiences the same way since stories were first told. The earliest known "genres" were tragedy and comedy and they are still seen as the bedrock of theater today. The same is true for movies. The following bar chart shows the distribution of genres as cited by movies over our data set.
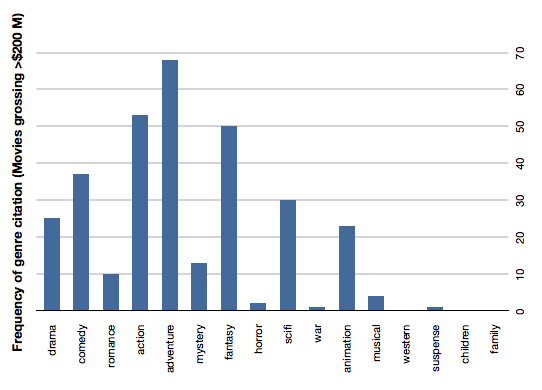
Drama and comedy are about 50% of all movies made. If we add romance they are 60% of cited genres. This is understandable given the history of theater. However the profitability (or revenue potential) of those genres is not as strong as Action, Adventure and Fantasy. The following chart shows the same count of genre citation but only for movies grossing over $200 million (which we chose to call "blockbusters").
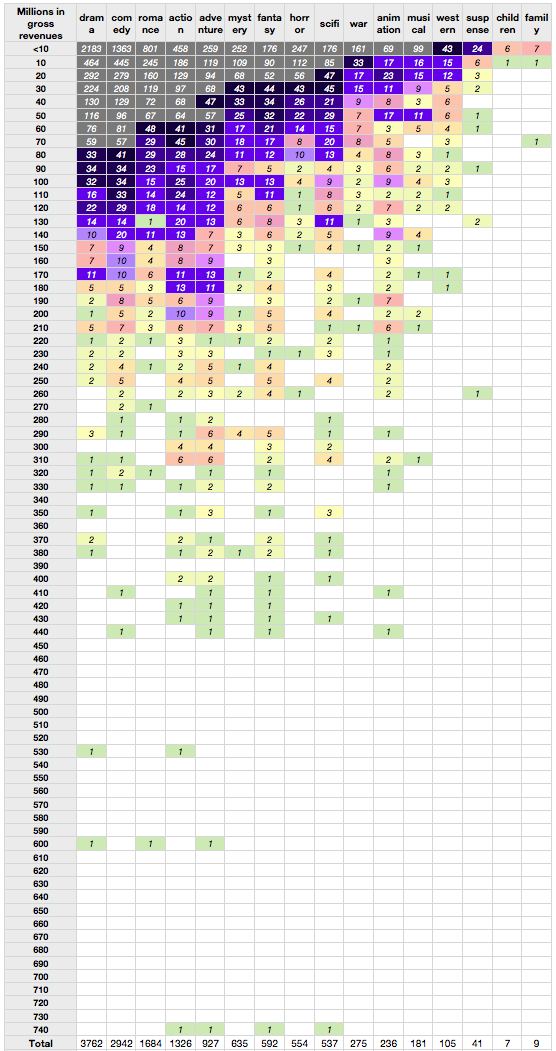
Action, adventure and fantasy handily beat Comedy and even SciFi beats drama. Romance, musicals and and mystery genres typically associated with female audiences are very rarely successful as blockbusters. The overall data is shown in the following table. The rows represent gross revenues and the columns genres cited ranked in order of frequency. One can easily observe the density of low earning drama and comedy (grey colored) vs. the more lucrative instances of fantasy and adventure. These male-dominated genres have consistent success into middle, high and very high revenue tiers.
The reason for this blockbuster attention to action and adventure is probably the prevailing theater-going audience demographic: adolescent males. The industry still produces the classic genres but less profitably than what the current targeted markets.
Indeed, these genres were very uncommon in eras predating the late 1970s. More "adult-oriented" movies like romance (Gone with the Wind), musicals (The Sound of Music) and epic movies (Ben Hur, The Ten Comandments) were common in the "golden age" of Hollywood. As we'll see in the next section, the age of the audience is a now driving more than just genre selection.
The magic of summertime: Market access and school schedules
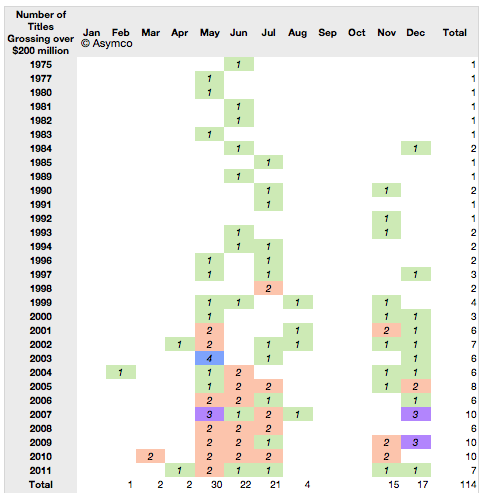
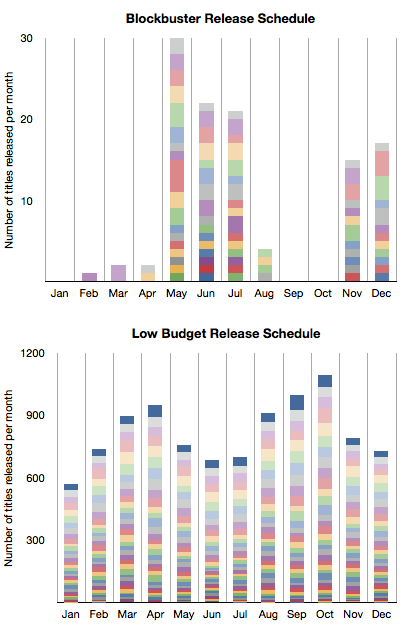
Using the word "Summer" before "Blockbuster" has become almost redundant. What is less understood is that watching movies in the summer is rather a new idea. It started effectively with Jaws in 1975 and ever since major film studios have planned their annual marketing around a summer schedule. There is clear evidence for this in the data. Here is a table showing the blockbuster release months since 1975. (The number of titles grossing over $200 million and the months in which they were released).
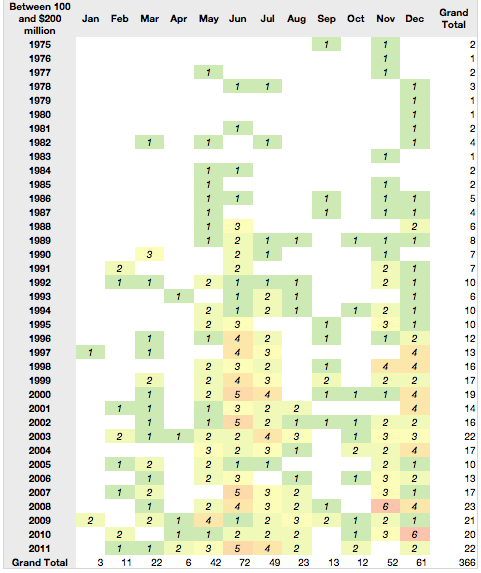
The same pattern repeats for the next tier of highly successful movies--those grossing between $100 and $200 million.
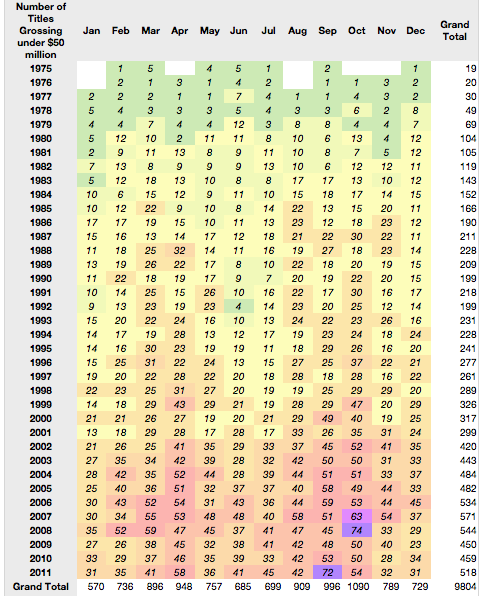
But what about the less successful movies? Those earning less than $50 million actually show a counter-success pattern.
To contrast this further, here is a stacked bar chart comparison between frequency of release by month for the most successful tier vs. the least successful tier (colors represent years with oldest at the bottom).
It would seem that summer and success are in a causal relationship. There is a clear pattern with the only non-summer months having blockbuster releases being November and December.
But there is more to this pattern.
The blockbuster schedule happens to coincide with the school holiday schedule in the US. This again points to the "profitable" audience being school-age children, and mostly male.
The perpetual incumbency: Where are the Hollywood startups?
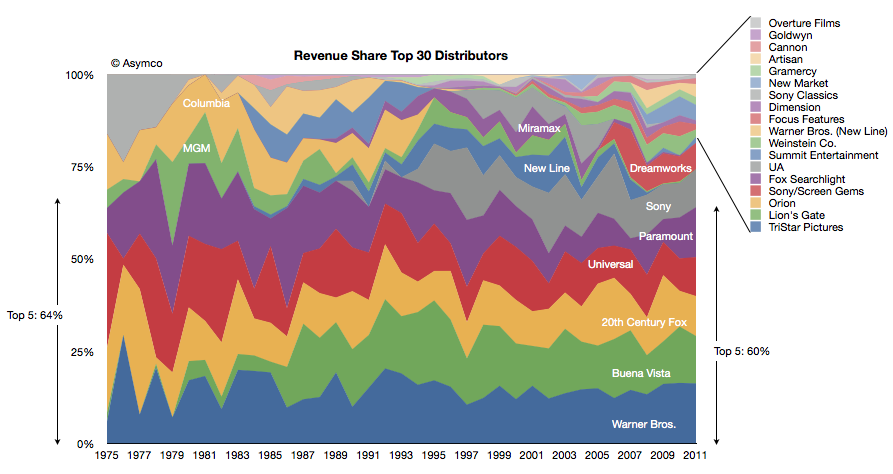
The third observation has to do with the major film studios. We took the box office revenues and allocated them to the studios over time. The following chart shows the share of those revenues for the top 30 studios.
The top five were earning 64% of revenues in 1975 and the top five were earning 60% in 2011. One of the top five from 1975 is no longer in the running this year (MGM) and one new major was added (Buena Vista, owned by Disney).
There has been one other notable change: Columbia was acquired by Sony but stayed out of the top 5. Beside Disney there is one new significant entrant in Dreamworks gaining share in the last decade.
But the prevailing impression from the data is that the incumbents remained as such during the last four decades. There are many small studios but they have not "disrupted" the market by shifting significant revenues out of the hands of the majors. Indeed the typical strategy seems to be to start a studio with the hope of it being acquired by a major.
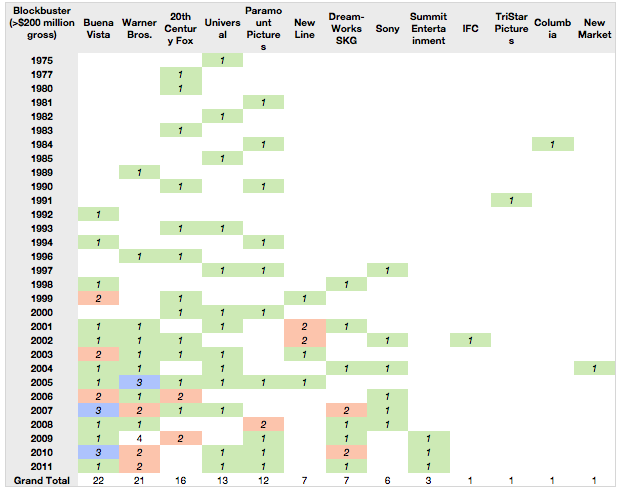
Even the entrants are industry insiders: Disney and Dreamworks are not asymmetric in their business models in any way. In fact, when viewing the data by blockbuster creation, the majors feature prominently. There are only a handful of blockbusters from the smaller companies.
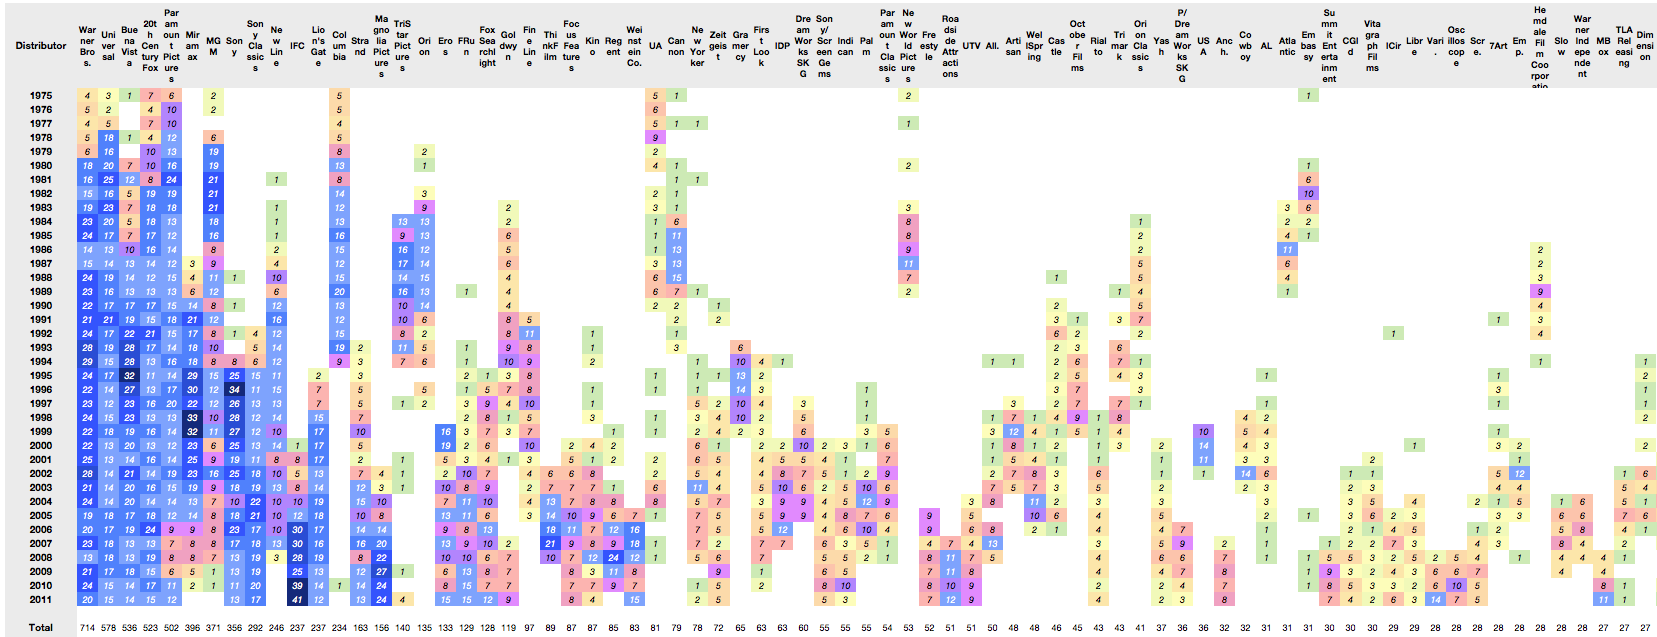
When looking at overall production rates, again the majors (and their subsidiaries) dominate. Here are the top 75 distributors of movies showing nearly 9000 movies (click image for full-size):
The conclusion from this data might be that Hollywood does not change all that much in terms of who makes the money. But that itself is a symptom of a deeper reality: that there is little that changes at all.
We can even perhaps hypothesize that there is no business model innovation taking place. Any such innovation is usually manifested in a reversal of fortunes for incumbents.
But technological change is happening. The following section describes how this appears in the data.
The Popcorn economy: The peculiar power of theaters in an age of television
The data we are sampling (box office gross revenues) is actually a small and shrinking subset of what movies generate. In addition, there are international revenues, media sales (DVD, video tape), TV rights, and merchandise to name a few. But theaters are still an important part of the picture.
Although they make up less than 20% of gross, their importance is disproportionate due to the signal they send other markets about the popularity of a movie. In other words, a movie must first be proven in a US theater before its value is priced by the other channels.
However, this essential theatrical release has changed in one fundamental way. Releases are now geared for larger initial scopes with shorter runs and less dependency on "word of mouth" to increase sales.
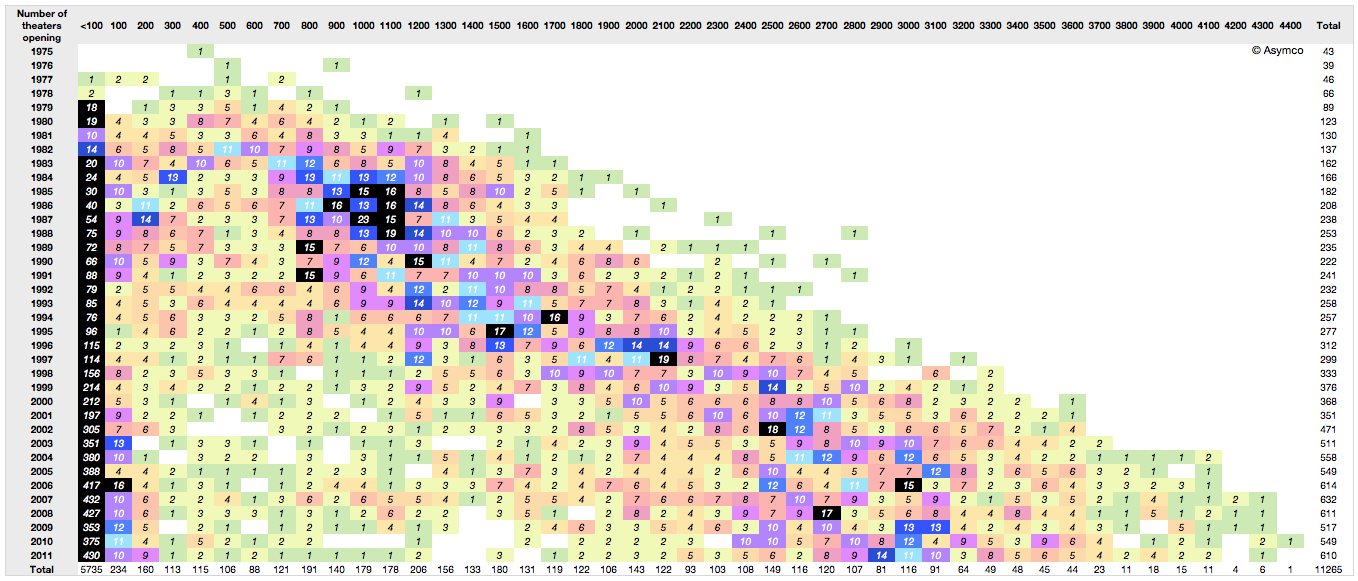
Consider the following view of release breadth (how many theaters are in an opening) by openings over time. The columns represent the number of theaters used in the opening of a movie in increments of 100. The rows are years. The cells contain the number of movies opening with that size footprint.
The pattern shows the number of theaters used in openings increasing steadily. the mean number of releases is shifting to the right. Part of the reason is that theaters shrank in size over time, but there is also the factor of needing to create a large audience at the outset of a release. The increase in "footprint" at launch (a factor of 10) is in excess of the slicing of theater sizes (a factor of two)
This broadening of launch is coincident with a decrease in viewers. As a result the notion of how movies are marketed has changed. The idea that a movie could start small and gain a following gradually through word of mouth is obsolete. That low cost approach to marketing (called "earned media exposure" in marketing) is unreliable and completely discounted.
Instead, studios manufacture an audience through paid advertising and promotion. This initial burst of viewers is essential not just for generating revenues. It's essential to driving long-term revenues.
The reason is that technology now allows the movie to be "monetized" through multiple channels. Recorded media, broadcast rights and even in-flight entertainment are all there to milk a franchise. But there is a need to get that initial vote of confidence from one crucial audience. That happens to come only from theatrical release.
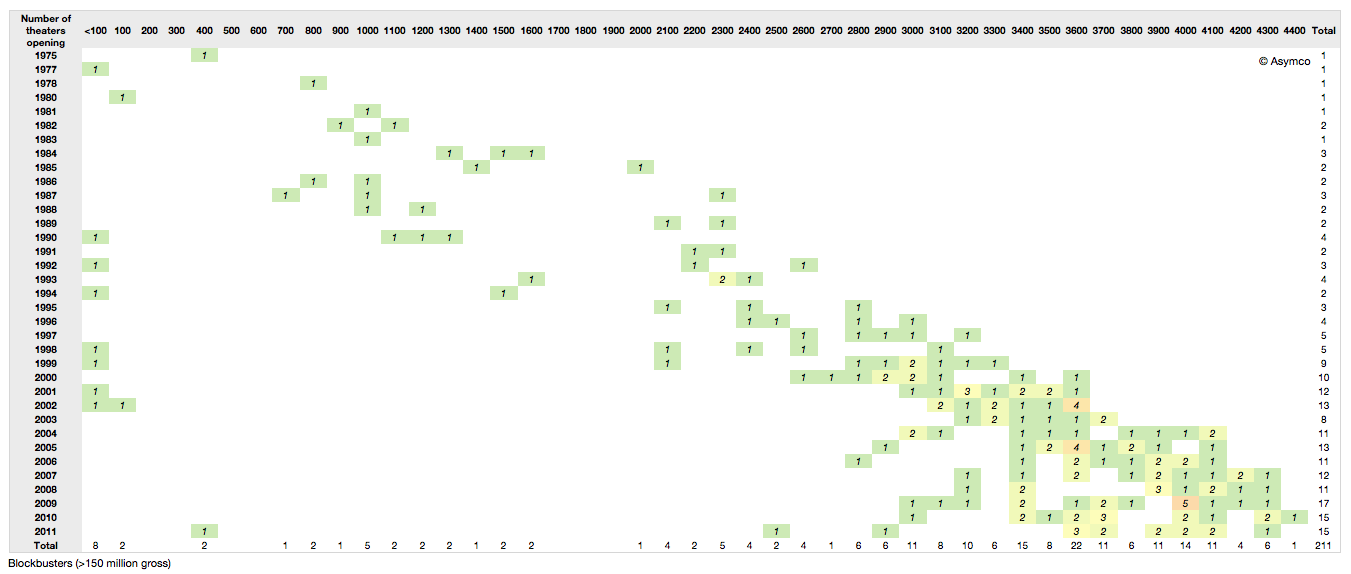
So with the scheduling pressures, the narrow window of purchased release buzz, the onus is on a broad release as quickly as possible. This holds especially true if we filter out only the blockbusters. Note how the release has increased steadily as well and that since 2000 all blockbusters released to over 3000 theaters. Compare that to Star Wars in 1977 releasing to only 30 theaters.
Data sources: Coolector, Imdb, BoxOfficeMojo, The-numbers.com
Many thanks to David McCandless and the Information is Beautiful folks (http://www.informationisbeautiful.net) for setting up the Hollywood Budgets Award that provided us with much motivation for researching this topic.
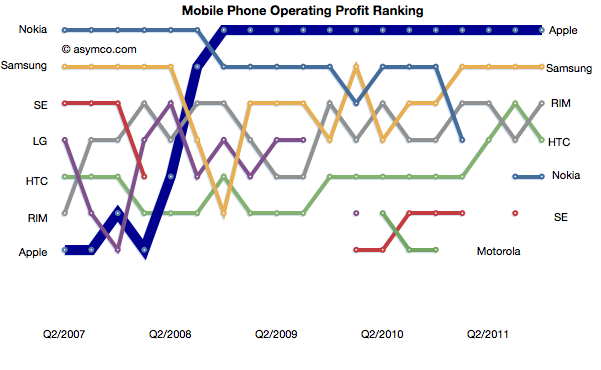
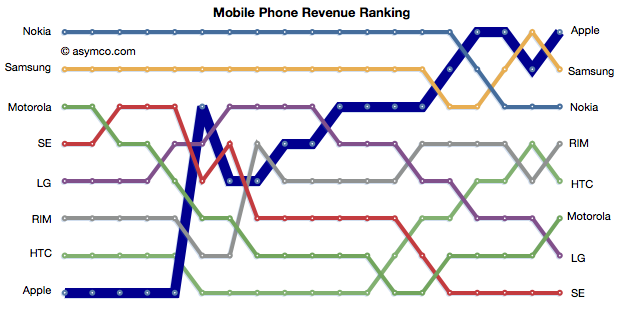
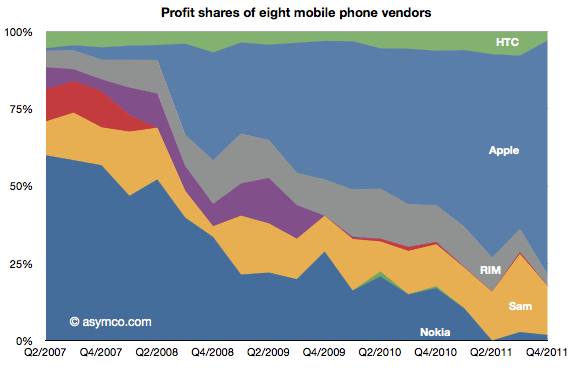
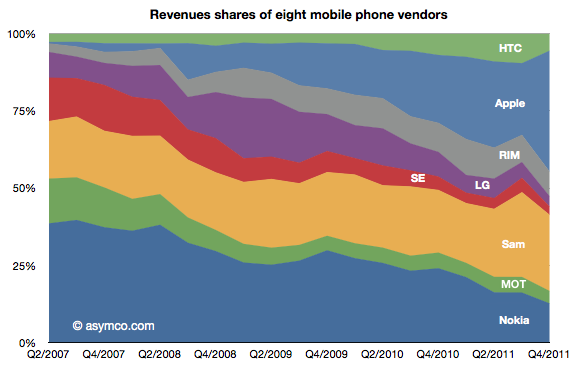
Apple retained its top rank in profitability and regained the top spot in mobile phone revenues.
The relative shares of revenues and profits are shown below:
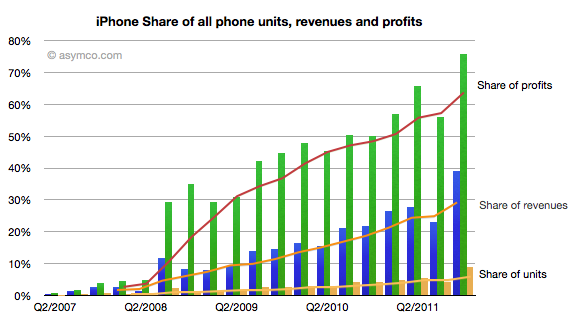
Individually, Apple's share of units, revenues and profits is chronicled below:
Apple reached 75% of profit share, nearly 40% of revenue share and 9% of units share.
Apple and Samsung combined for about 91% of profits with RIM third at 3.7%, HTC fourth at 3.0% and Nokia last at 1.8% of a $15 billion total for the quarter.
In terms of revenues, Apple had 39% to Samsung's 25%. Third was Nokia with 12.6% and fourth RIM at 8%. HTC only managed 5.5%, Motorola 4%, LG 3.3% and Sony Ericsson 2.7%.