Asymco

Asymmetric Intelligence

share

  1. The end of phone vendor tiers

    Research · 25 comments

    It's time to review the mobile phone market at the end of the first quarter of 2011. Before I begin, I'd like to remind that this analysis will span multiple posts and that many details will be published separately due to time and space constraints. Data about platforms, sales, profitability and pricing will be posted separately.

    All data sets and chart data will be available for interaction and download through Asymco Interactive when complete. You can purchase a license to Asymco Interactive anytime and you will have access to any new data sets for next 90 days so don't hesitate to pre-order the report.
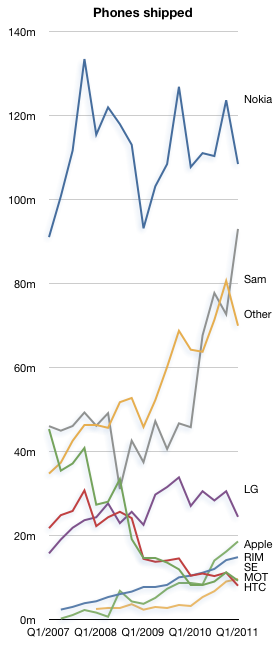
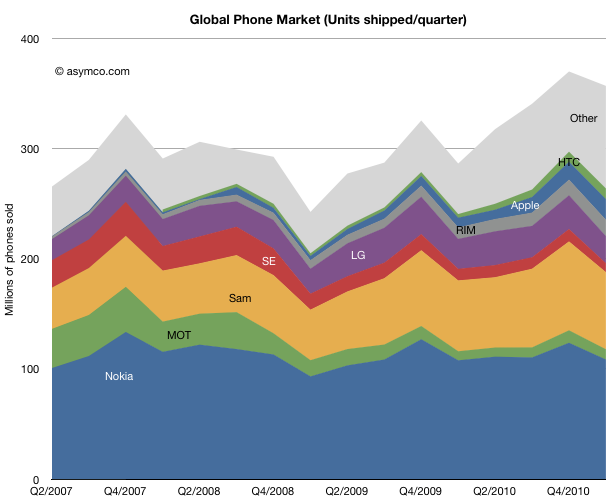
    The overall phone market grew at a compound rate of 9% over three years. The pattern of entrants focused on smartphones and mobile computing growing faster than the incumbents continues. The compound three year unit growth for the tracked vendors in descending order is:

    1. Apple 122%
    2. HTC 55%
    3. RIM 50%
    4. Samsung 15%
    5. Other 14%
    6. LG 0%
    7. Nokia -2%
    8. Sony Ericsson -29%
    9. Motorola -30%

    To give an idea of the split between smart and non smart, Nokia's smart business grew at 18% compounded while its non-smart units contracted at -6% rate.

    In terms of y/y growth the market grew at 26% and the vendor ranking is:

    1. HTC 194%
    2. Apple 113%
    3. Other 103%
    4. ZTE 75%
    5. RIM 42%
    6. Motorola 13%
    7. Samsung 9%
    8. Nokia 1% (smart: 13%, non-smart -2.3%)
    9. LG -10%
    10. Sony Ericsson -23%

    Sequentially, the growth rankings are:

    1. Other 28%
    2. Apple 15%
    3. HTC 7%
    4. RIM 5%
    5. ZTE -10%
    6. Nokia -12%
    7. Samsung -13%
    8. Motorola -18%
    9. LG -20%
    10. Sony Ericsson -28%

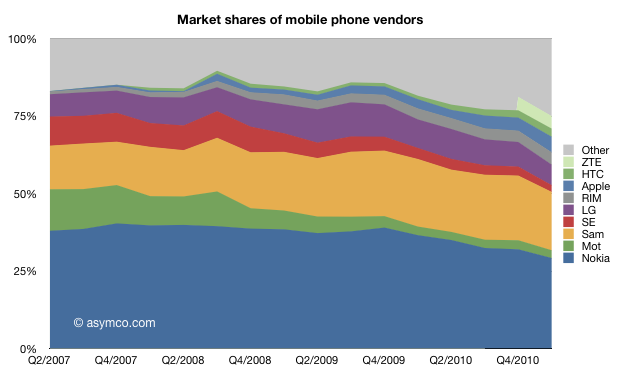
    In terms of market share, the field is becoming more crowded.
    The ranking of units shows a continuing relegation of Sony Ericsson and the increase of HTC to 7th spot. Apple reclaimed its fourth spot from ZTE.
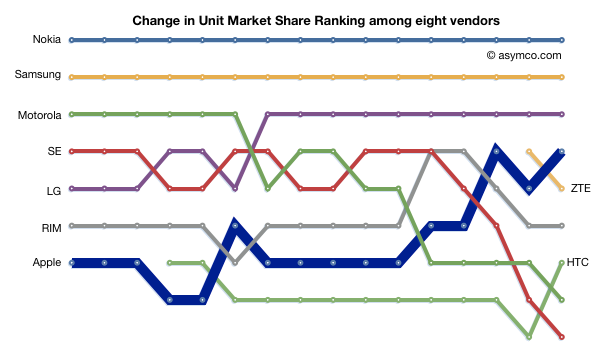
    As the number of vendors increases and the share of incumbents decreases it becomes harder to identify who is a "top tier" vendor or, in fact, what the tiers are.

    It's pretty clear that on a unit basis there are nine vendors selling significant volumes. The other important observation is that vendors like ZTE are graduating from "other" while "other" is still growing, now at 25% of the market.
  2. Measuring iPhone progress

    Research · 65 comments

    Speaking of boats, there were recent claims that the iPhone is "dead in the water". As someone who has done some sailing I can say that being dead in the water is dangerous. Not only are you not going anywhere but you also don't have steering control. It's movement through the water that allows a rudder to work so being stationary means that you can't orient the boat when waves or wind might threaten stability.

    This implied inability to gain directional control is what makes the accusation so powerful. How valid is it? That claim certainly was not made because the iPhone did not grow. iPhone grew at 113% year on year. It even grew sequentially in a post-holiday quarter and the growth is not slowing materially.

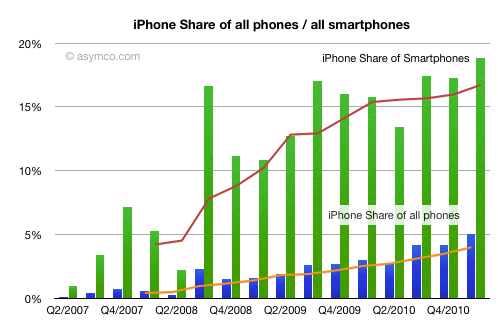
    The claim was made that iPhone was not gaining share. But share of what? If we look at the iPhone share of all phones and share of smartphones, it's still growing. It reached 5% share of all phones sold in the quarter and fourth most popular vendor in the world. Beating RIM, HTC, Motorola, Sony Ericsson and ZTE.

    So what makes the iPhone dead in the water?

    The claim was made relative to the (a) share of (b) mobile platforms (c) installed base (d) in the US. In other words, if one adds all Android phones in use vs. the iPhones in use in the US (while ignoring iOS devices other than iPhone) while the market is growing at nearly triple digit rates, then the iPhone is not gaining (much) share.

    That's the most obtuse way of suggesting a slowing product. If something is dead in the water, it isn't going anywhere or making any progress.

    On a unit basis and one the basis of vendor comparison, iPhone is doing very well. On the basis of value capture and profitability it's doing even better. More about that later.

  3. A rising tide does not lift leaking ships

    Research · 28 comments

    I've often said that the smartphone rising tide has lifted many boats. If you were selling smartphones during the last three years, your business was growing, no matter what phones you made.

    In fact, measuring success and failure was a matter of deciding what growth rate was "not good enough". Growing at 30% was nearly enough to shame some vendors into re-evaluating their strategies.

    But that sort of tidal growth can't last. At some point  ships with holes begin to sink no matter what the tide brings.

    When we look at the data from the last quarter, we should be asking again whether some ships have developed some leaks.

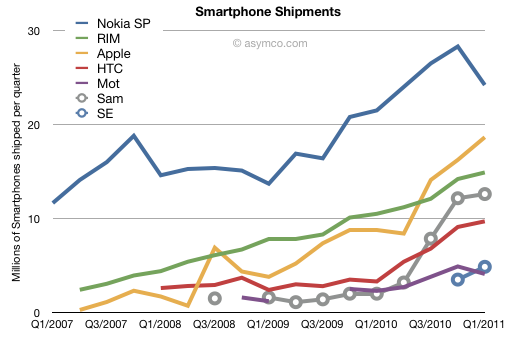
    The challenge is in eliminating seasonal effects. Q1 is usually a sequential drop for many markets. There is an unsettling drop in Nokia and Motorola and a weakening in Samsung and HTC. On a year/year basis the growth rates appear more robust for HTC and Samsung (194% and 530% respectively), but one should note the low bases they started from. Apple maintained triple digit growth (113%) while RIM sustained a respectable 42%. Motorola grew at 78% but looks weak sequentially. Sony Ericsson began to offer smartphone units and they are showing a run rate similar to Motorola but can't gauge their growth rate yet.

    Apple and RIM seem largely unaffected by seasonality but Apple is growing twice as fast.

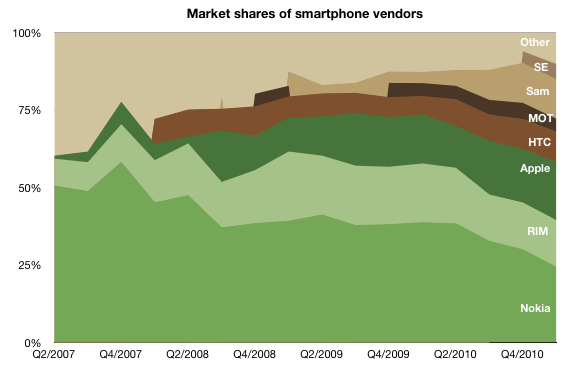
    But the biggest surprise is the drop in Nokia's volumes. There was a similar drop in Q1 2008 but the phone market was plunging into recession then and the company's smartphones moved in sync to the overall market (one with limited competition). This quarter's drop happened when the overall market is growing. The alarming thing is that Nokia's smartphone performance in Europe seems to be a big part of the problem.

    Data from IDC shows that Nokia's volumes plunged by 15% y/y in Europe while the smartphone market there grew by 76%. Apple ended up with the largest share in a region that had been Nokia's with 70%+ share. That share is now under 20%. Nokia's overall growth was a mere 13% y/y while the market grew 73%. The result is the following picture of Smartphone shares:

    But perhaps the drop should not be a big surprise. Was it due to the public execution of Symbian? Did Europeans stay away from Nokia in droves due to an aging portfolio or because they felt betrayed. Perhaps we'll never know but there is another indicator to mull over. Nokia's brand fell to 81st spot in a recent survey. It used to rank in the top 10.

  4. The market values Apple's balance sheet, not its income statement

    Research · 79 comments

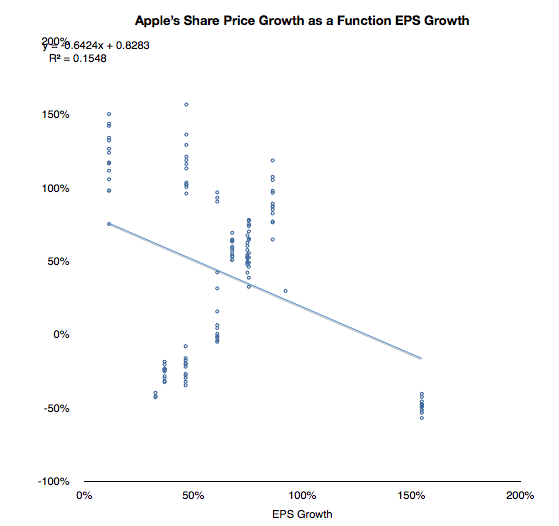
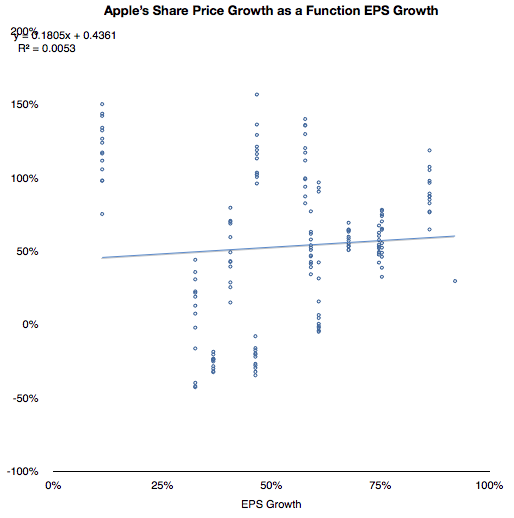
    As I have tediously repeated in this blog, Apple's share price has been de-coupled from its earnings for many years. Consistent earnings growth above 70% is not seen as valuable. As the chart below shows, there is no correlation between EPS growth and value growth.

    With the outlying quarter when 154% growth was matched by a negative 50% price change, the correlation does not look much better:

    If we cannot correlate share price with growth then what is being valued? This has been a vexing problem because growth is the traditional, and logical, metric of valuation. Share prices, by definition (net present value of future cash flows) reflect future potential. That potential is more sensitive to growth than to anything else.

    But I've been leaving one factor out of the share price definition. Share price is NPV of future cash flows plus current assets.

    Since future cash flows are being thrown out of the equation, the company must be valued as a multiple of its cash. Does this relationship hold true?

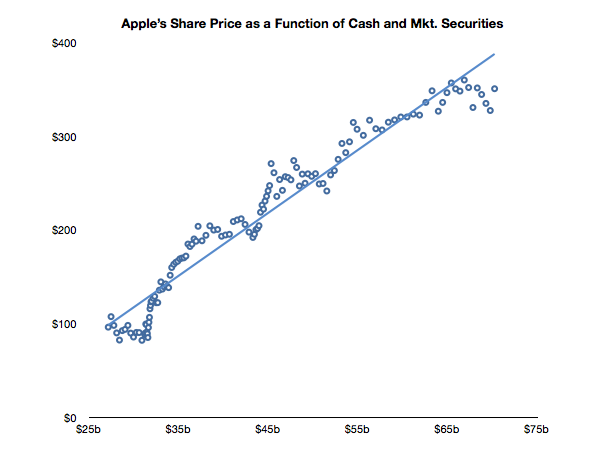
    In the chart below I show the weekly closing price of the shares and the corresponding value of the interpolated cash (and marketable securities) per share over the last two and a half years.

    A strong correlation can be observed. The R squared value is a healthy 0.94. Of course this is not to imply causation. Correlation is not causation, but it is a hint.

    Can predicting the cash per share be a strong indicator of future stock price? Perhaps. As long as this relationship holds, then having a reliable earnings model would still give us a solid predictor for the share price. Not because we can use EPS forward estimates multiplied by P/E but because we can estimate cash flows and the increase in retained earnings.

    Of course, the market "is being irrational" because it values on the basis of the present only (not its future.) But who are we to argue? This valuation has held since October 2008.

    As far as the market is concerned Apple's future is irrelevant. Its value is defined as a constant multiple of cash.

  5. When exceptional growth is not an exception

    Research · 69 comments

    Apple's last quarter's sales growth was an impressive 83%. It was not as high as the 92% earnings rise because there was a higher mix of iPhones this quarter than in the past. The iPhone is the most profitable product in Apple's portfolio so it impacts the gross margin significantly.

    The iPhone is, in fact, a huge part of Apple's business. In units it reached 5% global share and 14% US share. I'll go over the overall industry data as soon as all the major reports are in, but already it has been estimated that Apple is the largest phone vendor by profit and sales.

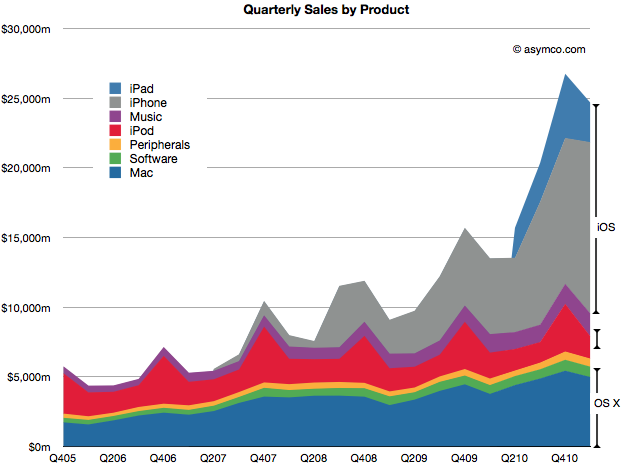
    In the following chart, you can see just how important the iPhone has become. Together with the iPad and iPod touch, iOS-powered devices make up about 65% of sales. That's almost three times the value of OS X based products which make up 23% of sales. That also leaves just 12% of sales not directly affected by these two juggernaut platforms (though music and peripherals are clearly indirectly affected by Apple's own platform products.)

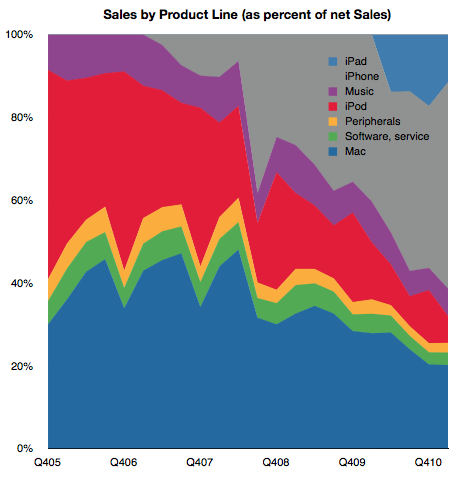
    The following chart shows the same information as shares of total net sales.

    I've read that some of the uncertainty around Apple's future prospects is driven by the perceived vulnerability of these new blockbuster iOS products. At first glance this growth looks quite unprecedented and hence risky. 65% of sales from iOS did not exist four years ago. If you look at the sector it's hard to find any company that has doubled its sales in a few years from completely new product lines. Especially a mature company over 40 years in the business.

    Well, there is one.

    If you look again at the second chart above, you'll note that the proportion of sales held by iOS devices has mostly replaced the sales share that used to be held by iPod, itself a product that did not exist four years prior to the time of these charts.

    Apple consistently doubled its sales on the basis of the iPod. It's now consistently doubling on the basis of iOS.

    Exceptional claims require exceptional evidence. But that's exactly what the investment thesis for Apple should be: Exceptional growth is no exception.

    Steve Jobs himself said it well once: "I wasn't alive then, but from everything I've heard, Babe Ruth only had one home run. He just kept hitting it over and over again."

    Even this exceptionalism is not unique. It happens not just at Apple, but at another of Jobs' creations: Pixar.

    Perhaps this magic formula for exceptionalism is itself a fluke but what if it's not. What if blockbusters are really something that can be built with repeatable consistency. What would that be worth?

  6. The Apple Growth Scorecard

    Research · 127 comments

    Apple's revenue for the first quarter was $24.7 billion, which at 83% was the largest quarterly revenue growth they ever experienced. Operating margin was an all-time high of almost $7.9 billion, representing 31.9% of revenue and yielding 95% EPS growth.

    After earnings were announced the share price reached $350.7. This includes $70 in cash. Trailing twelve months' earnings were $20.97. That makes the Price/Earnings ratio 16.7. Excluding cash, P/E is 13.4. The average growth over the past four quarters was 77%.

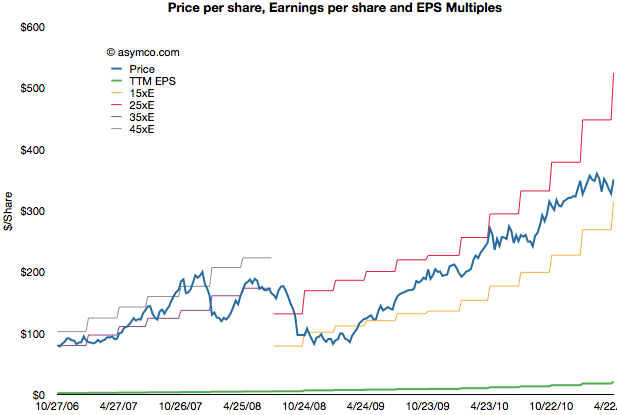
    The following chart shows the share price vs. earnings. The green line is price and the blue line is share price. I also added multiples of the earnings to show how the stock traded in certain multiple bands.

    During the period of 2006 to 2008 the company shares traded roughly in a range of 35 to 45 P/E. Since late 2008 the company shares have traded in a range of 15 to 25 P/E.

    Share prices normally reflect potential earnings growth and past growth is often a good indicator of near term continuing growth. This is why the P/E is usually a proxy for growth. The faster the growth, the higher the P/E. Or so one would think.

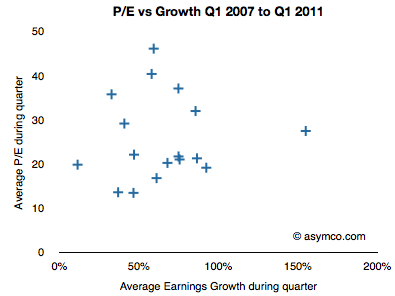
    If we look at the P/E vs. earnings growth for Apple, the picture is not encouraging.

    P/E and Growth don't seem at all correlated. In fact, if we drop two outliers it almost seems that P/E is insensitive to growth.

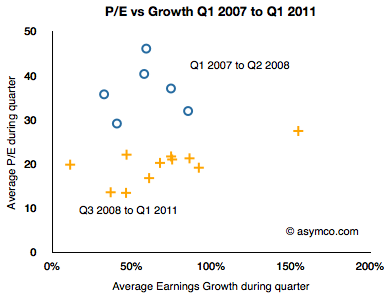
    I took the data a step further and separated it into two clusters: pre-recession and post-recession.

    The blue circles are Q1 '07 to Q2 '08 and the orange plus signs are Q3 '08 to Q1 '11. As the share price chart implies, there is a clustering of averages where during the 2007 and early 2008 period P/Es were in the 35 range while growth was in the 50s and P/Es below 20s with similar or higher growth ranges.

    As the following scorecard shows, the company's growth is exceptional. That does not seem to be something that is being valued by investors.


  7. If Cash is King, Apple's is an Emperor [Updated]

    Research · 84 comments

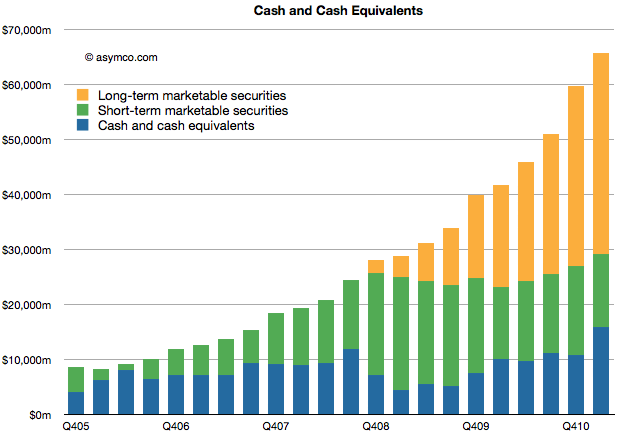
    Apple's cash for short-term and long-term marketable securities totaled $65.8 billion at the end of the March quarter. Cash increased by $6.1 billion.

    The increase in cash is net of approximately $900 million for prepayments and capital expenditures related to the strategic supply agreements that Apple announced last quarter.

    The following chart shows the historic cash, short-term and long-term liquid assets Apple holds.

    As in previous quarters, the securities Apple holds are:

    • Cash
    • Money market funds
    • U.S. Treasury securities
    • U.S. agency securities
    • Non-U.S. government securities
    • Certificates of deposit and time deposits
    • Commercial paper
    • Corporate securitiesMunicipal securities

    Although the asset classes are all liquid, those with longer maturity dates are classified as "long-term" securities (orange area in chart above) and are often not counted as "cash" in many financial databases.

    The enormity of the overall size of this cash can be put into several perspectives:

    • The funds are big enough to place Apple's CFO office in the top 100 largest fund managers in the world and larger than any hedge fund manager.
    • Cash growth in one quarter was higher than the market cap of many companies. For example, if pre-payments were added back, the cash increased by about the market cap of Motorola Mobility.
    • Current cash is worth more than Nokia, RIM and Motorola Mobility's market caps, put together.
    • Apple's cash is worth half of Google's enterprise value.
    • About two years ago, in January 2009 the stock traded at a price of $78 with at least one analyst placing a target of $70 on the stock. Today Apple's cash is worth $67 70/share.
    • If you owned $100,000 of Apple stock, $19,000 of that would be cash and only about $80,000 would be "at risk" capital.
    • If Apple had no revenues, the current cash would sustain operations (SG&A and R&D) for over 7 years or until the middle of 2018.

    When analysts cite limits to the rate of Apple's growth on the basis of the "law of large numbers" I wonder if there is an implied limit to how big this cash pile can grow. By looking at the chart its size seems to be growing faster all the time.


    [Updated] The cash per share figure was wrong. It is $70/share.

  8. Apple Earnings: Evaluating my performance

    Research · 24 comments

    As chronicled here, this quarter I went through three sets of estimates. This is a departure from my standard practice of sticking with one forecast made three months in advance. I felt last quarter was filled with materially important developments which deserved updating.

    So how did I do?

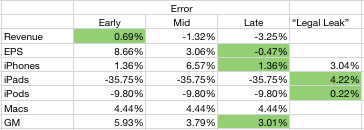
    I wanted to see if the additional information helped or hindered predictability so I put my three predictions side-by-side and measured the errors. I also added the "legal leak" from April 15th (published April 19th) to see whether it was an accurate predictor. The table below shows the error rates with the lowest error highlighted.

    It's clear that my error rate decreased as new information was used. It's also clear that the "legal leak" was very accurate. What follows is a discussion of each line item.

    The iPhone forecast was very accurate both early and late in the quarter. At 1.36% error it was even lower than what was leaked by Apple. I used the information about China and Verizon to boost sell-in and increased the growth rate to 110%. That proved to be the right call. I did not pay any attention to talk of component shortages as I did not consider them to affect Apple whose market share of devices is so low. I would score my "late" estimate as an "A".

    Even though I disclaimed it, my iPad forecast was very inaccurate. In contrast, the leak was very accurate. Although mitigated by the higher sell-through (5.1 million) shipments were constrained by the change in product. Details like the date of shipment, the date of announcement and the ramps made this a particularly difficult transition to predict. At 36% error, I score it as an "F".

    The iPod error was about 10%. That's mediocre. The product dropped in sales by 17% (vs. 10% expected). Again, the mitigating factors, like higher mix of iPod touch and thus increased prices helped to keep the financial performance decent. I score this as a B-.

    The Mac prediction was accurate. The error was less than 5%. I will discuss the Mac business in a separate posting but it suffices to say that the growth was excellent but predictable. I score my prediction as an "A-".

    Revenues were reasonably predictable however pricing seems to have been affected by exchange rate volatility. The iPhone turned out to have a huge average selling price ($660) which made up for the lower revenues from iPad. The error of 3.25% is acceptable. I score it as an "A".

    The Earnings number was very accurate. The error for the late estimate was less than one half of one percent. This bottom line number is a function of all the other numbers so it's the most encompassing. You have to account for factors like interest income, changes in the number of outstanding shares and tax rates. None of these are predictable. However, I was lucky. With an error below 1%, I rate this as an "A+".

    My overall performance as a grade point average would be 3.43 or B.

  9. iOS vs. Android: the tale as told by Wall Street

    Research · 90 comments

    Yesterday I wrote about the growth in Android vs. iOS. The two platforms' can be said to be enjoying healthy growth, though in markedly different patterns.

    The consequences of this growth are being felt across the telecom and computing industries. There are almost 300 million platform devices in use today that were not even dreamed of three years ago. Operators are transporting petabytes more data and dozens of phone vendors are scrambling to meet demand. There are tens of billions of app downloads and hundreds of thousands of apps being sold by tens of thousands of new app publishers. There is a lot of hay being made while the sun shines.

    But what about the poor saps that are funding the development? What about the shareholders of the companies behind these platforms. Are they being rewarded or punished?

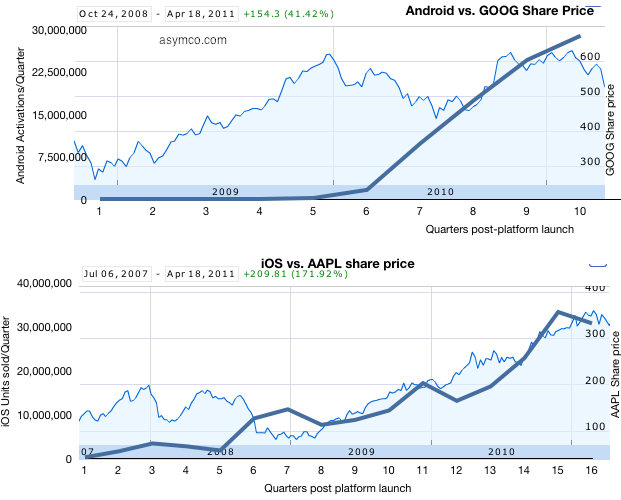
    The following charts tell the story:

    I took the platform growth data published yesterday and overlaid it on the share price data (source: Google finance). Each plot begins at the point in time when the respective platform was available in the market and ends today. There are two vertical axes: the left side axis shows "activations" or units sold and corresponds to the thick blue line; the right side axis shows share price and corresponds to the area chart. Overall date range and growth in share price is shown in the upper left corner.

    What can we interpret from this superimposition?

    1. Both Apple and Google shareholders saw share price appreciation during the two platforms' histories. Apple shareholders benefited more (+172% vs. +41%)
    2. Apple's share price appreciation seems highly correlated to iOS growth but Google's doesn't. Google share price had dramatic growth during 2009 while Android was moribund and was flat to down during 2010 when Android growth was explosive.
    3. We can also interpret the difference as Google's fortunes being far less dependent on mobile platforms than Apple's. Google has been subject to selling pressure this year due to corroding cost structures irrespective to platforms growth. Conversely, Google may not benefit from mobile computing as handsomely as Apple.

    Correlation is not causation and clearly there are many factors at work in share price changes but I think it's fair to say that Apple is obtaining fuel for growth with iOS while Google is in a more precarious situation with mobility--partly benefiting but partly threatened. The market behaves in bizarre ways in the short term but in the long term one can see logic and reason.

  10. The Android step function

    Research · 40 comments

    There is precious little data on Android units sold. There are estimates but no actual summary. Google themselves don't seem to know as they don't report sales, preferring to report "activations."

    Assuming that activations means "unique activations of new devices" then we can draw some equivalency between Google's reports and the reported units of iOS sold. There is some uncertainty with respect to iPod touch units, but that is not very big (estimates are drawn from Apple's reporting of overall iOS units at several points in time.)

    To estimate Android, I took the download rates currently available and placed them in the month when they were published. I then interpolated the data monthly and quarterly.

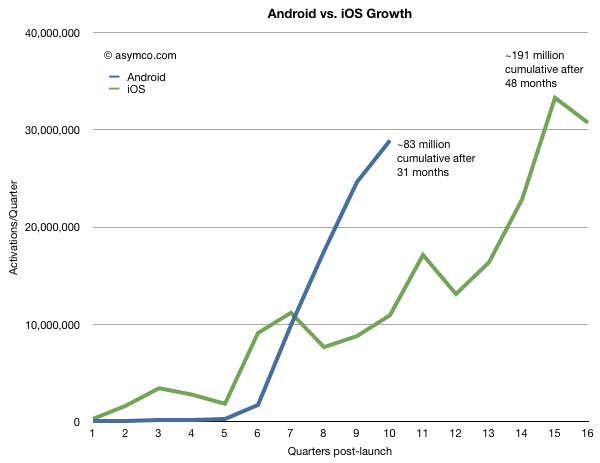
    To make the comparison more valuable, I chose to index the starting point at the launch of each respective platform and plot quarterly units (or activations). This way we can observe how the platforms ramped in growth and where they were at similar points in their lifetimes.

    The following graph results.

    There is likely to be more seasonality in Android data than is shown, but the impressive thing is that Android is running at three times the equivalent adoption rate for iOS at similar points in time. In fact Android is being "sold" as rapidly as iOS today even though iOS has been in the market about 15 months longer.

    Overall, cumulative units sold for iOS are still about twice as many but if Android will continue to grow as rapidly as it does now, it will likely overtake iOS in installed base in less than a year.

    One should be careful about drawing conclusions that this implies effective competition. Both platforms are growing very quickly. iOS is growing at at least 100%/yr and Android's second year was 65x bigger than its first. iOS growth is limited by the ramp rates of a limited portfolio of products. Android growth is limited by how quickly vendors can bring out products. Neither platform is demand constrained and hence they are competing for share of growth not for share of a fixed pie.

    Extrapolation is a dangerous game, but the chart above shows some predictability in Apple's curve whereas Android has a "step function" or discontinuous feel to it and that's a curious thing.

    Not so much for its lack of predictability but because it's so asymmetric to iOS.

    A dictum of classical physics states that in nature everything is continuous. However, in quantum physics everything is discontinuous. Both models of the physical universe have their uses.

    It should be noted that both business models represented above can also co-exist, at least for the foreseeable future.

  11. Divinely inspired analysis

    Research · 103 comments

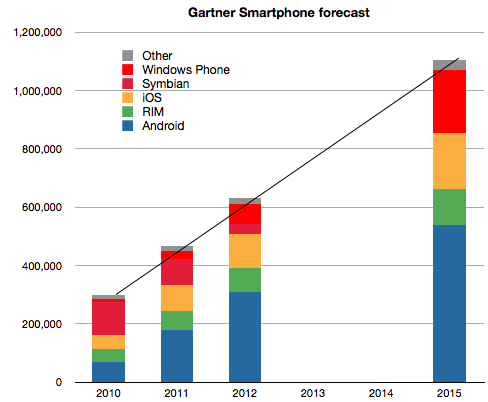
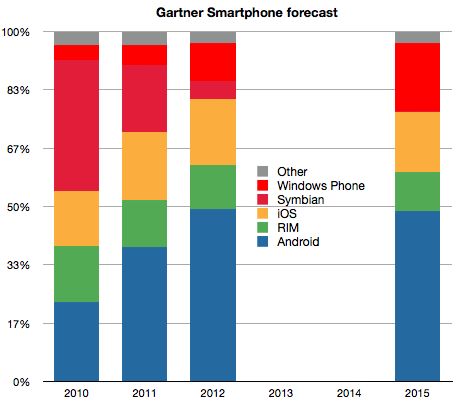
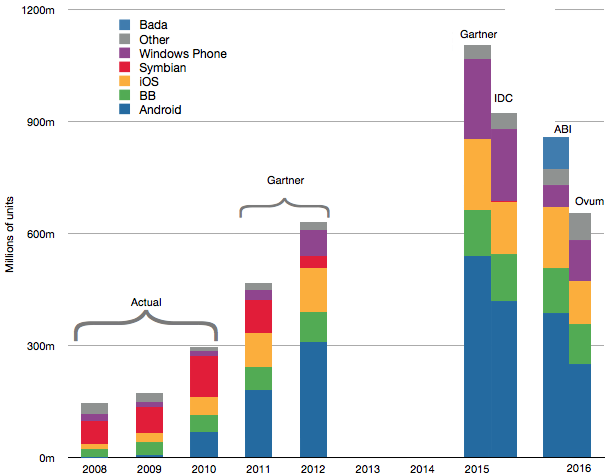
    Three things stand out from Gartner's latest smartphones forecast:

    1. They published a four year forecast with seven significant digits of precision (implying a margin of error of 0.00001%).
    2. There is a linear growth in total market size.
    3. There are no significant share changes after 2012.

    The latter two claims are illustrated below:

    Notwithstanding the defensibility of these claims Gartner analysts makes some further assumptions (quoted verbatim).

    1. "Apple will be interested in maintaining margins rather than pursuing market share by changing its pricing strategy"
    2. "RIM’s migration from BlackBerry OS to QNX which is expected in 2012"
    3. "Nokia will push Windows Phone well into the mid-tier of its portfolio by the end of 2012"

    These assumptions may be valid, but from where I'm sitting, the first assumption contradicts Apple's COO, the second would be an engineering marvel and the third would be an organizational miracle.

    Putting together all the long term forecasts with what is already known about the market history gives the following combined forecast.

    At the risk of repeating myself, the only thing I can summarize from this collective wisdom is that the over-riding assumption in forecasting seems to be that the future is an extrapolation of the present. That would indeed be a miracle.