Prices provide accurate, independent signals about where, when, and how to create and deploy value-creating innovations. The mechanism of free markets signals what should be rewarded and what shouldn't. When comparing competitors, prices are the best indicators of differentiable positioning.
However, prices are sometimes anomalous and subject to transient market conditions. It's therefore important to observe pricing over a long time frame.
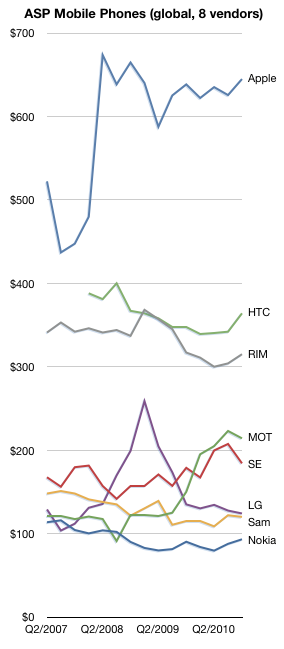
This chart shows the average selling prices for all phones sold by the eight publicly traded phone vendors (covering approximately 70% of the market) since mid-2007.
There is remarkable stability in the pricing of the competitors. One could argue that only Motorola and LG saw significant swings in price. (Apple's instability in 2007 was due to the revenue sharing deal for the 2G iPhone on AT&T).
Motorola pared down its portfolio (and its market share) and as a result has seen a doubling in ASP. LG had a rapid rise and rapid fall as its feature phone business boomed and busted.
But otherwise, pricing trends are subtle: down from Nokia and Samsung. Slight decrease for RIM and HTC and stable for Apple. In a future post I'll dive into the relationship between pricing power and share.
The mobile phone market is growing rapidly. It grew 18% in the last quarter. The smartphone market grew even faster, about 75%.
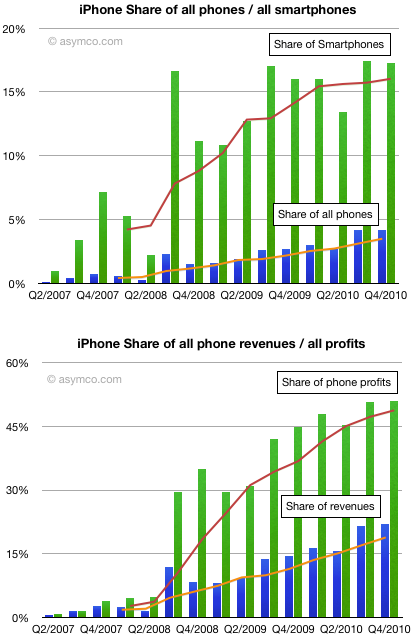
To grow share in this market means growing even faster than the market. What we can see from the following charts is how the iPhone as a product grew in share since it was launched 3.5 years ago:
Unit share growth slowed in the last quarter but the fourth quarter is not usually the most expansive for Apple. That is usually the third quarter which is the first full-availability launch quarter.
The iPhone ended the quarter with 17.25% smartphone share and 4.2% phone share. Share of revenues was about 22% and share of earnings was about 51%.
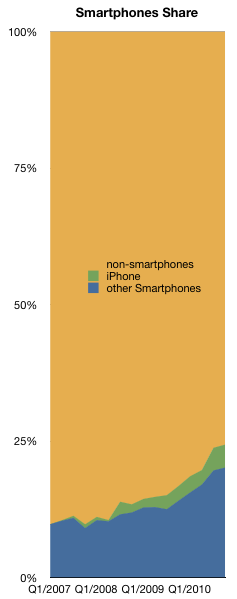
I still hold that 20% smartphone share is possible for the iPhone. As the smartphone market slowly becomes the entire phone market (see chart to the left) that share will be worth something.
Yesterday I made my predictions on Nokia's new platform strategy. They should be treated as pure guesswork, but they are informed guesses. I based them on public information.
That information comes in the form of statements from Nokia's CEO at the earnings call. I made a table of all the statements that dealt with platform decisions and my interpretations of those statements.
You may do your own interpretation, but to me there is significant evidence here to support my predictions.
What Elop Said
My interpretation
In certain markets where there’s a greater preponderance of competing platform devices, we have some competitiveness problems
We have problems in the US
Broadly the conversation about operating system and positioning of relative operating systems in different places is something that we'll reserve for the February 11th meeting,
Different markets require different operating systems
The general comment I’d like to make though is that in today’s world it is the case that given the different price performance characteristics of different chipsets, we get into situations, where the best experiences are not necessarily delivered by systems that are capable of delivering the highest end experiences. We have to be very mindful at what level of the price curve we deliver what type of device with what operating system.
Different price points require different operating systems
When I think about geographies, the area, I've mentioned this indirectly during my comments, but I'll be more precise in answering your question and that is clearly, there is a pattern of disappointments in the United States. A pattern there where efforts have been made, competitiveness, challenges exist and we very much need to address those
We have problems in the US. We're going to address these.
That's why I characterize very clearly in the framework for the decision making ahead, that whatever the strategy is that we outline on February 11th, we very clearly will be ensuring that it gives us the opportunity to reopen doors in markets such as the US and some others where we have not recently been present
We are going to enter the US with this platform
With respect to the question of ecosystems and so forth, it's important to note, in my opening comments, I referenced the fact that there are today different ecosystems and different patterns at play
Different OS for different markets
If you like the high-end ecosystems where there is particular rate of momentum and share gain taking place. At the same time, the dynamics at the very low end of market which itself is an ecosystem of sorts, is very different with very different demands and expectations
High end and low end require different OS
I'll just offer that observation that today broadly in the world without any specific comment on us or our competitors, there are multiple ecosystem patterns that need to be considered
More on the need for multiple OS
I'd also point out that very critical in whatever combination of ecosystem or ecosystems or whatever our strategy outlines, the need to maintain sustainable differentiation between ecosystems and within the ecosystem relative to our competitors in that ecosystem is a top priority. In everything we consider, that’s something that will be very much on our mind.
What we chose gives us some degree of differentiation--It's possible concessions were negotiated
With respect to comparisons to other ecosystem shifts and things like that, the real thing that one must focus on is the quality of products in the market, the momentum that one already has
Symbian is not going to disappear
As we’ve described the Symbian momentum that we have today; a consideration of shift of ecosystem, certainly you have to consider that potential of market share changes
Symbian will lose share
With respect to the ecosystem comment, without getting into specifics of different options and things like that in detail, what I will say is that the word catalyze is to imply that there is a wide variety of participants in our world, and that includes competitors, it includes operators, other technology firms and so forth who in many respects have a common interest relative to the potential strength of other ecosystems and how they may develop over time
Partner is a tech firm that has common interest -- i.e. market entry
The catalyst of an ecosystem could be considered as making sure the right conditions are formed in the right companies, work in such a way that alternatives emerge in a marketplace that may not exist today
Looking at growing the market for the partner-- Microsoft
We made a decision to not proceed as people have thought we would proceed
This is not going to be business as usual
You'll see that pattern of decision making from us in terms of being very crisp about what constitutes great experiences and ensuring that that is what we are delivering to our customers.
This is a marketing-led effort. We're going to stay on message and not waffle on about technology
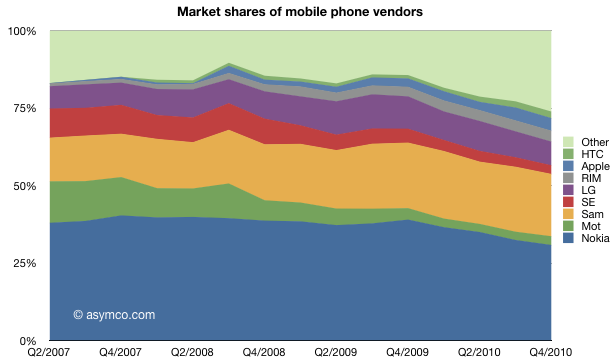
The trend toward ZTE, Huawei and others taking volume share from the traditional incumbents continues. Smartphones continue to capture value share. Dedicated smartphone vendors HTC, RIM and Apple would make up the third biggest single vendor, starting from a very small base.
Looking over this three and a half year period, the change in the market is quite dramatic.
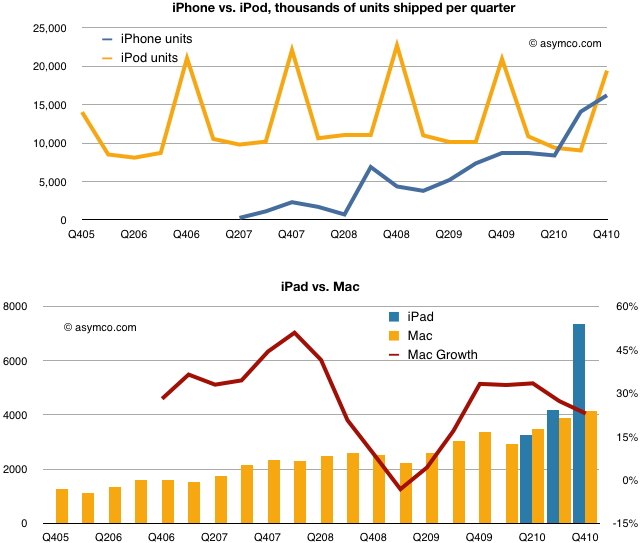
The iPad and iPhone came, saw and conquered new markets. But since the products launched the question on every analyst's mind has been on how much have these products "cannibalized" their brethren the iPod and the Mac.
This notion of "cannibalization" applies when a product is designed to compete and "eat" the share of another product in a company's portfolio. It has some negative connotations since it implies loss but many times the thinking is that it's better to cannibalize oneself rather than have it done by a competitor.
But have iPhone and iPad taken share from their competitors?
The following charts compare the total units of iPhones vs. iPods and iPads and iPads vs. Macs.
The evidence does not show cannibalization.
Although both iPhone and iPad have crossed over and are selling more units than their internal competitors, the old guard has not faded away.
Indeed, the Mac shows resilience and the iPod, although not growing in units has maintained sales value. What we don't see is a clear gain for the entrants at the expense of the incumbents.
We can't be sure how long this happy co-habitation will last, but for now the new products are fine and young but not cannibals.
As shown in the Apple growth scorecard, the company's earnings growth is continuing at 75% with the top line increasing at the annual rate of 70%.
The $59 billion of cash on the balance sheet has reached the equivalent of $64 per share yielding an enterprise value of $263 per share based on closing price of January 21st.
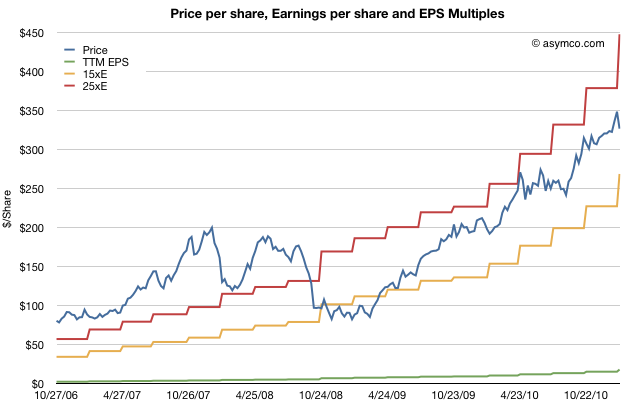
The stock price has been rising but not outside a narrow P/E band. The following chart shows the stock price and the 15 P/E and 25 P/E bands that have bounded it for nearly three years.
As previously observed, this overall share appreciation is not accounting for the growth in earnings.
The trailing twelve months' earnings were $17.91 per share. Therefore the P/E ratio is now 18.2. Excluding cash, the P/E is at 14.7. However, that's based on 2010 levels of earnings. Those earnings are increasing very quickly.
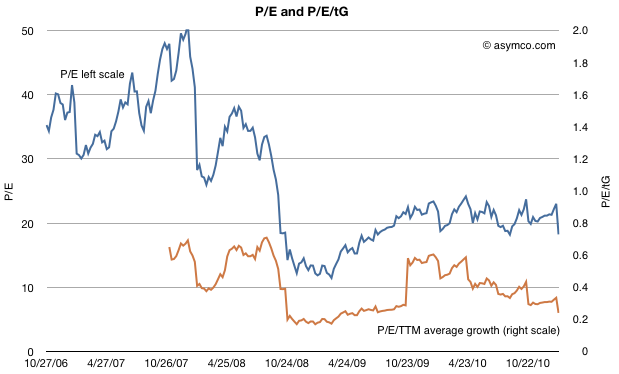
To account for earnings and their growth, I developed the following chart which shows the P/E and P/E/trailing-Growth for the stock.
The P/E is fluctuating on either side of 20 but when considering trailing growth, comparable companies, the macroeconomic conditions and guidance the value of the company is reaching new lows.
P/E/tG nearing recession lows
Earnings were 75% higher in 2010 than the year before. So based on the growth, the rule-of-thumb ratio P/E/trailing Growth (P/E/tG) is 0.24. This ratio (where 1.0 is seen as "fair value") is the lowest since July 2009, during the first months of recession recovery. The trend for this ratio is down (see the burnt orange line in the chart above). It's not far from hitting the lowest point during the recession at 0.17.
Now I'd like to reminisce a bit about that point in time. The stock had bottomed at $78/share[1]. It was trading at barely 3x cash and a P/E of 11 but growing 3x that level (32% in the slowest recession quarter but averaging much higher).
So today we are at a similar point in valuation. The cash is at $64/share, shares are priced 5x that amount and the growth is 4x P/E[2]. Although analyst targets are less comical, there is still the sense of extreme despondency when looking at the valuation ratios.
Guidance, Comparables and Macroeconomics
Unlike two years ago there aren't the same dark clouds on the macro horizon. The company is also not as cautious on its guidance (guiding 63% EPS growth must be a new record for a post-holiday quarter) and there is talk of bubble in valuation for comparable companies. Netflix, Amazon, and ARM have eye-watering valuations relative to growth.
A discount to the S&P 500
And to round out the tragic tale, Apple's P/E is, once again, at a discount to the S&P 500 P/E (14.7 vs. 16.57 respectively).
Given the new low in valuation contrasted with optimism on behalf of many (including management), on some forums there is discussion about Apple becoming the target for a take-over.
There is some perverse merit to this logic. With $64 in cash, $25/yr in earnings and 75% growth it's so cheap that if credit were available, it would make a tempting candidate. Private equity could take it private and use the gigantic cash flow to pay off debt (in about four years). In bygone days, this would have been an easy pitch.
Alas, the capital markets may not have liquidity for the size of the market cap Apple holds and I don't see any competitors able to get the leverage for an acquisition either. Or can they?
---
Notes:
In early summer 2009 some analysts put 12 month targets for the stock at $70, so their predictions were within $6/share to today's book value.
A buyer of shares two years ago would only have to wait two years to have 80% of their investment sitting in retained earnings. An investor who read the data from Apple and knew that the iPhone existed could not fail but be amazed.
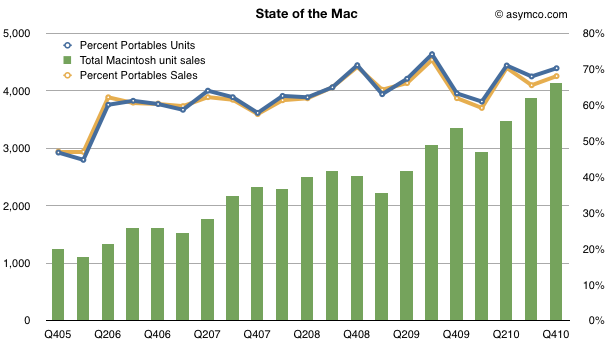
Apple set a new record for Mac sales in the fourth quarter. This was not a surprise. The growth was perhaps a bit lower than some expected (including me) but it was still a healthy 23% and 8x the PC growth rate. The Mac has outgrown the PC (and hence has gained share) for 19 quarters straight, nearly five years.
What's more interesting is where the growth came from. Every region outgrew the market. Asia-Pacific led with a 67% year-over-year increase, almost 10x the market. Japan grew at 56%, which is about 6x the market, and Europe and the United States both grew in double-digits despite both markets contracting overall.
Looking over a longer time frame, the Mac has nearly quadrupled in volume in five years. In the last quarter of 2005, Apple sold 1.2 million units. In the latest quarter it sold 4.1 million. So the performance has been relatively good.
One significant reason for the growth has been the shift from desktop to portables. The lines show how the percent of portables went from about 50% to 70% of units and sales in four years.
[hang1column]
[/hang1column]
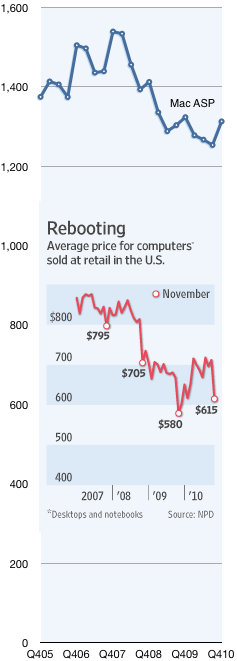
But what was surprising was that the average selling price increased to $1,313, up from $1,253 and nearly even with last year's $1,324.
Prices in the PC industry tend to fall. Actually, to be more precise, they tend to collapse. Compare the Mac's price trend with the rest of the industry as seen in the chart to the left[1]. It shows the Mac Average Selling Price which is what Apple books from selling into the channel vs. the retail price of PCs in the US.
The chart tells a partial story. The PC figures are retail while the Mac figures are wholesale. Furthermore, the PC figures include Mac, so stripping out the Mac would show the PC prices to be even lower. Lastly the Mac figures are global whereas the PC figures are US only.
But what I want to focus on is not the absolute difference, rather the relative value difference, which is diverging: The average PC went from $795 retail at the end of 2007 to $615 in November 2010. That's a drop of 22%. In the same time frame the Mac went from $1,539 to $1,313 wholesale, a drop of 15%.
In other words, the Mac price premium at the end of 2007 was at least 93% and it now is at least 114%.
So here's the real surprise: How does the Mac gain share while increasing its price premium over the PC?
The only answer I can offer is what I already wrote on the Mac in November:
...something changed with PCs when the laptop became “good enough”. With portable computing, the job the PC was hired to do evolved. It was more important that the product be well designed (for aesthetic value, usability and reliability) than just fast and spacious. The microprocessors were plenty fast but what mattered more was low power consumption, a low profile and tighter integration with software.
In other words, computers became re-integrated. You only need to touch the MacBook Air to understand why.
----
Notes:
The inset chart comes from The Wall Street Journal using data from NPD. The Mac data comes from Apple financial reports.
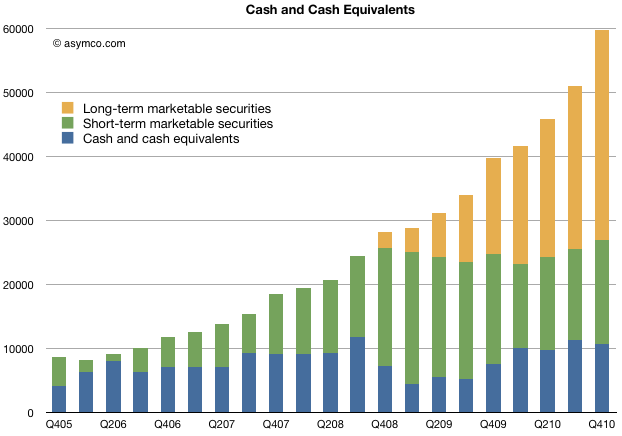
The following chart shows the value of Apple's cash and cash equivalents for end of 2010:
This represents $64/share (current price per share is about $340, making the enterprise value about $276).
The company was trading at $64 per share in July 2006.
Here is a list of iconic companies whose market cap is less than Apple's cash.
Visa Inc. $59.63b
American Express Company $55.8b
The Boeing Company $53.16b
Morgan Stanley $43.5b
The Dow Chemical Company $41.8b
NIKE, Inc. 40.22b
Eli Lilly & Co. $40.12b
Texas Instruments Inc. $40.92b
Nokia $39.92b
News Corporation 37.72b
I would also make note of the trajectory of the cash. Growth is accelerating. The last quarter Apple added $8.7 billion in cash. A year earlier it added 5.8 billion and the year before that $3.6 billion.
The amount of cash added is more than the amount of cash the company had five years ago.
In 2010 the company added $20 billion to its cash reserves. In 2009 the company added about half that amount.
If the trend continues, Apple could see $100 billion in cash by this time next year. That's about what HP is worth now.
Thanks to David Chu for forwarding the data that made this possible and reader Narajanan for spotting the divergence in platform efficiency.
iOS and Android are both growing rapidly. According to Gartner, during the first three quarters of 2010, about 44 million iOS devices and 36 million Android devices were put into use. That's 80 million devices. An amazing achievement for two platforms that did not exist 3 years earlier.
But obviously not all devices are used the same way. Devices which have unused capabilities limit network effects for a platform and for the category of product in general. Question is: how can we measure the "smartness" of a device; how much more likely is a device to be used as a mobile computer vs. being a regular phone?
The best proxy I can think of is a measurement of browsing use. The smarter the device, the more browsing is a joy and the more it is actually done. Browsing leads to more data load on the network and creates a virtuous circle of revenues for the mobile computing value chain.
If we could measure the increase in browsing generated by each additional phone, we could compare whether one platform is better (specifically, more efficient) at generating value asymmetric to voice.
Fortunately we have data from Netmarketshare.com (see sources below) which attempts to track browser consumption and hence allows us to measure this variable. What we need to pair that with is the incremental increase in the installed base of devices.
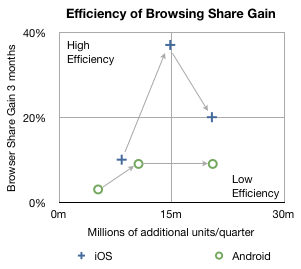
In the chart below I plotted how much browsing share increased for every phone sold by platform over the first three quarters of 2010.
The arrows indicate the sequence in time from Q1 to Q3. The vertical axis shows gain in share three months after the corresponding number of units shipped in the previous quarter on the horizontal axis. So, for example, the second circle means that in the second quarter approximately 10 million new Android devices created a gain of about 9% in browsing share. In the same quarter, 14.8 million iOS devices created about 37% gain in browsing share.
In the third quarter approximately the same number of iOS and Android devices shipped (iOS including iPads and iPod touch) but the browser gain was 20% for iOS vs. 9% for Android.
A line drawn diagonally from lower left to upper right (0,0 to 30m,40%) could represent the average gain in share per units sold--the sort of measure we're looking for.
Measuring that slope tells us that, on average, every million devices sold should generate a gain of 0.75% share[1]. I took the additional step of labeling two quadrants which are orthogonal to the expected trend. If browsing increases dramatically faster than 0.75%/million units then I call those devices sold as creating "highly efficient" browsing gain. If browsing increase lags dramatically below 0.75%/million units then those devices added share with "low efficiency".
So four data points follow the trendline down the middle of the chart, however, there are two notable outliers. Finding the causes for these outliers gives clues to what's happening with the platforms.
I believe the explanation for iOS's second quarter's extraordinary efficiency is that was the quarter when the iPad launched. It seems to have yielded a very strong spike and the trajectory of iOS improved even into the next quarter as those iPads continued to be in use. iPad seems to be a very effective way to gain browser share.
I also believe that the cause for Android's fall in efficiency in the third quarter was that it began to be sold in large quantities in the developing world. The third quarter saw a rapid acceleration of sales without a proportional increase in what was measured as sales in the US (and Europe).
Interpretation
If this trend continues, and there is no guarantee that it will, then a question could be raised about Android's value to, of all people, Google.
The core value of Android to Google is the increased use of browsing and hence search. All the other Google services and in-app ads are tiny opportunities in comparison to the potential of search on mobiles. One could argue that the raison d'être for Android since day one was to create browsing consumption. In that regard it's not as good at doing that as iOS is.
Perhaps Google can justify the under-performance of consumption of browsing (and hence search) on Android devices as benign since there is no marginal cost added to supplying Android to non-consuming devices.
But I wonder. There is the problem of opportunity cost: Those iOS devices that create more browsing activity are going to take more share. The more they do that the more Google will have to pay Apple for placement as the default search in mobile Safari.
It may be a stretch, and perhaps the data is wrong, but that's what this exercise is all about: how much can we learn from fragmentary data? Without a hypothesis there is no discovery.
-----
Notes:
Since these platforms have very low shares (less than 2% for iOS and 0.3% for Android by November) almost all the gains can be assumed to be against other browsers (e.g. Internet Explorer) and not against each other.
Update: the original Unit estimates excluded iPad and iPod touch which have since been added.
According to GfK data in Denmark, during the first quarter of 2010 29% of phones sold were smartphones. In the second quarter, the share grew to 37%. In the third quarter, 51% of units and 71% of sales value was captured by smartphones.
Looking at September alone, Apple's share of the smartphone market was 34%. In terms of value share, 51% of all the dollars that consumers spent for smartphones, was spent on the iPhone.
In other words, in September in Denmark, iPhone captured 34%*51% = 17% of all units and 51%*71% = 36% of all mobile phone sales.
Rob adds:
iPhone 4 is now available on all (4) major networks in Denmark. iPhone 4 has not been advertised very heavily, whilst Android has received a lot of advertising. My experience travelling on public transport in Greater Copenhagen is that iPhone is everywhere, whilst Android and Blackberry is less prevalent.
To get a sense of how that compares with the global average, in the third quarter Apple's unit share was only 4.1% while sales share comes to about 17%. Seems like there is plenty of room for growth.
While Denmark is a small country (population: about 5.5 million) and it's not likely to reflect global patterns, it has been rated the happiest place on Earth.
In a recent but recurring lament I asked why Apple shareholders are not being rewarded for the company's growth. I pointed out that there is no fundamental reason why the company should receive such a low P/E multiple (about 18 ex-cash trailing and 10x forward while maintaining 70% earnings growth for over a year).
There were many objections in the comments. Most of them dealt with recent reasons why doubts might have arisen among investors: Android hegemony or some perceived lack of competitiveness leading to margin compression or some macro hangover from the recession.
In this article I argue that none of these objections hold water. My argument hinges on the fact that there is a precise date when Apple ceased being seen as an exceptionally valuable company and that date precedes any of the causes being suggested.
The day of disillusionment was almost exactly three years ago: January 14th, 2008.
How to pin down the date of disillusionment
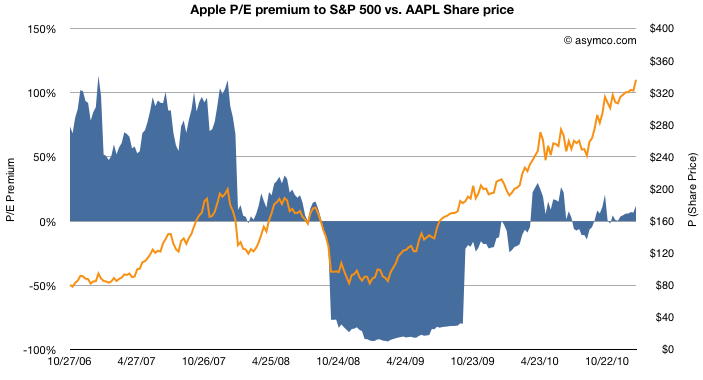
Consider the following chart.
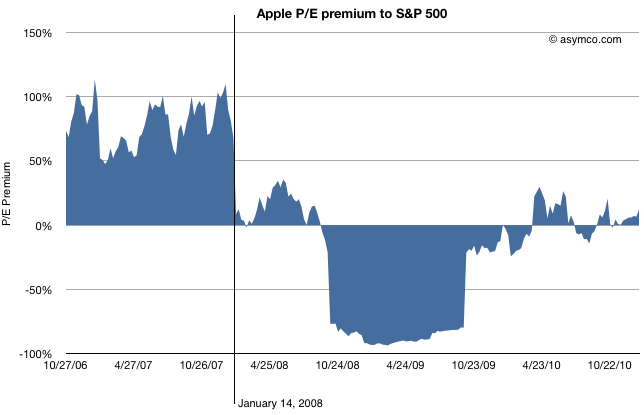
The blue area represents either a premium (above 0) or a deficit (below 0) of Apple's P/E (ex-cash) relative to the S&P 500 P/E. This is a re-imaging of a chart, first introduced in June 2010 when I first pointed out that Apple was being discounted relative to the S&P 500.
By measuring P/E I am focusing not on the stock price, which has grown nicely, but the ratio of the price relative to earnings, which hasn't (see the next chart below). P/E is a fundamental measure of potential (its reciprocal is the stock's earnings yield.) It is usually highly correlated to the company's growth. If that P/E is uncorrelated to past growth, there is some significant discounting of future growth. It's the most significant (and simplest) measure of "faith" in a company.
By measuring the company's P/E relative to an index of other large companies (S&P 500 P/E) we can assess whether the company's potential is being valued as extraordinary or whether it's being valued as ordinary. In other words we are measuring whether a company is "special".
The chart shows that until January 14th, 2008 the company was valued at a significant earnings premium--a P/E consistently 50% higher than the norm.[1]
Following the collapse (about 40% drop in share price but 100% drop in P/E premium), there was a small recovery followed by a huge trough in valuation. During the recession quarters Q308 to Q309 S&P earnings fell to zero or below. As a result of S&P earnings collapse the S&P P/E shot up astronomically (as E approaches zero, P/E approaches infinity). Apple's earnings dropped as well but remained positive throughout that period bottoming at 37% growth(!) in Q408. As a consequence Apple's P/E fell as low as 11 while the market's went well above 100 (122.41 peak). The P/E deficit for Apple went 80%: Apple was valued as basically worthless (3x cash).
After the earnings recession, the S&P P/E recovered close to historic levels but Apple's P/E did not. It's in-line with the S&P but does not obtain the 50% premium preceding the recession.
So we can establish that the day that Apple's potential was discounted was nearly six months before the onset of recession.
What other discounting factors can we discard?
How about earnings growth itself? Did the collapse foretell an earnings collapse?
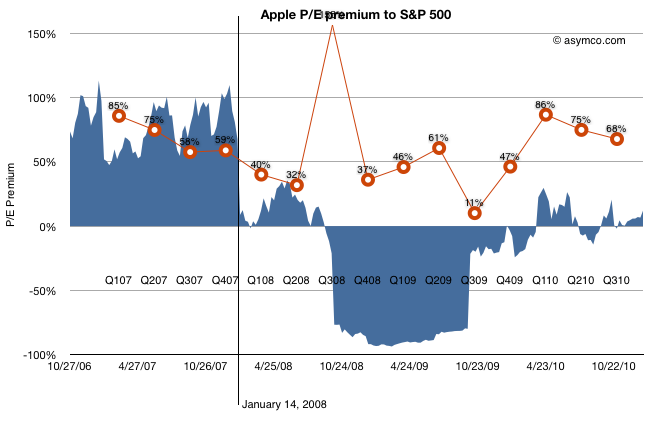
The chart above shows the P/E premium vs. earnings growth (in red). Although earnings growth began to slow soon after the 14th (earnings for CQ407 were not yet announced at that point), growth recovered six months later after the launch of the iPhone 3G[2]. Growth continued throughout 2009 and 2010 reaching new heights last year of 86%.
Still, the company received no premium to the S&P 500 P/E. Companies in the index averaged, at best, a quarter of Apple's growth in earnings.
What about Android? The first Android device did not ship until October 2008 (HTC Dream or T-Mobile G1). There were no appreciable Android volumes until 2009, one year after the drop in relative value and no talk of a threat until 18 months later.
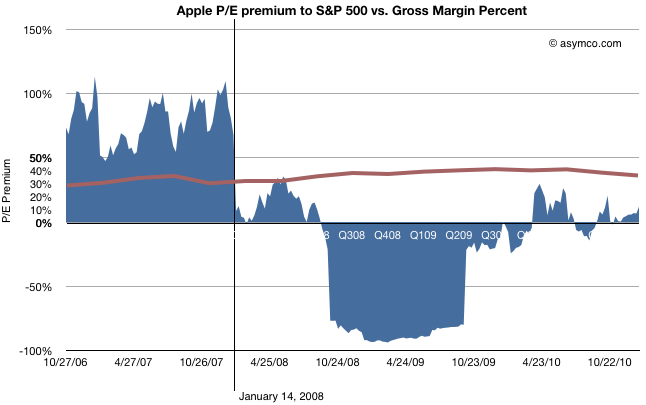
The last objection to be put aside is that of margin compression.
This last chart shows how margins (in brown) behaved during the same time period. They went up. The only slight decline took place during the last few quarters, after the launch of the iPad, long after the collapse.
Regardless of the adjustments with product launches, Apple's GM is the envy of the world and is not at all correlated with the loss of faith in the company.
So What happened on January 14, 2008?
Having led you this far in the story, I'm afraid I'm going to let you down at the end: The cause for the loss of faith is a mystery to me.
There is only one noteworthy event that took place on that date: Macworld 2008 (January 14-18). During the keynote, Steve Jobs introduced the Macbook Air (and Time Capsule and Leopard and pre-announced the iPhone SDK which, six months later led to the app supernova). I remember that day and I remember that the stock began selling off exactly at the point when the Air was mentioned. It has never been the same since.
Obviously, correlation is not causation. The Macbook Air need not be the cause for the loss of faith in Apple as an investment. Or can it? I'm hoping someone can explain this because to me it makes no sense. The product was not a home run but it did not do badly either and its current incarnation seems to be a hit. Whatever sins the original Air may have had have surely been expurgated by now.
Regardless the cause, the bottom line is that, in the eyes of investors, Apple stopped being "special" that day. Its valuation dropped to in-line the S&P and, given its growth, well below what a large growth company should be worth. The company's shares went into the bargain bin and are still there today.
---
[1] I should point out that the P/E ratio is based on post 2009 re-stated earnings. The restatement changed the P/E as the "E" changed. This was based on the abolition of subscription accounting for the iPhone. Although it may seem unfair to hold the market to this standard, restatement did not actually change cash flows which were transparent and visible to all, even to amateurs such as myself and the other unaffiliated analysts that published throughout this period. Earnings may be an opinion but cash flow is a fact. Valuation on the basis of cash flow should have yielded the same results as shown above.
[2] That quarter showed a y/y growth of 150% while the stock was in freefall. In fact, it was during that earnings day that Steve Jobs came on the conference call and pointed out the astronomic iPhone cash flow to an audience of analysts more concerned about their own jobs.