The number of BlackBerry phones sold fell 41% year-on-year in the last RIM fiscal quarter. Sequentially the fall was 30%. Though surprisingly poor, I note that Nokia's smartphone business fell even more dramatically last quarter (down 50% y/y and 39% sequentially). LG also saw a 44% decline in unit shipments in Q1.
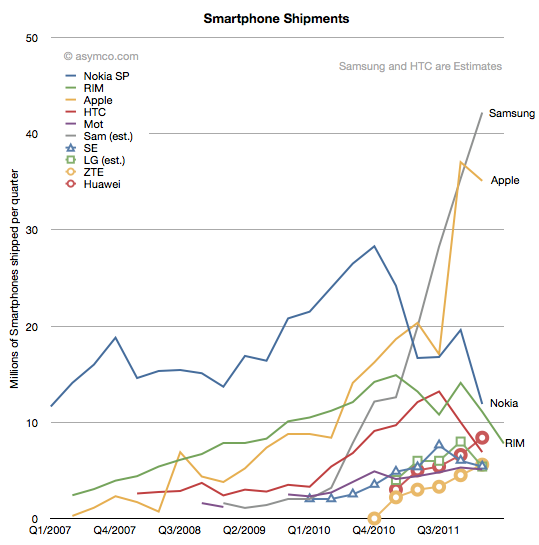
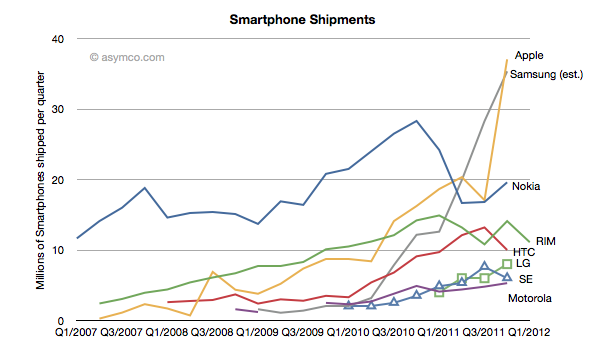
The history of smartphone shipments for the largest vendors is shown in the following chart:
From forecasts made by Huawei it's probable that they overtook RIM in the last quarter, dropping RIM to 5th or 6th ranked vendor in smartphone units.
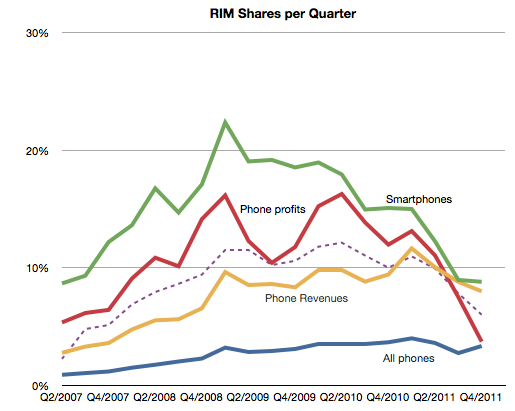
RIM's 7.8 million units is the same level of sales as it had in early 2009. The total market was only about 250 million units per quarter then. It's around 400 million today. A quick calculation shows that RIM's smartphone market share has fallen from a peak of 22% to about 6%.
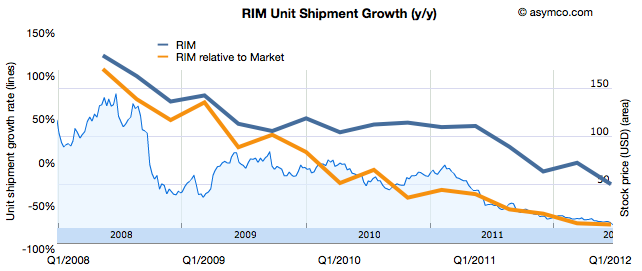
RIM's stock performance reflects this performance relative to the market.
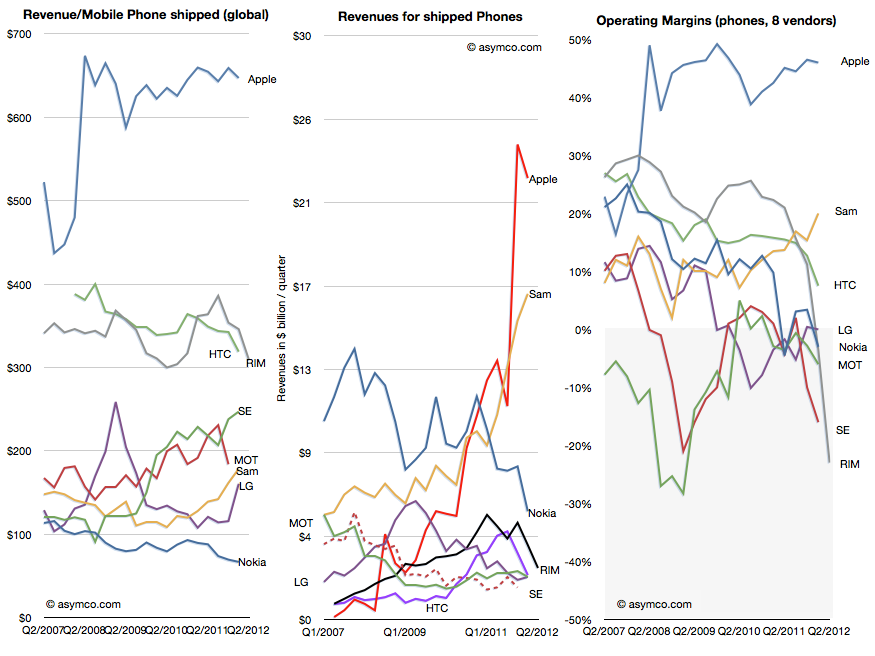
Hardware revenues were $1.652 billion. Matt Richman calculates the average hardware revenues for the BlackBerry of $203. I include service revenues in my ASP calculations (for Nokia and Apple these are also significant values) yielding $309 per BlackBerry. The history of total revenues, revenues per phone and operating margins are shown below relative to competitors.
Operating margin tells the most sobering story. As I've often repeated, historically no company has survived dipping into the grey zone.
To reiterate, the logic of irrevocability in this industry is as follows:
Success depends on three conditions being met by the vendor's products:
consumers trust the platform's promise
operator see the product as creating value to their core business
developers offer investment to innovate on top of the platform
If all these factors are present, the vendor enjoys a virtuous cycle of growth. If any of these is lost, the others are also likely to be lost as well creating a vicious cycle of decline.
Loss of operating margin is an early indicator that at least one condition is not met. Usually, a failure of consumer trust leads to a drop in purchases which leads operators and distributors and retailers to flee and then developers defect.
It's been impossible to recover from this tailspin so far. There is a procedure which works in theory: accelerate downward by investing in a new platform. The move is counter-intuitive but essential in re-building trust, quality and relationships.
However, the reason it does not work in practice is that this struggle is not with gravity alone. While spinning downward, the company is also subject to competitive attack. Competitors fill the void and take customers into locked-in ecosystems. There is neither the time nor the ability to defend.
Cash runs out and customers are divided up between the survivors. Nokia and RIM face this scenario today.
There is no shortage of information about what happens to companies in distress. The cause of distress varies widely and is often not well understood but the actions and symptoms of distress are very consistent. We can look at examples in each industry, even in each product category for a rich set of distressed company data.
For over a year I've been chronicling the decline of incumbents in the mobile phone industry. However, decline cannot continue indefinitely. At some point a company "exits" the industry. Either through a sale or divestiture or, rarely bankruptcy. The list of exits is already long. The length and the correlation between exit and the lack of recovery implies that Nokia will also exit.
But how, exactly?
Will Nokia be acquired? If so, then by whom? What other options exist? How can we analyze this?
The easiest way to guess is to look at what happened to other companies in similar circumstances. The clearest and easiest comparison to apply is Motorola. Motorola was at one time the largest phone vendor and it went through a violent decline. Like Nokia, it was diversified into networks and a few other businesses. Unlike Motorola it's not an American company. This matters because American companies are more comfortable targets for corporate raiders. The legal and boardroom mechanics are not "better" or "easier" in the US than in Europe but they are more familiar to those who might engage in it.
So one avenue that Motorola traveled on was the intervention of activist investors who forced management change, affected strategy and pushed some tactical initiatives. This external pressure was successful in the case of Motorola. The company was split up, it was re-purposed and re-focused and, with a bit of good luck, was acquired.
The process however still took two years. In that time the company languished but stayed alive. Its headcount was reduced by nearly two thirds. It was in a precarious situation throughout. Its story is not over but ownership did change hands and those who took a risk with it while in distress managed to get a reward.
This example (and Sony's acquisition of Sony Ericsson and HP's acquisition of Palm) cannot apply to Nokia. An activist investor is unlikely and the company has not yet made itself attractive to a buyer. So what would Nokia need to do to be acquired?
The first step toward an acquisition will be divestiture of its Nokia Siemens venture. The second will be a spinoff or sale of its non-smart phone division. The third might be the allocation of its IP across these separate entities or in a separate holding.
As the company is broken up, value can be released. Investors will be able to value it better and make appropriate assessments of risk. Only at this point would an acquirer perhaps buy the "rump" Nokia smartphones group.
However, even this scenario is not without huge risks. By the time the split is completed, the operating companies could have deteriorated to such a degree that they are no longer viable. Timing is critical.
So if the smartphone group is isolated and made available, who could buy it? Microsoft is always cited as the primary buyer. I've been skeptical of this as Microsoft has found it difficult to make hardware work. It acquired Danger leading to Kin which failed. It has struggled with Xbox for a decade and has yet to recover all its costs for the effort. It has failed embarassingly with Zune. It also has shown no particular success with its original Surface table computer.
But management has re-committed itself to a new hardware effort with the new Surface. This renewed potential opens up the possibility of entering into the integration of a phone again into their business, and Nokia would be remarkably well positioned to help.
At this time, the possibility still seems remote. The company has dismissed speculation of building phones again and again. Unlike PCs, the phone platform is not yet mature and volumes and distribution are very different.
However, there is one other option.
Microsoft has historically "rescued" technology companies in distress with cash infusions for minority equity stakes. It injected some cash into Apple, Barnes & Noble and even Facebook. It did so not because they wanted to own these companies but because they wanted them to survive or thrive. The move acts as a signal to the industry, partners and developers. So what I see more likely than an acquisition is Microsoft capitalizing a spun-off Nokia Smartphones company in exchange for a small equity stake.
The valuation of this stake will be huge as I expect billions of dollars for single digit share ownership. However, Microsoft would not be doing it to get a return from those shares. It would probably later sell them at a loss. But it would be buying a strategic option whose value may be far greater.
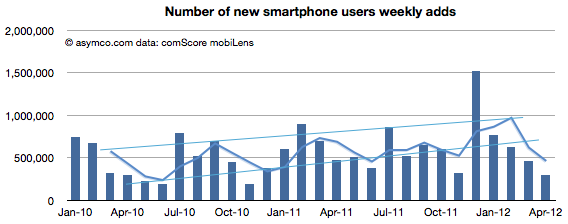
The latest data from comScore showed a few surprises:
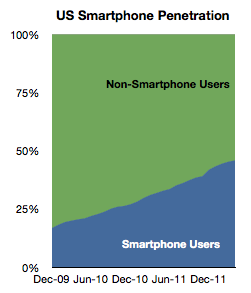
New smartphone users dropped to a very low level, below the trend line.
Slightly less than 300k new smartphone users abandoned their feature phones every week during the month. Compared with the 1.5 million per week in November, it's quite a slowdown.
Penetration growth slowed as a result as well. Only 1.3 points of share were gained by smartphones.
It's still likely that the penetration will reach 50% by the end of summer this year (as was predicted in 2010).
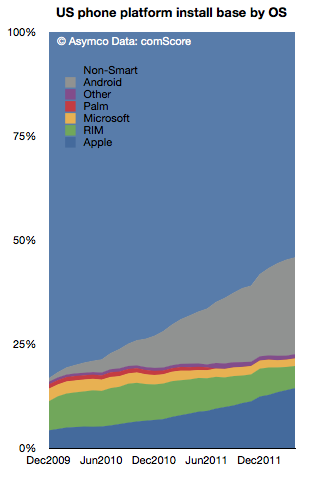
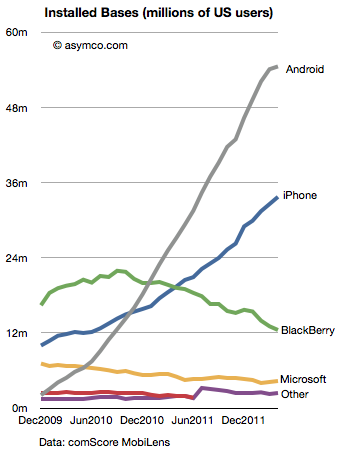
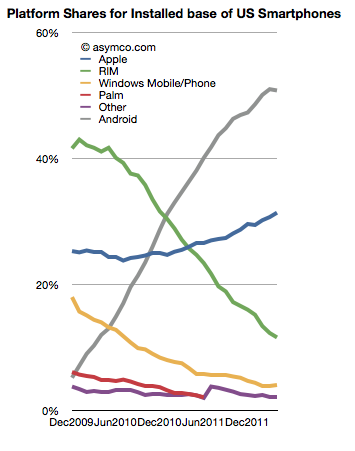
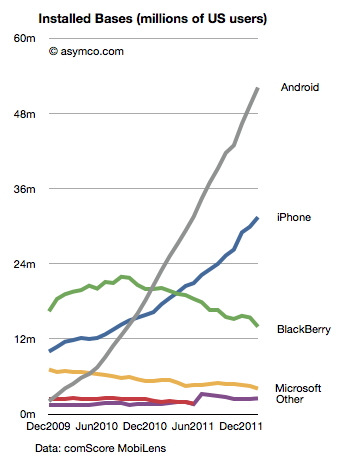
When looking at the picture above broken out by platforms, we see signs that the slowing in smartphone growth seems to be attributable to a slowing in Android adoption:
Here are the installed bases in users over time of the different platforms:
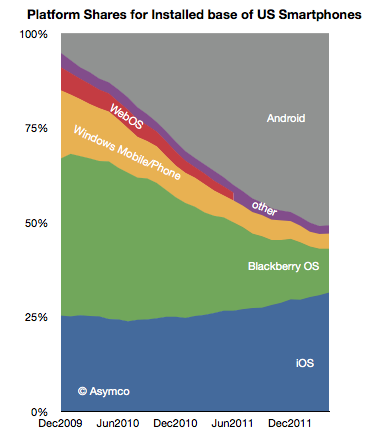
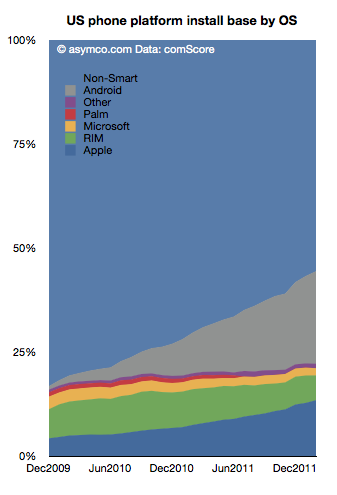
The share of users of the platforms is shown below, first as a stacked area:
And also as a line chart:
This last chart shows the first time when Android share dipped sequentially. It should be watched closely as an indicator of a change in market dynamics. As we reach saturation, the basis of competition will change.
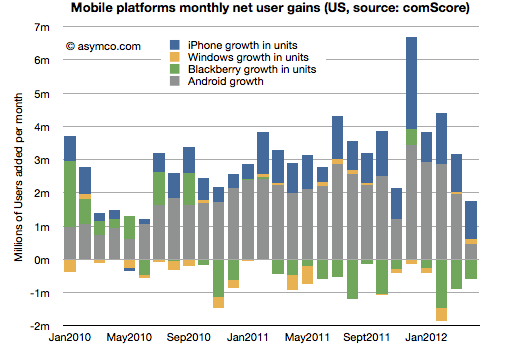
Finally, the last chart shows net user gains for the platforms.
Here again we see the lowest user growth for Android since 2009 (and hence since it reached mainstream distribution.)
It's perhaps too early to suggest that we're seeing a slowdown in the US for Android. Perhaps there will be a return to growth in the fall. The concern has to be that rather than seeing the net adds growing--as they have for two years with only two contiguous months of decline--Android net adds have been falling for four months.
During the first quarter this year HTC, RIM and Nokia all surprised investors with bad news. The effect is evident in the share price of these companies which, in the case of RIM and Nokia is around book value, and in the case of HTC, neared 12 month lows and a 70% drop from peak.
These "misses" in earnings and expectations are on top of the already woeful news from Sony Ericsson and Motorola, which have not had profits for years and LG, which has been borderline since late 2009.
In combination, this seems to imply a dearth of profits in an industry that is, by all measures, booming. Units are up 7% with smartphones up 47%. Revenues are up 20% and overall profits are up 52%. This are exceptionally strong numbers. Few industries can measure growth in double digits.
So if the industry is booming but the majority of participants in the industry are loss making (and surprisingly so) then what is going on? There are two answers: new market disruption and low end disruption.
The new market disruption is the migration of a large number of demanding customers away from phones-as-voice-products to phones-as-computing-products. The low-end disruption is the migration of a large number of less demanding customers from branded phones to unbranded, commodity phones.
The New Market Disruption
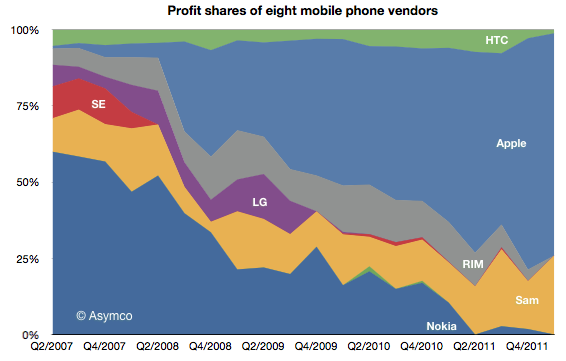
The new market disruption is evidenced by the shift of fortunes to Apple and Samsung and away from every other device maker. Here is the profit picture:
Of the vendors tracked (public companies who report mobile phone divisional performance), Apple obtained 73% of operating profits, Samsung 26% and HTC 1% [1][2].
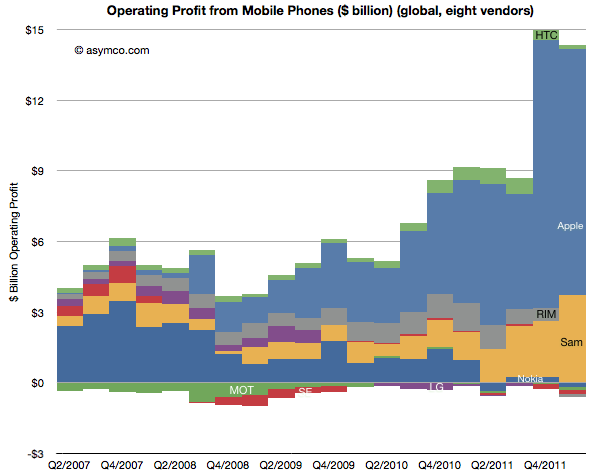
The "share of profit" picture is potentially misleading because it could imply that the profits available are a constant. They're not. The absolute profits picture below shows how the industry actually expanded available profits by quite a lot. Two years ago the vendors generated profits of $5.3 billion in the first quarter and last quarter they generated $14.4 billion.
Seen this way, the story isn't so much that Apple "took the profits from the incumbents". Rather, it's that Apple created a vast new pool of profits. And one need not look far to find out where they came from: operators. These profits were mostly carrier premiums for the iPhone 4S.
Before shedding tears for operators, consider that although this does amount to a current transfer of profits from carriers, the decision is a popular one. Hundreds of operators have made it. It's unlikely that they all colluded to be robbed. Indeed, they willingly hand over these premiums because the iPhone ensures a competitive advantage or preserves their customer base from churning. The calculations that go into a decision to range the iPhone are compelling enough that 250 operators made the decision (though, crucially, there are still 250 who have not).
Following this value proposition to its logical conclusion would suggest that the industry is rewarding those who can supply computers-as-phones which preserve the cash flows of what is essentially a trillion dollar data services business. Vendors which cannot offer this solution saw their businesses implode. At least on the high end.
The low end disruption
Simultaneous with this shift of the high end to smartphones-as-app-and-service-platforms came an explosion of growth in unbranded phones. As Apple led and most brands followed the new market, the old market of voice-oriented phones was abandoned to new entrants offering cheap "good enough" phones. Nokia tried to preserve its volumes and margins there but it's becoming increasingly difficult.
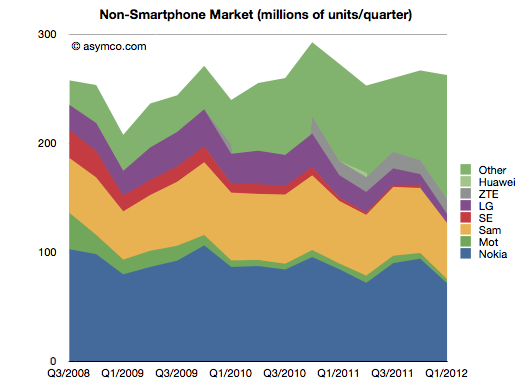
The following chart shows how the "Other" vendors have come to make up about 44% of the market.
Note that although this "feature phone" segment is not growing, it is still a large market (250 million units a quarter). The entrants in this market are numerous (perhaps in the thousands) and they are offering white label and unlicensed knock-off products. They are also offering unregulated (i.e. without IMEI numbers) products which are technically illegal and sold mainly in underdeveloped countries which have no incentives to enforce regulations.
This is a consequence of feature phones reaching the point of being "good enough". The feature set and quality are adequate for voice, text, games and even media playback and are priced at $30 or less.
This commoditization of the low end is pressuring what would normally be the fallback cushion under an underperforming smartphone business. The crisis for the incumbents comes from not only being unable to shift to the new market as fast as needed but also from not having cash flows from a low end that was thought to be sustaining.
This combination of two disruptions is why we see an explosively large and growing market failing to reward all but two of the participants.[3]
---
Notes:
You can download, view and interact with a motion chart for the industry data here. All data is sourced from company filings except for some estimates where data is missing.
Operating profits are sales minus cost of sales minus operational expenses attributed to the business. When not available, opex is estimated as a percent of total in proportion to sales. Note that operational income excludes taxes, depreciation and other capitalized costs.
We cannot say that the thousands of low end entrants are unprofitable. They are probably enough profits to sustain them and even to attract more entrants, but we have to also recognize that there are likely to be very low margins.
Our agreement with Microsoft includes platform support payments from Microsoft to us as well as software royalty payments from us to Microsoft. In the first quarter 2012, we received a quarterly platform support payment of USD 250 million (approximately EUR 189 million). We have a competitive software royalty structure, which includes minimum software royalty commitments. Over the life of the agreement, both the platform support payments and the minimum software royalty commitments are expected to measure in the billions of US Dollars. The total amount of the platform support payments is expected to slightly exceed the total amount of the minimum software royalty commitments.
The figure of $250 million for Q1 is the same as the amount Nokia received for "platform support" in Q4 2011. This means Microsoft has paid $500 million over two quarters. During the same time frame Nokia shipped approximately three million Windows Phone devices. The average cost to Microsoft to acquire a Nokia Windows Phone user is therefore $167 per user. This is down from $250/user in the last quarter.[1]
If the royalty is equivalent to a license fee then the more interesting question is how and when will the royalty payments nearly match the platform support payments as expected. This might give us an estimate of what both parties are expecting from the relationship.
If the payment schedule of $250 million per quarter is maintained through 2014, Microsoft will have paid $3.25 billion to Nokia. This is well within the "billions of US dollars" range that is cited above. (The minimum would be $2 billion which would mean payments through the end of 2013).
We also need to estimate the royalty payment structure. One figure that has been circulating for a long time is that Microsoft prices Windows Phone (and its antecedent Windows Mobile) at $15/unit. It's an aggressive price point for a mobile software license and should be subject to volume discounts but let's assume it's correct. If it is correct then the only remaining question is how quickly will Windows Phone units grow at Nokia?
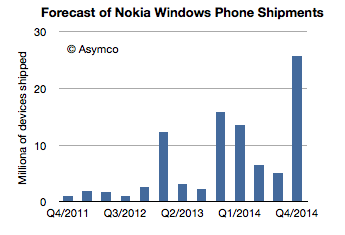
One way to begin is to calibrate WP growth to iPhone growth. For the first two quarters iPhone and Lumia have sold at rough parity.[2] iPhone sold 1.4 million in its first quarter (including opening weekend sales of 270k in previous quarter) while Nokia sold "approximately" one million Lumias in its first quarter[3]. In the second quarter Nokia cited 2 million Lumia units and Apple had 2.3 million iPhone sold in Q4 07. So far Lumia is slightly under the iPhone ramp, but let's give it the benefit of doubt.
If we apply iPhone growth rates to Lumia then we have the following sales forecast for Nokia's Windows Phones:
This looks like healthy growth, as was the iPhone's. However, this "iPhone growth" pattern only results in about $1.4 billion in payments in exchange for $3.25 billion from Microsoft, leaving a deficit of $1.9 billion in the "platform support" balance.
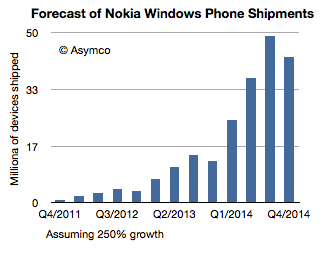
To erase the deficit, I tried an approach where I assigned 3 million and 4 million for Q2 and Q3 shipments respectively then applied a constant (y/y) growth rate thereafter. Solving for a figure of growth which results rough parity with platform support payments gives us about 250% growth. The resulting sales profile looks like this:
This ramp would result in 210 million Windows Phones shipped over about three years. It would also generate nearly $3.2 billion in "royalties" for Microsoft offsetting $3.25 billion in "platform support" payments by Microsoft to Nokia.
There are many assumptions in this, royalty rate and length of contract chief among them, but the key question should be a sanity check: is this a feasible product ramp. It's certainly far faster growth than Apple has been able to achieve. On average Apple obtained about 160% quarterly y/y growth. It also exceeds the growth rate that Samsung has been able to achieve (165 to 170 million smartphones shipped from a standing start three years ago). It implies 150 million units shipping in the third year of sales and nearly 50 million in a peak quarter. It assumes perhaps as much as 20% market share in smartphones in 2014. It's certainly ambitious.
But even if it's achieved, it's only a break-even point for Microsoft's relationship with Nokia. It would imply that payments to and payments from Nokia would be in balance. The road to (dare one say it?) profitability for Microsoft in mobile would just begin to be visible at that point.
---
Notes:
What the quote above also reveals is that Nokia is also expecting to pay back some of these "support payments" in the form of "royalty payments" for the software. That's an interesting word choice as usually an OEM would pay a license rather than a royalty for software. I'm not sure if this implies anything but it may.
See also Charles Arthur's analysis of comparable growth ramps for mobile phone platforms here.
This figure was cited "to date" in a March statement so actual calendar Q1 may have been less, perhaps 650k.
Nokia currently estimates that Devices & Services net sales in the first quarter 2012 were EUR 4.2 billion, comprised of Mobile Phones net sales of EUR 2.3 billion (71 million units), Smart Devices net sales of EUR 1.7 billion (12 million units),
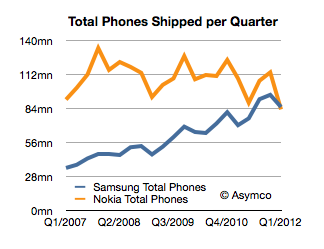
We don't have the total number of Samsung shipments, however estimates exist. They range between 41 and 44 million smartphones and 44 and 47 million feature phones. The low end of that range would imply Samsung shipped 85 million phones.
Nokia's press release indicates that it shipped 83 million.
This would be the first quarter that Samsung beat Nokia in total phone shipments. It had already overtaken Nokia in sales volume and profitability last year but this is the most cited metric of market performance: being the biggest in volume. Here is the tale of the shipments:
How did this happen?
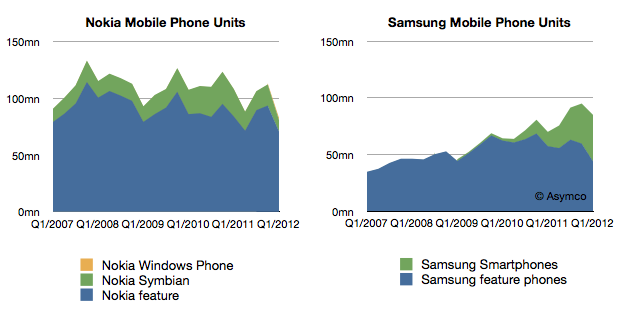
The answer should become visible when we look at at another set of data. If we split the smartphones from feature phones the charts look like this:
Looking at product mix, Samsung growth is shown to be almost entirely due to smartphones while Nokia's stagnant growth seems to be a failure to have any smartphone traction.
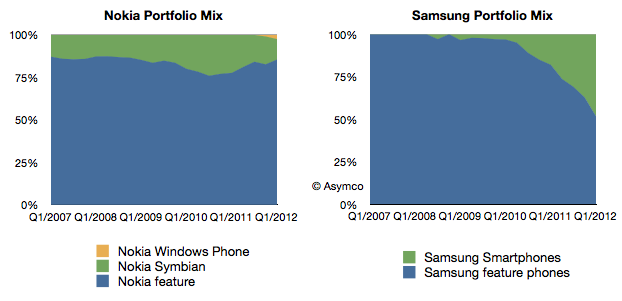
It's even more clear when showing the above mixes of devices as percents of total.
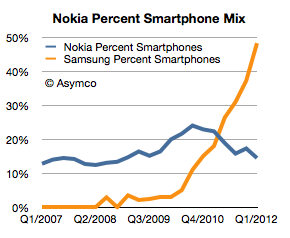
As a percent of total, Nokia has shrunk its smartphone business from a peak of 24% in Q3 2010 to 14% last quarter. In the same time frame Samsung's smartphone share of portfolio has exploded from 10% to nearly 50%.
Note that both companies have seen non-smart device volumes contracting. Samsung's level is approximately the same as it had in late 2007 and Nokia's is lower than at any point in the last six years (perhaps longer).
So the answer to the question of how Samsung beat Nokia is told in the following chart:
Samsung was able to convert its portfolio to smartphones while Nokia failed to do so. This is the sort of transition that can only come about from an explicit strategic intention on the part of management. Market demand can steer you in any number of directions, but a vision of a future should provide the compass for making the big bets.
The bet Nokia made many years ago was that there would be a continuing, substantial business in the "low end". And low end meant feature phones. This strategy was still in evidence last year under the moniker "the next billion" users. The decisions were not driven by whether the products would be hired for different jobs, but that they would hit different price points. In other words, segmentation of customers by their ability to pay for devices rather than categorization of the jobs they hired mobile devices to do.
Perhaps Samsung was no wiser, but they were more pragmatic. Being non-dogmatic meant being flexible. They ran with off-the-shelf technologies and managed a transition to smart devices faster than anyone expected. It may not be a perfect strategy but it beat a bad strategy.
Nielsen has already noted that more than half of US consumers have smartphones. comScore's data seems to point to that threshold being crossed sometime this year.
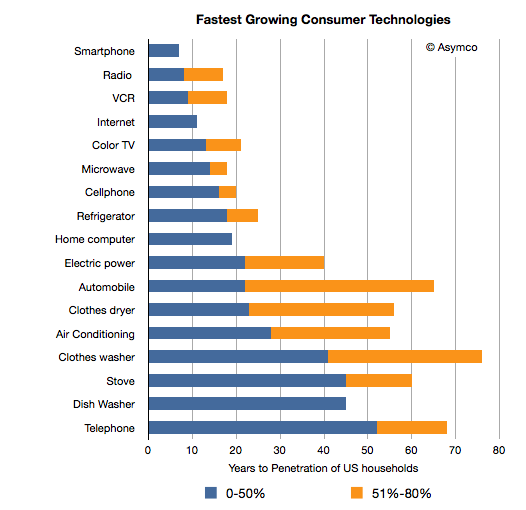
If that point is crossed then it would mark the smartphone as one of the most rapidly adopted consumer technologies of all time. I plotted the time it took for a set of technologies to reach 50% penetration of US households.
I also showed the time it took for some of the technologies to reach 80% penetration.
The obvious question is how long will it take for smartphones to reach saturation in the US. Saturation level would be above 80% for individuals but closer to 100% for households. A conservative estimate would be another seven years. An aggressive estimate would be five years. That implies that between 2017 and 2019 smartphones will be the only mobile phones Americans will use. That would be equivalent to a user population of about 300 million.
Note that some like Internet and home computers have not reached 80% penetration in the US.[1] [2] When or whether smartphones will overtake computer penetration in the US is an open question. I believe that, like cellphones have in other markets, smart devices will overtake computer consumption and thus penetration and even bandwidth consumption.
There are significant technical and marketing challenges for reaching the "second half" of the market, but, as in all the other technologies listed above the incentives are in place to overcome these challenges. What's most remarkable about smartphones is the speed with which obstacles are overcome. For such a complex and inter-dependent technology, the speed of adoption and value creation is unprecedented.
The value network creation rate is also staggering. The App Industry went from inception to billion dollar valuations in a matter of three years. Entirely new business models and experiences are being created almost daily. What used to be a glacial process of innovation diffusion can now be observed in near real-time.
---
Notes:
The question of when smartphones began penetrating the US is somewhat debatable. I contend it was either 2004 or 2005 when the BlackBerry and Treo brands began to be widely available. Although there were smartphones in production as early as 2001 (or even 1998 if we choose to include the GeOS based Nokia Communicator) their availability to US consumers was very limited.
Canaccord Genuity analyst Mike Walkley writes in a note to clients today. “In fact, we believe iPhones are outselling all other smartphones combined at Sprint and AT&T and selling at roughly equal volume to all Android smartphones at Verizon.”
That's useful data. Mainly because we can use it in combination with comScore data that tracks a different market measure. comScore's MobiLens service tracks US mobile installed base. By measuring the difference between their stats one month to the next, one can measure the gain in a particular platform.
Comparing that gain with the sell-through rate in the same period can yield a figure for the number of units sold as upgrades vs. those sold to new users.
The latest comScore data (period ending February) shows that Android added 2.87 million users to its base while iPhone added 1.52 million. If we assume that Android sold a minimal number of replacements (due to the limited time in use of bulk of units) and round up to 3 million for February, and if we assume that Apple sells as many iPhones as Android (which is what Walkley suggests) then we can conclude that in the US roughly half the iPhones are bought as replacements for existing iPhones.
Extrapolating this to global markets may be risky but already we can begin to form a picture of how the iPhone franchise is becoming an annuity-based business.
Apple likes to point out that "half of Mac buyers are first time buyers." In the case of the iPhone perhaps they could also say "half of iPhone buyers are repeat customers." At this stage in the platform, that's a powerful statement. If the repeat customer rate is high then it suggests strong loyalty but it also may suggest poor competitive position vs. non-consumption or alternate platforms. If the repeat customer rate is very low it may suggest competition vs. non-consumption but it may also suggest low loyalty. It all depends on the overall growth in the market and size of installed base.
The following chart shows the overall market growth and the position of the various platforms within that growth.
Note the time scale is slightly more than two years. This suggests that the vast bulk of Android units in use (grey area) consists of first use units. New purchases are going to first time buyers. In contrast, the shrinking RIM total implies extremely low sales as the age of the base is far older than the time scale. iPhone base is both growing and being upgraded.
As we reach 50% penetration of smartphones, platform churn will become a significant component of market performance. The loyalty and "stickiness" of Android will begin to be tested. Current surveys show reasonably good satisfaction ratings for Android phones (around 60%) while iPhone's are even higher. But let's keep in mind that RIM's satisfaction and the loyalty of their customers was exceptionally high a few years ago. The rate of evaporation of goodwill toward the brand is breathtaking.
The longer term test of mobile platform performance will be in the recurring purchase rates. Loyalty must be earned and preserved. I.e. "You come for the product, you stay for the ecosystem."
So far, the iPhone seems to be getting a passing grade while Android has yet to face the test.
RIM’s CEO, Thorsten Heins was quoted as saying, “We plan to refocus on the enterprise business and capitalize on our leading position in this segment. We believe that BlackBerry cannot succeed if we tried to be everybody’s darling and all things to all people. Therefore, we plan to build on our strength.”
RIM's latest quarterly results show a continuation of the decline in sales that began in Q1 2011.
Here are the highlights:
Smartphone units declined 26% y/y and 21% sequentially. Over a four year period the company still shows a positive growth of 20% compounded, though that is far below industry average
The smartphone revenues were down 29% y/y and 23% sequentially.
Including service revenues, the revenue per smartphone dropped to $346, a drop of 4%.
I estimate the phone operating margin to be less than 5%. The company swung to a net negative operating margin due to write-downs of tablet inventory but the phone business managed to break even.
Operating income from phone operations dropped to the lowest level in five years.
The company is still generating cash flow and has a cash reserve of over $2 billion.
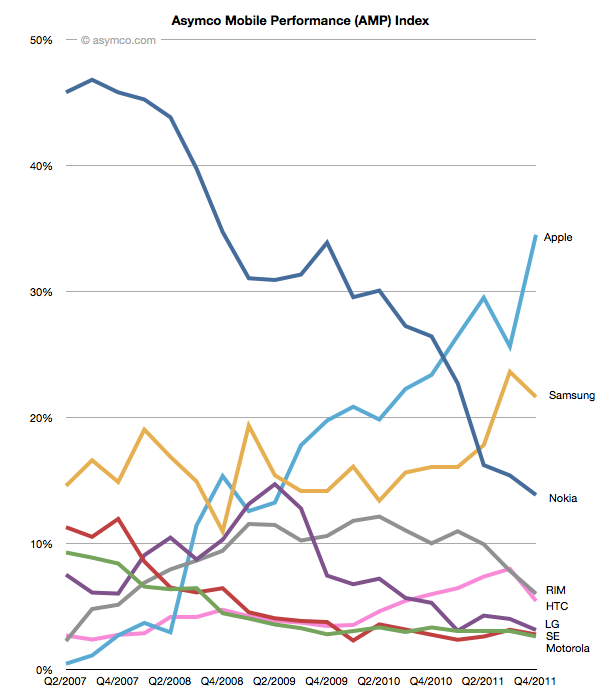
Seen in isolation, the company is clearly struggling but does not seem to be on its last legs. But no company should be seen in isolation. As part of a competitive market, the company is in far worse shape. The following chart shows the AMP index which measures relative performance through a blend of market shares.
This chart does not include the latest quarterly data but if it did it would be sure to show a continuing decline. The AMP index actually shows RIM peaking in Q1 2009, well before the volumes peaked.
It's within this context that we need to evaluate the new CEO's strategic shift. In the quote above we have the first significant strategic departure and split from the past. Should it inspire hope or despair?
The idea of focus has huge benefits. Focus and the art of saying no are keys to greatness. However, you only succeed if you focus on the right thing. "Enterprise" is not the right thing. It's not a valid target. Enterprise support is a feature, not a product. I don't mean that as opinion, but as a point of fact. Focus on a set of customers whose only characteristic is a job description is missing the whole point of focus.
Focus needs to be positioned on a job a brand needs to be hired to do. The idea should be to solve an open problem which is either too complex or too uneconomical for anyone else to solve. Corporate buyers have problems to solve but the BlackBerry no longer offers unique or defensible solutions. Furthermore, corporate buyers are themselves being dis-intermediated from the computing purchase decision. Sometimes this process is called "consumerization" but it is more plainly explained as "commoditization". The selection of tools for workers by a group that claims to understand their needs better than they do is an archaic concept.
This was true even in 2005 when RIM began targeting consumers. It was then that they saw the writing on the wall--that their enterprise business was being commoditized. All of RIM's growth since has been in consumer segments. By abandoning that trajectory RIM is effectively giving up on growth. And giving up on growth is simply giving up.
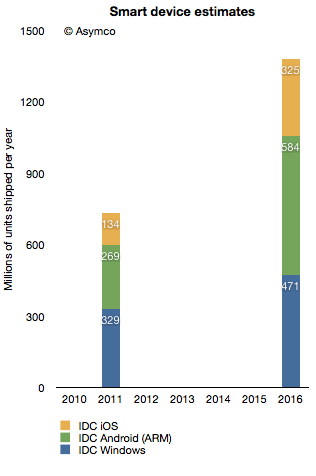
In terms of platforms, IDC expects a relatively dramatic shift between 2011 and 2016, with the once-dominant Windows on x86 platform, consisting of PCs running the Windows operating system on any x86-compatible CPU, slipping from a leading 35.9% share in 2011 down to 25.1% in 2016. The number of Android-based devices running on ARM CPUs, on the other hand, will grow modestly from 29.4% share in 2011 to a market-leading 31.1% share in 2016. Meanwhile, iOS-based devices will grow from 14.6% share in 2011 to 17.3% in 2016.
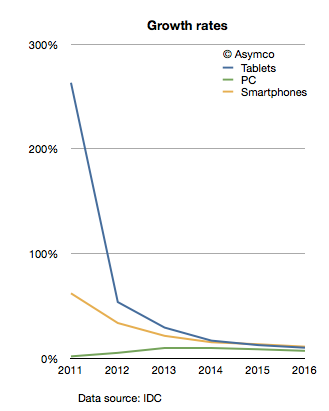
The company provides a stacked bar chart (follow link above) to illustrate their view of the market. I took the data they included and measured the implied growth rates for the product categories:
IDC is implying that in four years the tablet market will be growing at 10%, the Smartphone market will grow at 11% and the PC category will grow at 11%. In other words, five years from now the PC market is expected to grow faster than the tablet market and just as fast as the smartphone market!
What's more remarkable is that this situation is not going to happen in four years. The slowdown in growth is actually expected much sooner. The growth rates two years from now are expected to be: Tablets 17%, Smartphones 15% and PC 10%. IDC is unequivocal: by 2014 the good times will come to an end to the post-PC challengers. These growth rates would be catastrophic for share prices and the value propositions of the new platforms to developers, partners and consumers.
What's more, these growth rates are striking not only because they predict a collapse in the value of most market challengers but that they also predict a strongly resilient PC market. How can we test this forecast?
I tried to reconcile this doomsday scenario with what is known about the components making up the data. I.e. what "bottom-up" data is IDC using? In the quote above, IDC offers some insight into this market participant data. Based on the category and share data they published it's possible to infer the following:
Bearing in mind that neither iOS nor Android existed five years ago, we can observe they are bigger together than the PC market. And yet, IDC predicts a compounded average yearly growth rate of 16.7% in Android, 19.4% in iOS and 7.5% in Windows between today and 2016.
In aggregate, IDC forecasts that in the next five years Android will not manage to double and that iOS will only increase by a factor of 2.4. Is this believable?
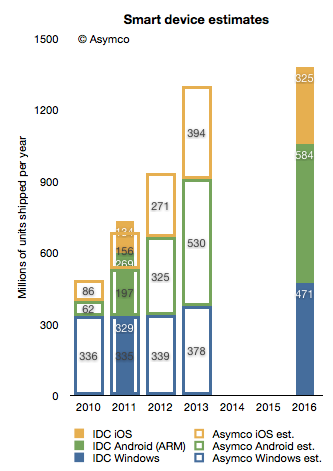
I try to stay away from long term forecasts, but I do maintain a short term forecast based on recent growth data. My forecasts for this year and next year are shown below.
I super-imposed my short-term forecast (outline bars) on IDC's long term forecast (solid bars) and a several differences become apparent.
First, my 2013 forecast is nearly the same as IDC's 2016 forecast. To see why we need to look at each platform separately.
Perhaps we might (with difficulty) agree on Microsoft's potential. I believe Windows 8 will have a catalyzing effect and that Microsoft will begin to see its platform grow again. However, my expectations are modest. To increase Windows sales rate by 100 million units/yr between 2013 and 2016 is possible but ambitious.
The real problem is that our Android and iOS forecasts are outside any zone of possible agreement. Maybe there is a difference in what we measure. For a hint, we seem to disagree on the number of Android devices shipped in 2011. I used Google's own reports of activations to work out the yearly shipment estimates. Perhaps IDC is including versions of Android that are not Google sanctioned.
We also disagree on the 2011 iOS figures. I obtained 156 from Apple's own reports. Again, perhaps the difference is the inclusion of the iPod in my case.
Nevertheless, the difference in the long term cannot be accounted for only through these categorization differences. I would put the cause of the difference down to the methods used in forecasting. As can be seen from the first chart above, IDC's growth rate reductions are extraordinarily steep. Perhaps the approach used by IDC was to forecast the overall market growth and then assignment of shares to participants. This can be called the "top-down" approach. In contrast, my approach is to forecast growth rates based on recent growth rates and moderating these rates gradually. This can be called the "bottom-up" approach.
My experience and all the data I've ever collected about historic disruptions tell me that the entrants tend to win these types of paradigm shifts. They win through a vast expansion of consumption and the recruitment of non-consumers. Markets tend to experience vast shifts in composition. If we believe this to be true then the bottom-up approach focused on entrants is likely to be more effective vis-a-vis the top-down approach of projecting steady state markets and the implicit assumption of incumbent share preservation.
The phenomenon we call business disruption could benefit from a different name. Although it signifies a disturbance or an interruption in an industry, it's much more than that.
The nominal definition I work with is that disruption is the "transfer of wealth in an industry from dominant incumbents to disadvantaged entrants." It's a convenient definition because it's brief, it puts the emphasis on economic value and because it alludes to a reversal of fortune and the implied extraordinariness.
However, there are several nuances lost and contradictions ignored in this definition. I want to enumerate them here and now:
Although in a disruption there is a transfer of wealth, that wealth is not necessarily conserved. An industry that undergoes a disruption often emerges larger, more productive or more influential. Disruption typically creates net growth.
Although extraordinary and spectacular it is also very commonplace. Disruption is not rare. In fact, it rarely fails to happen. One could even say that if it does fail to happen, it's a symptom of an industry in crisis.
Being so common, it can be seen as a regular occurrence. But if the regularity of disruption can be considered to have a clock cycle, its frequency is increasing.
Disruption in the literal sense implies discomfort, displacement and even destruction. But it's necessary to the health of any economy. The analogy to biology is that death is the most important thing in life.
Although only recently characterized and studied in cases set in the past century, the pattern is evident throughout history.
I've offered examples of these consequences or side-effects of disruption but I'll emphasize once more the example I'm most familiar with. To illustrate the primary definition, the AMP index is a measure of the success of one company relative to a set of peers in the mobile phone industry. It's the average of four market shares: mobile phone units, smartphone units, revenues and operating profits.
This chart shows the shift in AMP index values for the competitors whose data is public and which make up the vast majority of units sold:
The reversal of fortunes, though not complete, is clearly evident. Motorola and Sony-Ericsson, two of the brands that were a significant part of the mobile phone landscape for more than a decade, have ceased to exist as independent companies. A third, LG, is likely to follow. Nokia, the most successful phone vendor for the decade of the 2000's is in severe distress at this time, valued barely above book. RIM, a pioneer, is priced below book value and HTC, another pioneer is also looking for a way to remain relevant.
But we have to appreciate that as these valuations evaporated, the market grew both in value and in volume. The overall spending on phones has never been higher. The total profits captured is also growing. By any standard, smartphones are a booming business. Queues form for the latest versions, there are supply constraints and media coverage is almost universal.
We also have to appreciate that the Nokia that is faltering today was itself disruptive when it gained its prominence. In the 1990s the mobile phone market was dominated by Motorola, then by Ericsson. Nokia was a relative latecomer and succeeded by being better in some regards (e.g. the ease of use of text messaging on its phones) but also by being asymmetric. Using logistics and a portfolio approach to the market allowed it to build scale while maintaining margins. Process innovation led to component shortages for competitors and allowed Nokia to build massive distribution. It also allowed it to invest in software which gave it a unique selling point for several years.
Looking into the even more distant past, the mobile phone market has seen several waves of disruption. Going from analog to digital was such a turnover. The companies which were successful with analog (mainly Motorola which supplied not just handsets but infrastructure) were sidelined when global digital standards took root. Integrated European vendors dominated a period when 2G GSM was becoming predominant. Isolated pockets of integrated innovation like iMode in Japan also had mini-booms but were swamped by standardization and the Galapagos syndrome.
And let's not forget that mobile itself has been disruptive to fixed line telephony. Looking at all telecom, the transitions from fixed to mobile, analog to digital and most recently feature-based to computing-based platforms have all been disruptive, bringing a new set of companies to lead while incumbents fretted.
It should also be noted that these changes are happening more rapidly. The chart above has a five year period. The change from analog to digital took longer. Over 10 years since its inception analog was still dominant. If we look how long it took for mobile to take consumption away from fixed, that process is still ongoing, several decades later. The speed is so slow that some countries have skipped over fixed networks altogether.
With software-defined devices and cloud-based distributed computing the changes will become even more rapid. Even though the user base is expanding to cover nearly the entire global population, the replacement rate of devices means that change in the tools and services people use are limited by supply rather than demand. Supply-based innovation or "the new manufacturing" will probably be the dominance-defining asymmetry of the next decade.
The disruption of mobile phones that Apple has foisted on the world through iOS has caused it to reach a point where it dwarves the values of other companies, not just in the sectors it competes, but in all sectors. Some suggest that Apple is an anomaly and does not reflect the economy. To truly understand the state of the economy, they say, means to subtract Apple from it. But I feel this is exactly wrong. Apple is, through the iPhone and iOS ecosystems, defining this era. Just like Microsoft defined an era of increased productivity through the creation of the "knowledge worker", or like GM re-defined transportation and the notion of the brand in the 50's, or like IBM re-defined business process efficiency with automation in the 60's and 70's, these companies were not anomalies of their era. They were the eras. They were the locomotives of growth that taught other companies how to operate and the contemporary managers how to manage.
Companies that study Apple today will benefit by understanding how it re-wrote the rules. The anomaly is the norm. The exception is the rule. The times they are indeed a-changin'.
Finally, to put disruption in a historical perspective. I wrote a retrospective on the history of the telegraph as a parable of how disruption could be interpreted to have happened even a century ago. What I hope to do now is to show how, given this set of spectacles, we can see how the fate of nations was determined, in part at least, by the ability of leadership to accommodate disruption.
The case of growth or limits to that growth, the question of integration vs. modularity and the evolution of value chains all have application for regulators, policy makers and political leaders.
The dialogue on this topic will begin in Amsterdam on April 13th 2012, at Asymconf. I look forward to seeing you there.
---
Notes:
This is the material accompanying the first case discussion at Asymconf. Participants are encouraged to read it before the show.