Asymco

Asymmetric Intelligence

smartphone

  1. The unrelenting trends in the US smartphone market

    Research · 27 comments

    The latest comScore US mobile subscriber monthly data is in: comScore Reports January 2012 U.S. Mobile Subscriber Market Share - comScore, Inc.

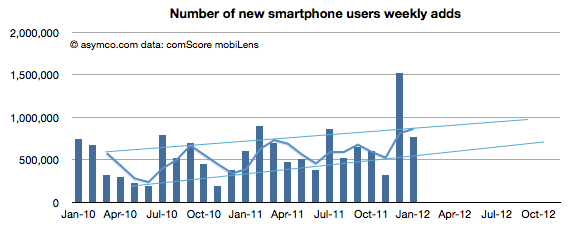
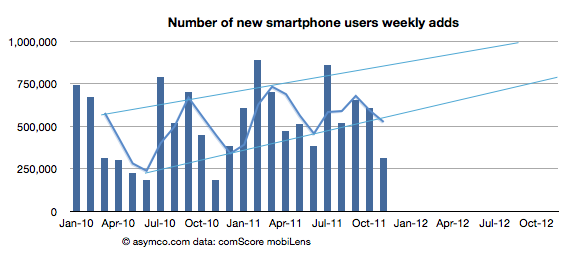
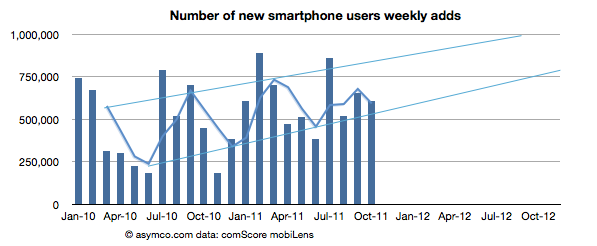
    January saw a return to trend line growth in US smartphone add rates. The 767k/week rate is within the band after November's below- and December's above-the-line outliers. The weekly add rates are shown (with projection of trend) below:

    The pattern shows a likely 1 million new smartphone users per week being added consistently by the fourth quarter of this year.

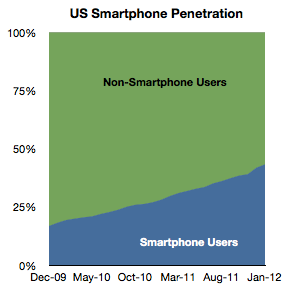
    Overall, penetration of the sampled population (above age of 13, primary phone and excluding business purchases in the US) reached 43.3% in January. The increase was 1.45 points from December.

    A significant 35 million US users  switched to smartphones in the last 12 months, equivalent to 15% of the user population. My current forecast is that 50% of the user base would be smartphone users by June 28th.

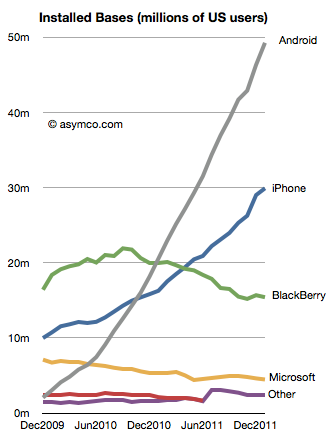
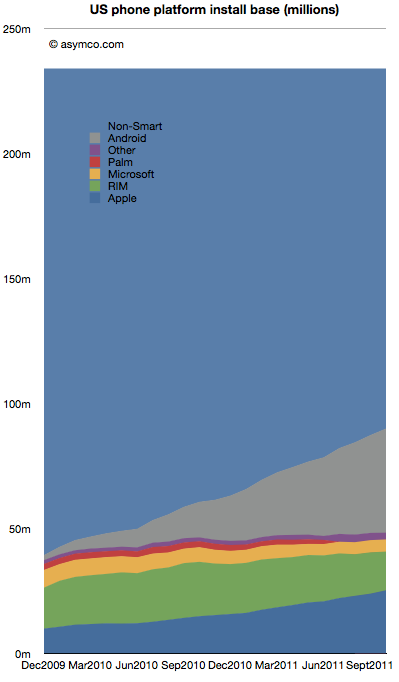
    The platform data shows a continuing pattern. In terms of absolute users Android has reached nearly 50 million users, iPhone 30 million, BlackBerry 15 million and Microsoft (Windows Phone and Windows Mobile combined) 4.5 million.

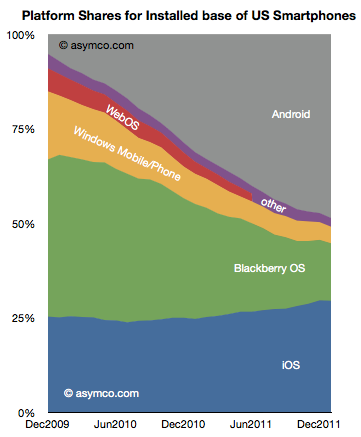
    In terms of market share of the smartphone population, the various platforms stack up as follows:

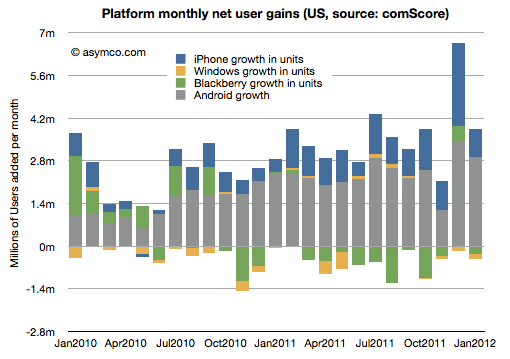
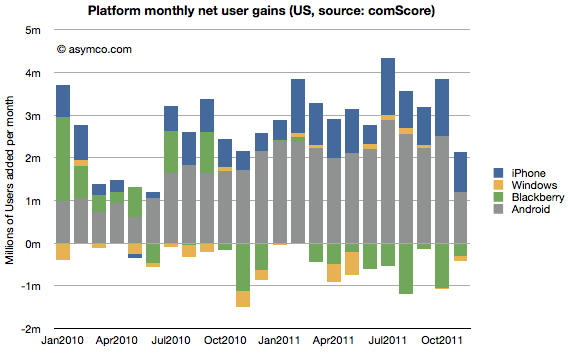
    The net gains for each platform by month are shown in the following diagram:

    RIM and Microsoft have continued to lose users while Google and Apple have continued to gain.

    The two trends that continue are that overall penetration is nearing saturation and that two platforms seem to be increasing their share of that base. The "comeback story" for any of the hopefuls will depend either on switching users away from their current platforms of trying to engage with late adopters. The first option is daunting due to latent network effects related to platforms and the second sounds to be symmetric to existing incumbent strategies.

    Without an asymmetric approach, the challengers are unlikely to succeed.

  2. Segmenting the iPhone opportunity

    Research · 45 comments

    We've been very, very focused on China. China, we've had incredible success with iPhone. Over the past few years, we've gone from a few hundred million dollars of revenue in greater China, to last year $13 billion. So we really've been focused on trying to understand the market there and then taking those learnings to other markets. As it turns out--and not very many people agree with me on this, probably--but what I see is that there's a lot of commonality in what people around the world want.

    Transcript: Apple CEO Tim Cook at Goldman Sachs - Apple 2.0 - Fortune Tech

    People do want the same things globally, but due to various constraints they typically don't get the same things at the same time.

    One of the most important constraints on the purchase of iPhones is the state of 3G (or, more broadly, mobile broadband) networks. An iPhone is a mobile computer whose primary value is derived from high bandwidth data communication. Because this bandwidth is not universally available, the iPhone faces a restricted addressable market.

    The good news is that 3G networks are being adopted very quickly. The International Telecommunications Union reports that 20% of mobile users have "active subscriptions to mobile broadband" (1.2 billion out of 6 billion). That's encouraging but the subscription rate varies widely by country. Ideally we should look at the data on a country-by-country basis.

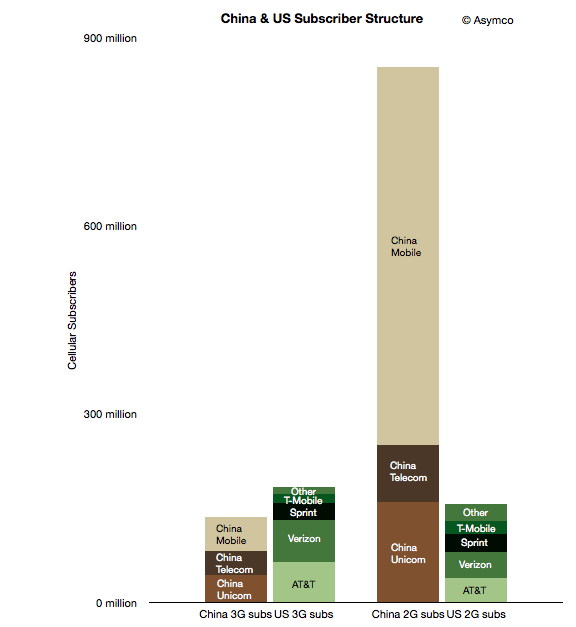
    To start, I took a look at two countries which may form an interesting sample: the US and China. The following chart shows the subscriber structure in the two countries grouped by 2G/3G subscription and by operator.

    The two left-most columns represent nominally addressable iPhone markets. The two right-most columns represent currently unaddressable markets. Note that

    although China is a far bigger market, the lower 3G penetration means that the theoretically "addressable" market for the iPhone is smaller in China than in the US (136 million vs. 183 million respectively).

    However, there are further restrictions. Apple does not have distribution agreements with many (most?) of the world's operators. In these particular countries, China Mobile, T-Mobile and "Other" US operators do not distribute the iPhone. We should subtract those operator customer bases out of the addressable market. But those conditions are variable: operators may sign up for future versions of the phone and 3G subscription rates are increasing. That means we can segment the market as follows:

    1. Currently addressable operators and 3G subscribers
    2. Potentially near term addressable users if all operators agree to distribute the iPhone in these countries
    3. Potentially longer term addressable users if all users switch to 3G and all operators distribute the iPhone.

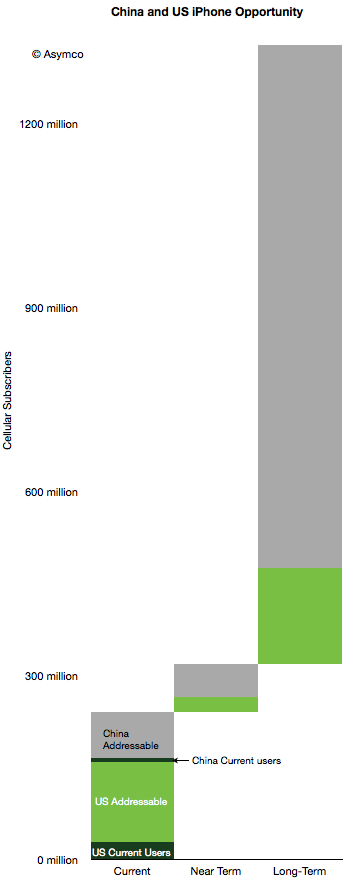
    This segmentation leads to the following diagram.

    I also added the current users given comScore data for the US (29 million) and an estimate of 8 million Chinese users. Here are some observations:

    1. 10% of China's currently addressable market is penetrated while the US penetration is 18%.
    2. If all operators would agree to distribute the iPhone (i.e. including "Near Term" in the addressable total), the Chinese penetration would be 6% and the US 16%.
    3. If we include all users as addressable, China is about 0.8% and the US is at 8.5%.
    4. The penetration of the iPhone in the US and China combined therefore stands at about 3% today.

    The question that comes next is what is a reasonable limit to total penetration? What can we reasonably expect or what could Apple reasonably target?

    I've been using a global share of 20% as a reasonable target to test growth assumptions. Assuming no significant growth in user bases, 20% share in the long term (>5 years) yields a total of about 258 million users. That's equivalent to a 7x increase. Put another way, a 5x increase yields a market share of 14%.

    Note that these are "penetration" figures or share of available users. This is in contrast to share of units sold in a given quarter. Apple has maintained 20% share of smartphones fairly consistently. If share of units sold in any given time period remains at or above 20% and if smartphones and 3G networks become ubiquitous then reasonable men might consider these targets obtainable.

  3. Tim Cook on the "Law of Large Numbers"

    Research · 69 comments

    Q: 37 million units of iPhones shipped. When do we run into the Law of Large Numbers? What are the growth opportunities coming up?

    A: 37 million is a big number. It was a decent quarter. It was 37 million -- more than we'd ever done before. We were pretty happy with that, but let me give you the way I look at the numbers. As I see it, that 37 million for last quarter represented 24% of the smartphone market. There's 3 out of 4 people buying something else. 9 out of 10 phone buyers are buying something else.

    Handset market is projected to go from 1.5 to 2 billion units. Take it in the context of these numbers, the truth is that this is a jaw-dropping industry with enormous opportunity. Up against those numbers, the numbers don't seem so large anymore. What seems so large to me is the opportunity.

    What we're focusing on is the same thing we've always focused on. Making the world's best products.

    We think if we stay laser-focused on that, and continue to develop the ecosystem around the iPhone, that we have a pretty good opportunity to take advantage of this enormous market.

    Q: The biggest opportunity is the emerging markets. Large portion of that is the prepaid market. Apple has done very well but the wholesale iPhone price point is nowhere near what we would expect in the prepaid market. How do you make it more affordable to those markets?

    A: Those markets are critical. The smartphone market is projected to be 1 billion units in 2015, 3 years from now. 25% of that is projected to come from China and Brazil. Just two of those markets -- 25% -- obviously those are very critical markets, but there are others as well.

    We've been very focused on China. We've had incredible success with iPhone -- we've gone from a few hundred million in revenue to last year with $13 billion. We've been really focused on trying to understand the market there and taking those learnings to other markets. As it turns out, not very many people agree with me on this, probably.

    What I see is that there is a lot of commonality in what people around the world want. Everyone in every country wants the best product as it turns out. They're not looking for a cheap version of the best product -- they're looking for the best product.

    In the emerging markets there are very big differences in go-to-market. In most of the developed market, the carrier owns most of the distribution. In emerging markets, the retailer has most of the distribution. The whole go-to-market has to be changed significantly. Last year, we covered price points in the subsidized markets from $0 on up. That doesn't translate to zero in the prepaid market, but we're covering more price points there.

    The paramount thing is the product. It is the focus. Of course distribution, we've recognized the difference there and in purchasing power. Unlike many people, I don't subscribe to the premise that prepay is prepay is prepay. We convinced China Unicom to try to postpay. It wasn't big there but they tried it and it's working really well. It's great for everyone because customer gets cheaper phone and carrier locks in a customer. It's a different way to look at the issue and it's been successful in China.

    When Apple introduced the iPod in 2001, when we launched the iTunes Music Store and launched that on Windows, the iPod created a halo for the Mac. For 23 straight quarters we've outgrown the market on the Mac.

    The halo that was created by iPod for the Mac, was created in developed markets. It was created in the US, Western Europe, Japan, Australia, Canada. It didn't work nearly to the same level in Eastern Europe, Middle East, Africa, China, Latin America. People were already getting music from their phones. The world changed for us when the iPhone was launched.

    The iPhone introduced Apple to millions of people -- our brand -- to people who had never met Apple before. Now, it's interesting to look -- take China as an example -- last year the Macintosh grew more than 100% in China, year-over-year. Not on a big base, but 100% is pretty good. The market grew 10%, so we outgrew the market 10x.

    The iPhone is creating a halo for the Macintosh. iPhone has also created a halo for iPad. You can definitely see the synergistic effect of these products, not only in developed markets, but also in emerging markets where Apple wasn't resonant for most of its life.

    Via: Apple CEO Tim Cook Speaks at Goldman Sachs Technology Conference - Mac Rumors

  4. [Updated] The rise and fall of personal computing

    Research · 293 comments

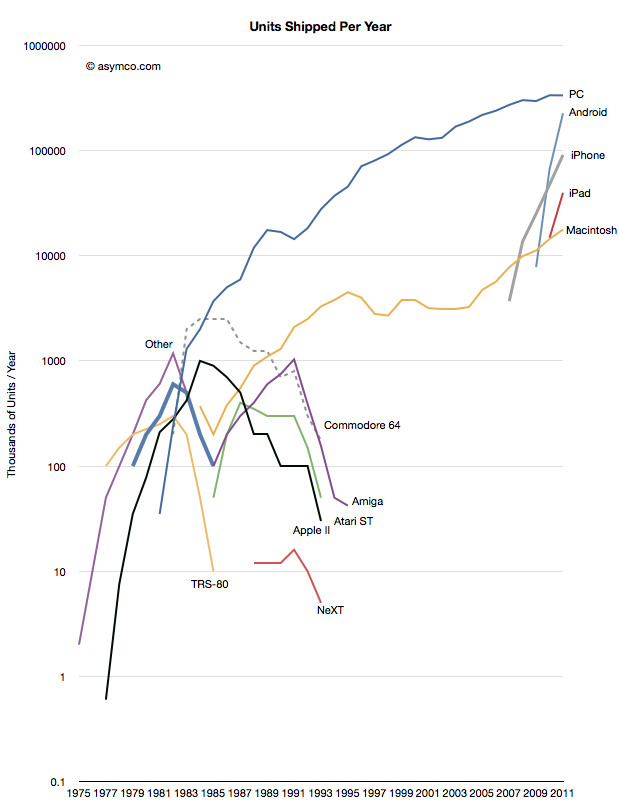
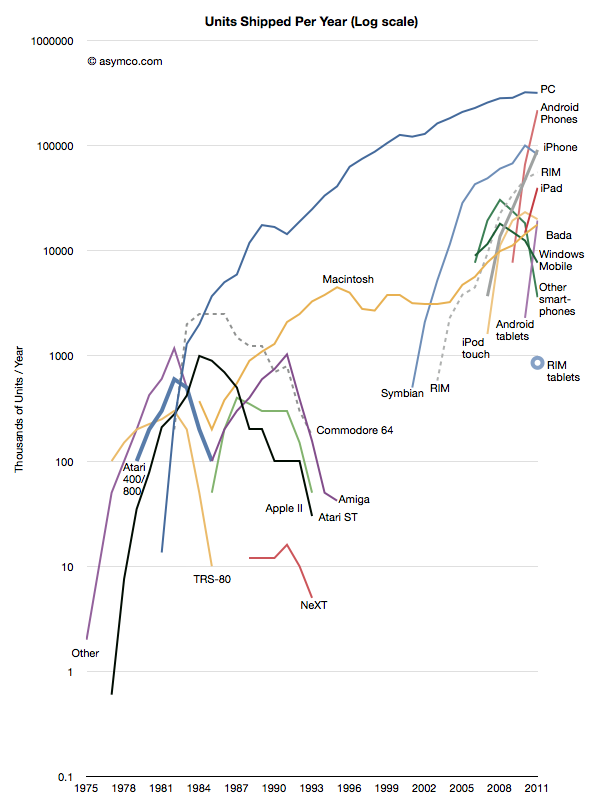
    Thanks to Jeremy Reimer I was able to create the following view into the history of computer platforms.

    I  added data from the smartphone industry, Apple and updated the PC industry figures with those from Gartner. Note the log scale.

    The same information is available as an animation in the following video (Music by Nora Tagle):

    httpv://www.youtube.com/watch?v=8h-C6u4yLj4

    This data combines several "categories" of products and is not complete in that not all mobile phone platforms are represented. However, the zooming out  offers several possible observations into the state of the "personal computing" world as of today.

    1. We cannot consider the iPad as a "niche". The absolute volume of units sold after less than two years is enough to place it within an order of magnitude of all PCs sold. We can also observe that it has a higher trajectory than the iPhone which became a disruptive force in itself. Compare these challengers to NeXT in 1991.
    2. The "entrants" into personal computing, the iPad, iPhone and Android, have a combined volume that is higher than the PCs sold in the same period (358 million estimated iOS+Android vs. 336 million PCs excluding Macs in 2011.) The growth rate and the scale itself combine to make the entrants impossible to ignore.
    3. There is a distinct grouping of platform options into three phases or eras. The first lasting from 1975 to 1991 was an era of rapid growth but also of multiple standards and experiments. It was typical of an industry in emergence. The personalization of computing brought about a new set of entrants. The second phase lasted between 1991 and 2007 and was characterized by a near monopoly of Microsoft, but, crucially one alternative platform did survive. The third phase can be seen as starting five years ago with the emergence of the iPhone and its derivatives. It has similarities to the first phase.

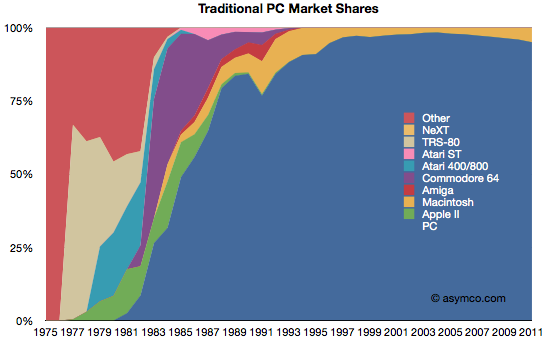
    We can also look at the data through a slightly different view: market share. Share is a bit more subjective because we need to combine products in ways that are considered comparable (or competing).

    First, this is a "traditionalist" view of the PC market as defined by Gartner and IDC, and excluding tablets and smartphones.

    This view would imply that the PC market is not changing in any substantial way. Although the Mac platform is gaining share, there is no significant erosion in the power of the incumbent.

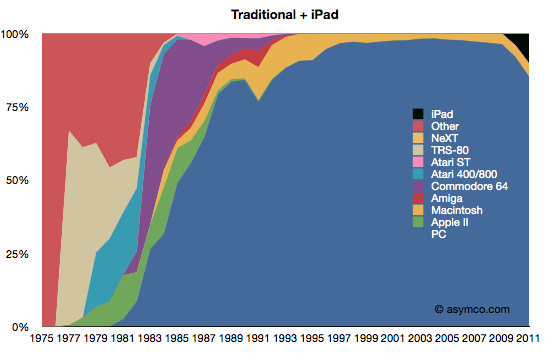
    Second, is a view where the iPad is added to the traditionalist view.

    This view is more alarming. Given the first chart, in order for the iPad to be significant, it would need to be "visible" for a market that already ships over 350 million units. And there it is. If counted, the iPad begins to show the first disruption in the status quo since 1991.

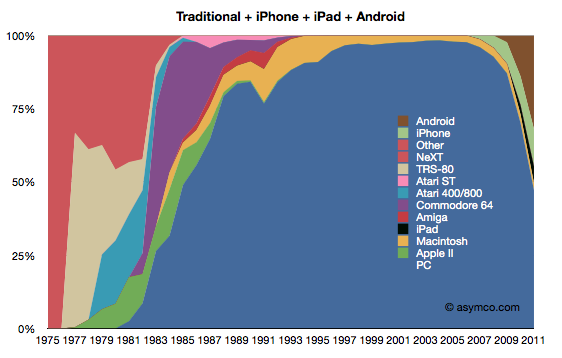
    The third view is with the addition of iPhone and Android.

    This last view corresponds to the data in the first graph (line chart). If iOS and Android are added as potential substitutions for personal computing, the share of PCs suddenly collapses to less than 50%. It also suggests much more collapse to come.

    I will concede that this last view is extremist. It does not reflect a competition that exists in real life. However, I put this data together to show a historic pattern. Sometimes extremism is a better point of view than conservatism. Ignoring this view is very harmful as these not-good-enough computers will surely get better. A competitor that has no strategy to deal with this shift is likely to suffer the fate of those companies in the left side of the chart. Treating the first share chart as reality is surely much more dangerous than contemplating the third.

    I've used anecdotes in the past to tell the story of the disruptive shift in the fortunes of computing incumbents and entrants. I've also shown how the entry of smart devices has disrupted the telecom world and caused a transfer of wealth away from the old guard.

    The data shown here frames these anecdotes. The data is not the whole story but it solidifies what should be an intuition.

    [Update]

    Additional platforms added to the first chart.


  5. The effect of smartphone growth on share prices

    Research · 17 comments

    Data on Q4 performance is starting to trickle in. Last week Motorola, as part of a profit warning, revealed their Q4 smartphone shipments were 5.3 million. RIM had reported 14.1 million units (quarter ending November). HTC has also warned that their shipments of smartphones (and tablets) totaled 10 million. Samsung provided guidance on overall sales but since they don't report data on smartphone (or phone) sales, the estimates are ranging between 32 and 35 million.

    Many have forecast Apple's performance but there are many other companies which are not easily estimated (Sony Ericsson, LG, Nokia, ZTE, Others.) But rather than dwelling on the specific quarter, we can make some long-range estimates of performance based on the historic data.

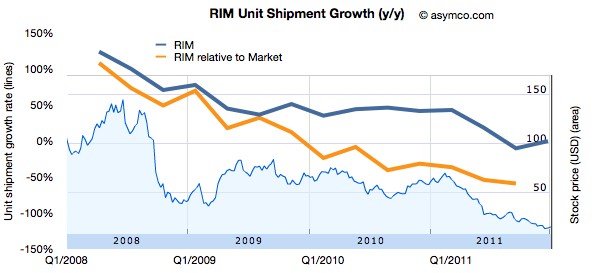
    One method I use is to look at patterns of growth. Growth is the first derivative of market performance and it sometimes shows patterns which the performance itself does not. Consider the following chart showing the growth pattern for RIM.

    The blue line shows the absolute year-on-year quarterly growth based on reported numbers of smartphones shipped. I've also shown the growth "relative to market" which is unit growth with market growth subtracted. This orange line represents how much faster (or slower) the company is growing relative to the market. If the orange line is above zero, the company gained share. If it's below zero, it lost share.

    I also overlaid the performance of the share price (right scale).

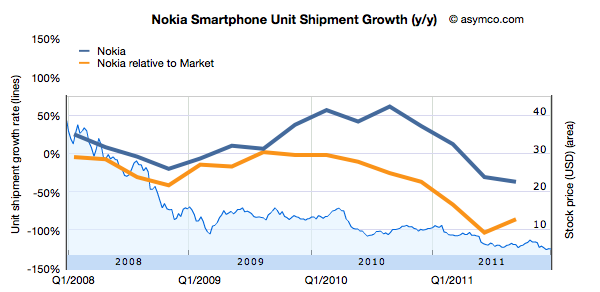
    Now compare that with another long-term incumbent in the smartphone market, Nokia. 

    Bearing in mind that the scales are identical, Nokia's relative performance has been negative since early 2008. Persistent negative smartphone performance relative to market growth causes persistent loss in share price.

    What about other, more recent competitors?

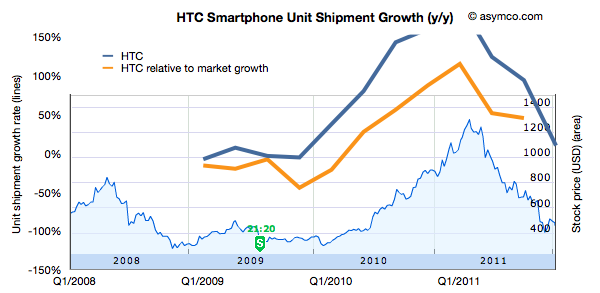
    HTC is not a recent entrant in smartphones, and has gone through a phase of growth with Windows Mobile in the 2000's. This is its pattern of growth (and its share price).

    Keeping the scale for growth consistent with the other companies leads to a bit of clipping but the pattern of rise and fall also seems correlated to share price performance.

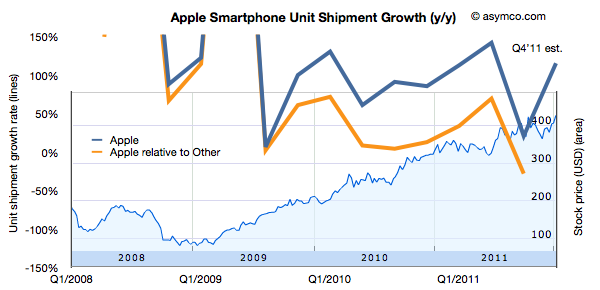
    Finally, the following is the same analysis applied Apple.

    Again, keeping the growth scale consistent leads to some clipping, but the pattern remains observable.

    What seems to be rewarded to various degrees is consistency in growth of smartphones for companies which are primarily engaged in the market. However, failure to grow is punished with severe share price declines.

    Being able to forecast smartphone growth seems to be useful, at least in the time frame of one or two years.

  6. The curious case of slowing US growth for Android

    Research · 158 comments

    The latest data from comScore MobiLens is showing an uncharacteristic slowing in smartphone growth. In the survey period ending November, the number of smartphone users in the US was 91.4 million. This is equivalent to 39.1% penetration, an increase of 0.6% (i.e. up from 38.5% in the last period.)

    The growth is equivalent to 1.4 million new smartphone users (i.e. users who switched from a non-smart device for the first time.) The problem is that this is half the growth of the previous period. The following chart shows the growth as the weekly add rate.

    As you can see, the growth has fallen to a level not seen since 2010. The cause may be seasonal as last November was also a slow month. I added a three month moving average which shows that although there seems to be seasonality, the last period did not show the peak of previous periods.

    To better understand what happened, I looked at the performance by platform. The following chart shows the net user gains by platform.

    What appears immediately is that Android growth was the primary cause of a change in the pattern. The iPhone grew slightly more slowly sequentially but the difference between November and previous periods is not great (941k adds vs. an average of 904k over the previous 12 months.) BlackBerry moderated its losses and Windows is quite a small influence on the market.

    Android gain was 1.2 million vs a trailing twelve months' average of 2.24 million. Android's slowing in the US is significant.

    We also have access to additional data from Google themselves. We had an update that showed that by late November there were 200 million Android devices activated. We also had an update from mid October of 190 million activations. That makes the increase in activations of at least 10 million during the same period that comScore was measuring the US.

    comScore's increase in Android users of 1.2 million then becomes even more interesting. It implies that the US consumers were responsible for no more than 12% of Android activations in the November time frame.

    Furthermore we can derive from comScore's data the total devices in use in the US by platform: the figure for Android is 42.9 million (46.9% of 91.4 million smartphones in use). By the end of November, the total activations from Android adds up to about 204 million. Excluding some devices which may be out of use, we can estimate that about 20% of all active Android phones are in use in the US. Conversely 80% of Android devices are in use outside the US.

    This means that the US share of Android activations is decreasing. From a cumulative average of 20% to a recent 12%.

    So the mystery of what caused the slowing in Android (and hence in all smartphones) in the US remains. Seasonal effects would affect all platforms equally and that is not the case. I'm not comfortable ascribing a cause until we hear more evidence and the pattern is more established. But something does seem to be happening.

    [Update: The source data is available here. Note:  multiple tabs.]

  7. The parable of RIM

    Research · 155 comments

    Here are the highlights from RIM's latest quarter:

    • 14.1 million BlackBerry smartphones shipped, 13 million sold through
    • 150k PlayBook shipped with sell-through slightly higher. 800k PlayBooks shipped so far.
    • BlackBerry subscriber base up to 75 million
    • High growth cited for U.K., France, South Africa, Mexico and Argentina, Indonesia, Saudi Arabia and South Africa. RIM is the #1 smartphone vendor in the Latin America and Caribbean region. Sales outside the US, UK and Canada were 61% of revenues. US is now 20% of sales, UK 11%.
    • Hardware growth outside the US was 56%
    • There are 630 carriers
    • 50k apps in App World with 5 million downloads per day
    • Forecasting 11 to 12 million smartphones next quarter

    Given the channel fill with a new product, the device business was marginal at best. The company obtained -1% growth y/y in units but 31% sequential growth from a transitional quarter. The average selling price (inclusive of service revenues) is $354 and about $280 excluding service revenues. I estimate that operating margins have dropped to about 11%. Not a good story, but one we have been warned to expect.

    But a crucial new twist to the story is that RIM announced that they don't expect new BlackBerry 10 devices until late next year. That came as a surprise and the stock sold off significantly, valuing the company at well below book value.

    Stepping back, the biggest surprise is that the company seems to have had no plan for sustaining itself.

    Let me explain.

    If you go back to 2005 or so the world of smartphones was a mix of modular OSs and integrated platforms, much as it is today.  Not unlike Android today, Windows Mobile was successful in licensing to dozens of vendors who in turn released hundreds of products. Symbian also was licensed but most volumes came from Nokia and they held the lion's share. Then there was the BlackBerry integrated solution which worked smoothly and had devoted fans who upgraded every chance they had and operators who were joyous at the new ARPU. There was also PalmOS as offered by PalmSource trying to be a "third horse" and unseat stodgy old Microsoft.

    It was into that fray that both Apple and Google jumped. Google acquired Android in 2005 and Apple was busy polishing a version of OS X that would became iOS. In three and two years respectively these platforms would be in the market.

    Regardless of the actions of rivals, all competitors must have faced the same questions in 2005: As technology was changing rapidly and as they all had access to component roadmaps, what is the best technology approach to this market? Should they embrace certain innovations to sustain their business trajectory? RIM had a tightly integrated software, hardware and service offering. What could make it better? Nokia was also basing its products on a more loosely integrated offering (nominally it was modular, but only just). It saw the writing on the wall and began developing a Linux variant (Maemo) as a potential candidate to replace Symbian. Microsoft was basing its solution of a modular approach. Windows CE was ok as a kernel but they had layers on top which were optimized around stylus-based user experiences (analogous to mouse actions). Could it take on a rich computing experience?

    There were many experience candidates. Stylus, keypad, keyboard all had adherents. There was a lot of hesitation. After the iPhone launched with capacitive (finger) touch, resetting user expectations, it still took a year for many of the vendors to re-consider their technology plans. The weakest changed first.

    Microsoft felt the pain quickest. They also had the least to lose since revenues from Windows Mobile were paltry. By 2008 internally they turned 90 degrees. They embarked on re-building their user experience and orphaning the Windows Mobile ecosystem and many of the vendor relationships they had built. Palm dropped PalmOS and built WebOS internally quite quickly. They licensed Windows Mobile as a stop-gap. Around the same time Nokia doubled down on Maemo and joined with Intel to form MeeGo. They did not orphan Symbian though and kept trying to adapt it to the new experiences and input methods.

    But RIM did nothing. Almost nothing. They were the healthiest competitor. They felt no pain from iPhone's entry. The platform they had built was still growing and they were tweaking it constantly. There were always improvements to point to but fundamentally the code was limited. It was very difficult to adapt it to touch input and the first attempts at a touch UI were embarrassing. But there were no signs of a new platform that reflected the Unix-like competition.

    As I pointed out in an earlier post, Unix-like operating systems were having their revenge. To a computer scientist the future of mobile computing would mirror that of personal computing in terms of architecture. The foundations of the early smartphones were built on constraints that were disappearing while being unable to accommodate new input methods. In other words, the early efforts were optimized around those constraints and sub-optimal for rich user experiences. They had to be. There were limited processors, memories and screens and battery life.

    It turned out that all the early mobile operating systems were unsuitable for the advances in technology that came after 2007. Companies which were able to adapt or embrace Unix-like operating systems in a mobile context gained the ability to grow with the new input methods. The sooner they "pulled the trigger" on the shift, the better off they were. This is in fact what enabled entrants to gain footholds. Entrants entered with Unix-like OSs straight away while incumbents had to justify changing and the more successful they were the harder it was to justify changing.

    RIM had trouble justifying this change. It waited until 2010 to finally acquire the QNX asset that would offer them a stronger software foundation.  It still had to adapt this acquisition and it looks like it won't be done until at least 2012, seven years after they should have started. And this should be seen as a sustaining technological change. A new OS is not a disruptive technology to what is already a mobile computer.

    However, delays like these can be fatal. We see the impact on Microsoft who was earliest to push the reset button in 2008. It still took two years to rebuild Windows Mobile into Windows Phone and is now still struggling to regain lost share (less than 2% today). We see the impact on Nokia which was unable to affect a transition to MeeGo due to a litany of issues and had to throw in the towel on self-determination. We see the impact on Palm which lost its independence as WebOS was a bit too little too late.

    These companies had the right technical strategies but suffered from execution and business architecture issues. RIM is years late in embracing what appears to be a sustaining improvement.

    But whenever you see what appears to be a coordinated effort by companies to fail simultaneously you have to ask if the change they struggle with is really sustaining or disruptive. The pattern makes me suspicious that what RIM, Microsoft, Palm and Nokia faced was more than a failure to embrace a sustaining improvement. I suspect that the failure is evidence of tectonic shifting of business models.

  8. Global smartphone penetration nearing 10%

    Research · 43 comments

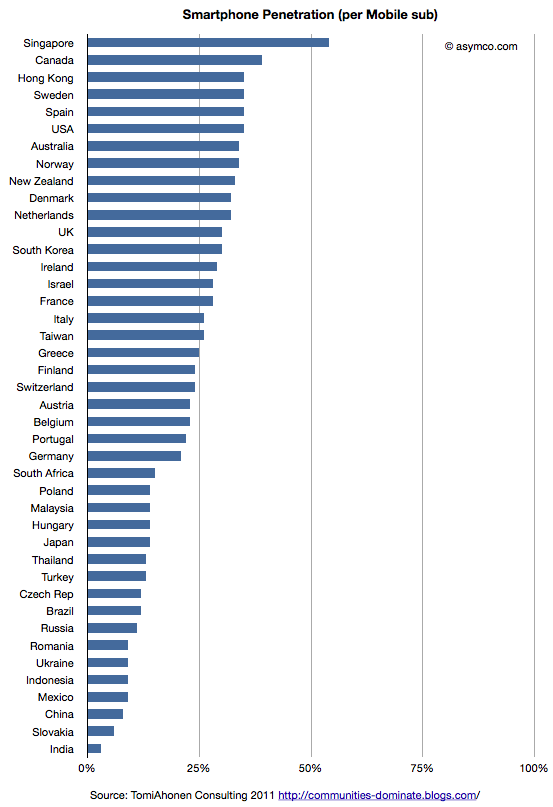
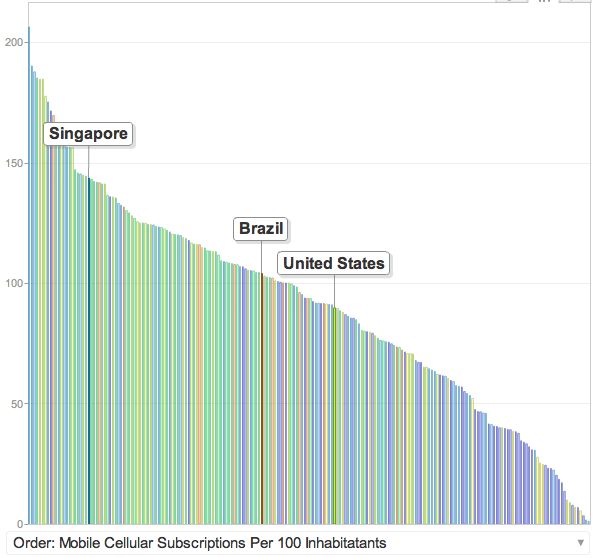
    Tomi Ahonen has compiled a fascinating data set on 42 major countries' smartphone penetration rates. The compilation is based on Netsize Guide, Informa, Google and Ipsos data. It is a complex sample with multiple possible sources of error (read the post for the caveats.) However, this is a breakthrough. It's the first time I've seen this level of detail at a country level in the public domain.

    I maintain visualizations of ITU data which shows overall mobile consumption and broadband consumption and penetration. In order to maintain a consistent basis of comparison, I prefer to use ITU's measure of consumption which is "subscriptions" rather than "population". The ITU derives this measure because mobile operators think of points of connection (subs) rather than people as the measure of consumption. This makes some sense because connections are what are monetized--not people.

    So the first piece of analysis is to show this measure of penetration (smartphones as a percent of subscriptions) for the 42 sampled countries.

    This view shows which countries "lead" adoption in terms of penetration. It shows that the US is quite high in the ranking and the most penetrated "large" country.

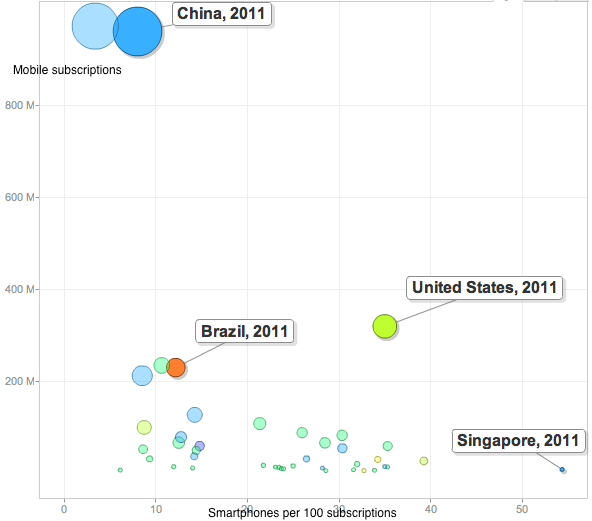
    This is highlighted by the following chart which shows penetration of smartphones vs. total subscriptions with bubble size representing population size.

    The US stands out from the inverse relationship between size of mobile population and smartphone penetration.

    Part of this is due to the US having relatively low mobile penetration in general. It's below the median because multiple mobile phone use is uncommon.

    But these bits of data are not the most interesting. In my opinion the following is:

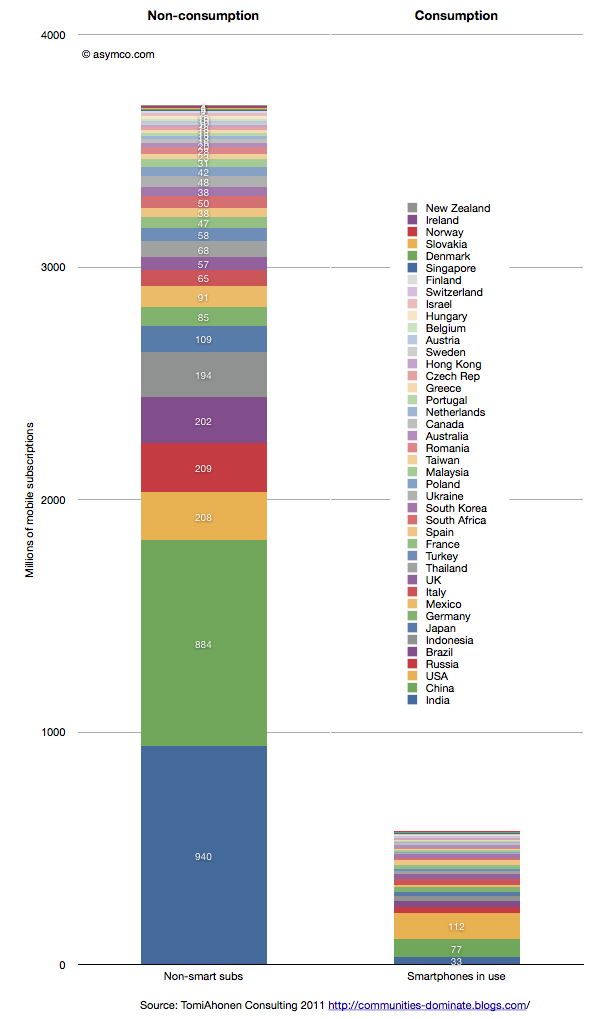
    This last chart shows the total size of non-smart subscriptions vs. the total size of smartphones in use for the 42 countries listed in the legend.

    There are 3.7 billion non-smart connections and 0.6 billion smartphones in use. Although not all of these 3.7 billion connections need to be enabled with a smartphone, the fact remains that there are six times as many non-consuming network connections that can still be addressed.

    How and when this ocean of non-consumption will be converted to computing devices are the most obvious questions the data raises. Of the selected countries only 13.5% of the connections are "smart".

    ITU data shows that at the end of 2010 there were 5.4 billion global subs. This survey was conducted more recently so the total is likely much higher (perhaps around 6 billion). The survey thus covers about 72% of the world. That implies that at least 90% of the market remains unserved.

  9. Will Windows Phone get to compete with non-consumption?

    Research · 45 comments

    Before diving into the answer to the question in the title, there is some new data to digest.

    The latest from comScore shows consistency with the previous months of smartphone growth in the US.

    • The growth rate was 607k/wk new-to-smartphone users. This is slightly down from 654k/wk for the previous month but up significantly from 450k/wk the year before.
    • The penetration of smartphones reached 38.5% (non-smartphones are at 62%)
    • The penetration should reach 50% before September 2012 with about 1.2% being converted every month.

    The following chart shows the weekly add rate with a three-period moving average:

    This chart is important in that it should first show signs of inflection in growth. That does not seem to be happening yet.

    The installed base by platforms is shown below:

    Android is estimated to have grown to 41.7 million users in the US, adding 2.5 million users in the last month. Android is adding half of Microsoft's entire US mobile base every month.

    RIM BlackBerry lost one million users in October. RIM's slide has accelerated again with over 3.7 million leaving the platform in the last six month. With 15.5 million subscribers, RIM has fewer users in the US today than it did in late 2009.

    iPhone gained 1.34 million. Installed share increased slightly to 28% from 27.4% the previous month. There are now over 25 million iPhone users (above age 13) in the US.

    Windows Mobile/Phone had no perceptible change (-34k) indicating perhaps that the losses in Windows Mobile are being erased by gains in Windows Phone. Microsoft's platform stopped losing significant users six months ago. Whereas the bleeding has been stopped, overall number of users remains at a rather poor 5 million or 5.4% share.

    "Other" which includes Symbian and WebOS lost another 184k users to reach only 2.7 million users.

    There are still 144 million smartphone non-consumers.

    Android and iPhone now make up nearly three quarters of all smartphone ownership in the US. That's a total of 67 million users. With no sign of slowing, the chances are that there are at least 100 million users still remaining to convert. Sounds like an attractive target. But that target is shrinking fast. The rates of adoption signal saturation of most likely buyers will happen toward the end of next year.

    At least 25 million new Android users will be gained and at least 10 million new iPhone users will be created in the next 12 months. That's 35% of remaining non-consumption. Assuming some acceleration, it's not hard to see 50% being claimed by the two entrenched incumbents.

    This leads to an interesting positioning question. Is Windows Phone destined to compete with consumption or non-consumption? If traction is not forthcoming in the next 12 months, that leaves a very difficult last 50 million available as non-consumers. They are more difficult as they will be late adopters and perhaps more price sensitive and less motivated by features.

    Windows Phone still has quite a bit of opportunity outside the US, but in the US (and in Europe which is not much different) the competition will increasingly be with rival incumbencies not with non-consumption. As the custodians of the Windows franchise, Microsoft should be well aware of the inherent difficulties with competing with installed platforms.

  10. Apple could buy the mobile phone industry | Updated

    Research · 84 comments

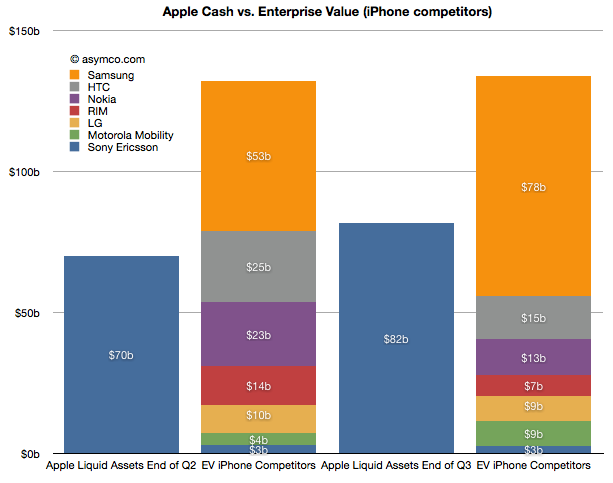
    The last time I did this comparison (Apple could buy the mobile phone industry | asymco) was in June after the end of the second quarter. The following chart is an updated look.


    Here is a discussion of the changes since the last analysis:

    • Sony Ericsson was valued through its acquisition by Sony. We did not have a way to value the enterprise before as it was not traded independently. Last June I estimated a 14x multiple on its trailing twelve months' profits and got $3.0 billion. Since then half the company changed hands for about €1.05 thus yielding a total company value of $2.8 billion. The enterprise value should be therefore slightly lower but I'll stick with the current transaction value as the EV.
    • Motorola Mobility has entered into an agreement to be acquired by Google for $12.5 billion by Google. The company's enterprise value jumped as a result to about $8.6 billion.
    • RIM's share price collapsed and it's now also trading at an EV of about 7.3 billion (Yahoo finance).
    • Nokia's price has also dropped and it now has an EV of about $13 billion (Yahoo finance).
    • HTC recently dropped significantly in price and is now worth about $15 billion EV. (Note that pricing of its equities is subject to suspended trading due to drop limits).
    • LG's phone business is still losing money and it's still difficult to value. In November it was revealed that the company was seeking to raise $890 million in capital to fund new initiatives including smartphones. The share price fell by 14%. In June I suggested a nominal value for the phone business of $10 billion. I think that's very generous and with recent events I would place that value at $9 billion today.
    • Samsung's fortunes have increased. In June I applied a 14x multiple to their trailing 12 months' operating earnings. Given overall discounting of the sector I applied a multiple of 13 today. That yields a business value of $78 billion. Interestingly, that is larger than the value of all other competitors apart from Apple. That also makes it six times more valuable than Nokia.
    • Apple's cash and cash equivalents and investments grew by about $12 billion and were worth about $82 billion as of October.

    In summary, in June Apple's cash was about 53% of the sum of competing phone vendor enterprise values. Today it's about 61%. Excluding Samsung, Apple could buy the industry and still have $25 billion left over. This makes the claim that "Apple could buy the industry" even more believable.

    This analysis is mainly academic. It does not imply that any such transaction will take place. As the purchase of Motorola shows, control has a premium and individual buyers may be less "rational" than markets. What it does show however is that the entire industry is in a state of crisis. Valuations for phone companies are collapsing and two major brands (Motorola and Sony Ericsson) are being absorbed and could disappear.

    At the same time entrants are arriving with completely different business models. Amazon, Facebook, Baidu, Alibaba are intent on selling phones or platforms to be valued as enablers for asymmetric business models rather than as phones. One could argue that what Apple itself sells is more than hardware and that its value-add "on top" of hardware is increasing. This is a sign of commoditization. Certainly the voice business is well beyond that point but it now appears that even the smartphone business is already in an advanced state of value compression.

    All the while the overall market is growing. I had separately looked at the profit pool and concluded that the brands are suffering. Summing up the votes from stock markets, the sentiment is even worse. 2012 is looking more and more as a year of inevitable and dramatic industry change.

  11. The AMP Index for Q3

    Research · 48 comments

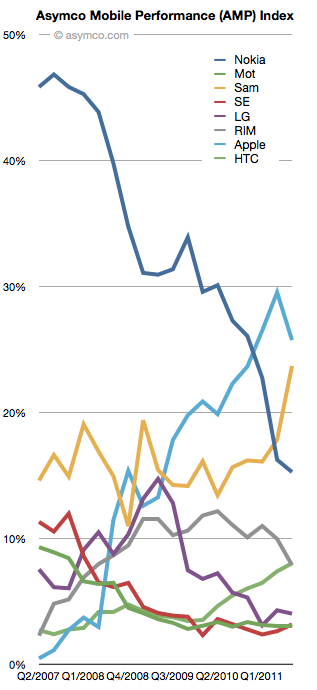
    The Asymco Mobile Performance (AMP) index is an unweighted average of:

    1. Share of all handset units sold (global)
    2. Share of smartphones
    3. Share of value (revenues)
    4. Share of profits

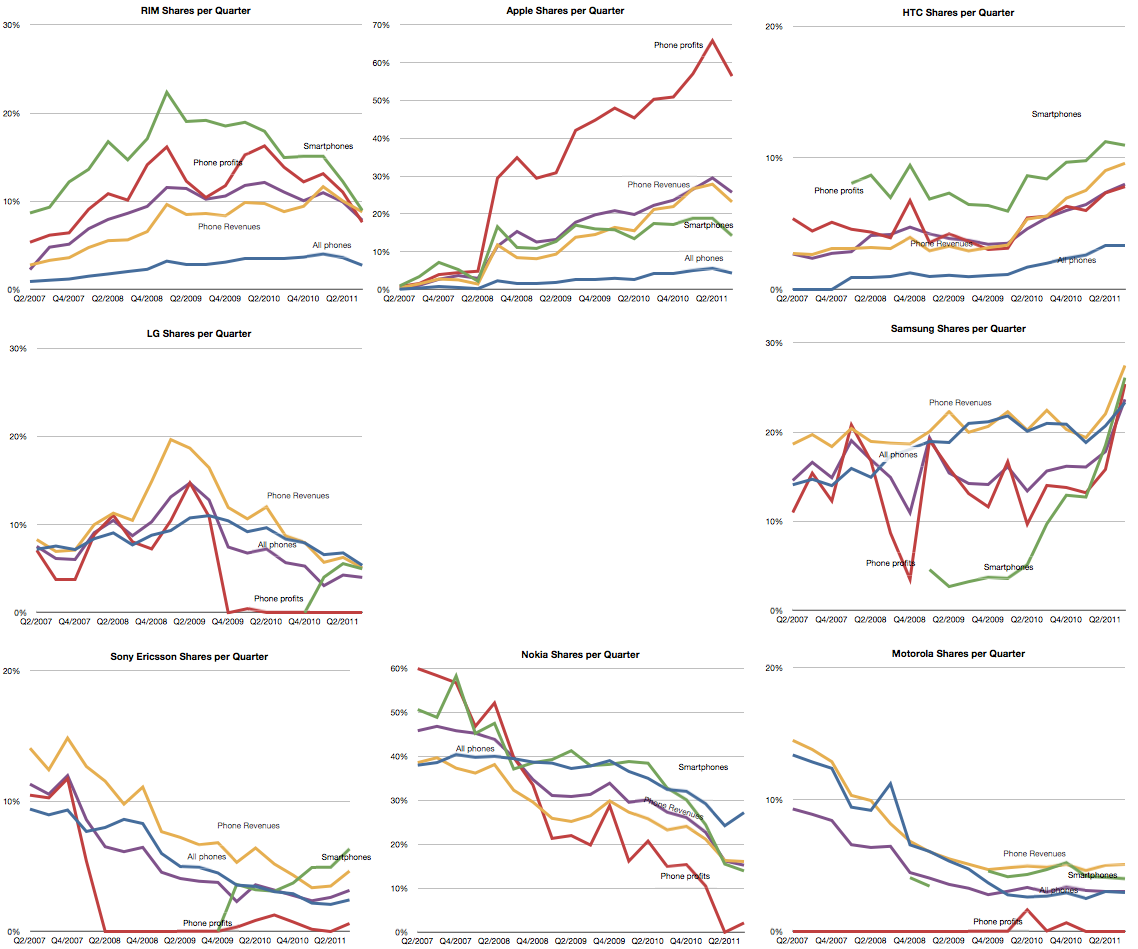
    For major phone vendors. The raw data for each share is shown in the following charts (note change of vertical scale: each gridline represents 10%).

    Note that the vendors are arranged in a particular way: top row are entrants, bottom row are incumbents with late incumbents from Korea arranged in the middle.

    Taking the average of each of the lines above, the unweighted share index (Units, Smartphones, Value and Profit) is shown below:

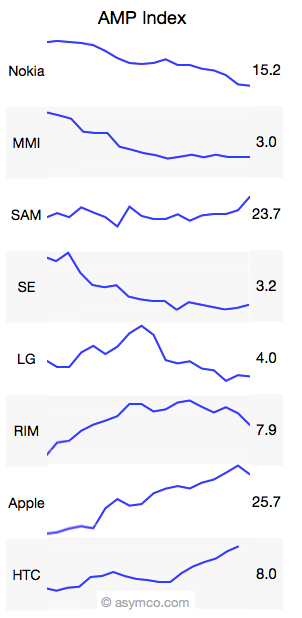
    And here it is in sparklines:

    Like many indices, this is a generalization that measures a section of reality. The value is in its use as a benchmark and trend analysis.