Asymco

Asymmetric Intelligence

smartphone

  1. Nokia employs as many people to develop its smartphone software as Apple does to develop all its products

    Research · 106 comments

    In a recent post I pointed out that Apple's R&D was about 2.2% of sales in the last quarter. Bernstein took a look at the R&D for Nokia and presented a chart showing the difference between the mobile industry players in terms of total expenditure on R&D.
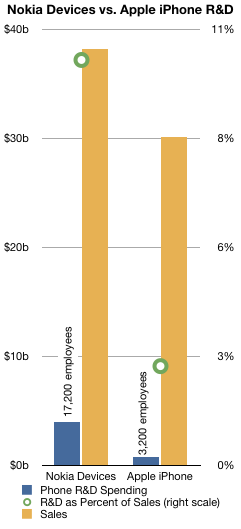
    I took inspiration from that to plot the Devices R&D for both Nokia and Apple over the entire 2010 period. I also compared that with sales and computed the ratio between R&D and sales.

    The result is shown in the chart on the left.

    Bottom line: Nokia spent 10.2% of phone sales in 2010 on phone R&D while Apple spent 2.5%.

    Bernstein goes on to argue that at least for Devices,

    Nokia spent $3.9bn in R&D in 2010, almost 3x the average of its peers, 31% of the industry's R&D total spending, for an output that we can qualify as visibly disappointing.

    To relate the $3.9 billion for Devices into head count, they estimate that Symbian projects employ 6,200 people; MeeGo and Qt 1,800; Services 1,800; and S40 1,800. Hardware headcount is assumed to be 4,700 and 900 more for fundamental research.

    So Nokia's total software headcount adds up to 11,600 people. Nokia smartphone headcount adds up to about 8,000.
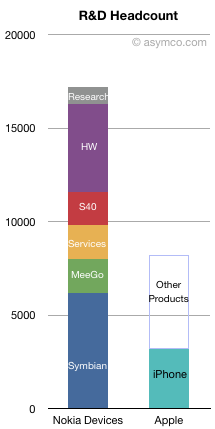
    Applying a similar formula ($240k/employee[1]) to Apple's estimated iPhone R&D (from Bernstein's chart) yields a headcount of about 3,200 and a total Apple company R&D headcount of 8,200.

    So Nokia employs about the same number of engineers[2] for its smartphone software platforms as Apple does for all its product lines[3].

    In fact, Symbian alone may cost twice as much to develop than the iPhone (including the hardware).

    ---

    Notes:

    1. The cost per employee is obviously different between the companies as they operate in different countries. However there are enough sources of error in these estimates that they probably overwhelm the cost of living/tax differentials.
    2. I know that engineers are not all that R&D headcount covers, but let's assume that the mix of overhead is similar for the two companies.
    3. The total for Symbian + MeeGo is 8000 and the total for Apple overall is 8,200, however one can comfortably allocate 200 out of 900 researchers out of Nokia research to their mobile software effort.
  2. Making it up in volume: How profit and volumes traded-off in the fourth quarter

    Research · 24 comments

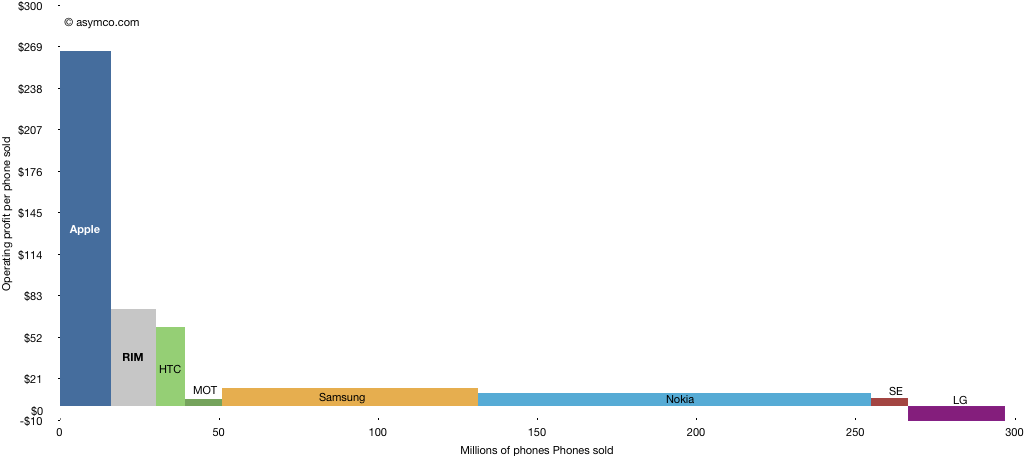
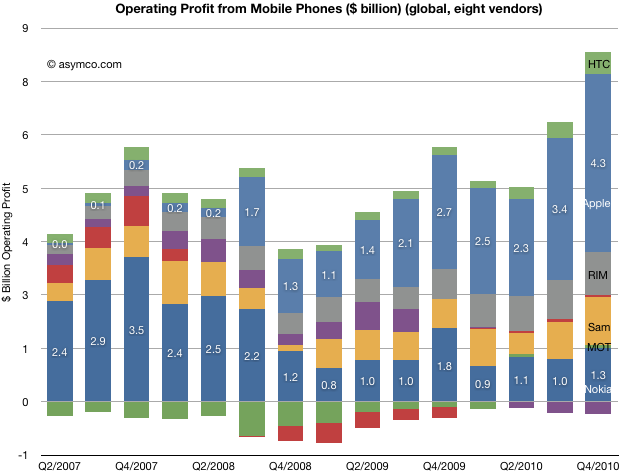
    Today's charts show the amount of profit captured by the top eight public mobile phone companies in two different ways.

    The first, as a bar chart:

    The second shows the way they captured it by taking into consideration the number of devices sold.

    Please click on the image for a full size view (1024 pixels wide).

    Generally speaking, vendors which are focused on smartphones have higher pricing and higher profitability (pricing discussion will follow at a later time). However, some, like Motorola and Sony Ericsson are still trying to recover from the collapse of their non-smartphone business and have higher prices but not very high margins overall. LG does not seem far behind.

    Samsung and Nokia profit per device is quite small but they "make it up in volume".

    The areas above represent operating profits and are comparable. One wonders how the ratios between horizontal and vertical dimensions for these boxes will change over time.

    Since the overall market will expand, the sum of all horizontal dimensions will increase. As the first chart shows, there is no law for the conservation of profits in the industry, so it's possible that the sum of all these areas will increase, but it's still hard to imagine it increasing by an order of magnitude.

    Will the industry remain clustered into a tall-and-narrow group and a short-but-wide group? That's a question with many strategic implications..

  3. The iPhone share: 17.25% of smartphones, 4.2% all phones

    Research · 13 comments

    The mobile phone market is growing rapidly. It grew 18% in the last quarter. The smartphone market grew even faster, about 75%.

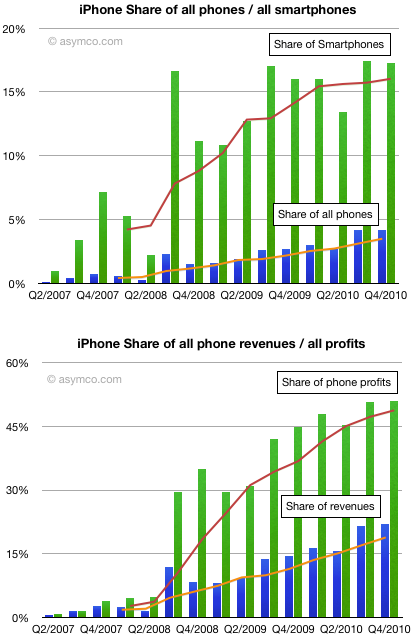
    To grow share in this market means growing even faster than the market. What we can see from the following charts is how the iPhone as a product grew in share since it was launched 3.5 years ago:

    Unit share growth slowed in the last quarter but the fourth quarter is not usually the most expansive for Apple. That is usually the third quarter which is the first full-availability launch quarter.

    The iPhone ended the quarter with 17.25% smartphone share and 4.2% phone share. Share of revenues was about 22% and share of earnings was about 51%.

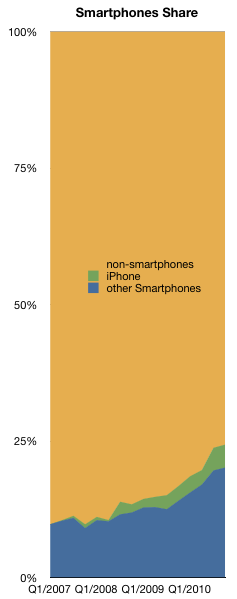
    I still hold that 20% smartphone share is possible for the iPhone. As the smartphone market slowly becomes the entire phone market (see chart to the left) that share will be worth something.

  4. Samsung was the fastest growing major smartphone vendor

    Research · 22 comments

    The smartphone market grew 73% in Q4. Here are the growth rates for vendors which regularly report smartphone sales:

    • HTC: 142%
    • Motorola: 96%
    • Apple: 86%
    • RIM: 40.5% (period ending November)
    • Nokia: 36%

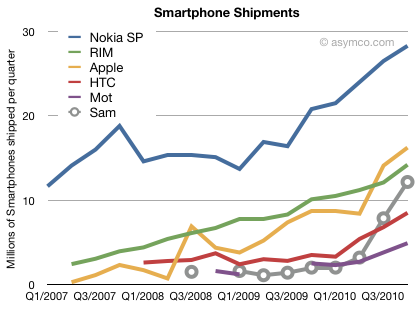
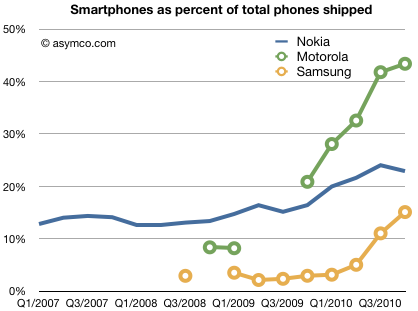
    Samsung is not consistent in reporting smartphones and we don't have year-ago data but the following chart can be used to get a hint.

    Samsung had a very good year with 25.2 million smartphones sold. This is compared to 2009 when they probably sold less than 5 million. Their growth has meant they overtook both Motorola and HTC and are likely to overtake RIM this year.

    Samsung owes its success mainly to adopting Android. As can be seen in the next chart, Samsung moved rapidly to shift its portfolio from non-smart to smart. This is quite a feat considering the starting point well below that of Nokia.

    From 2% of total phones to 15% smartphone volumes in 18 months is astonishing.

    Extrapolating for the missing data leads to an estimate of smartphone growth for Samsung of over 500%.

  5. Mobile phone vendor share update. Biggest winner: Other

    Research · 13 comments

    Biggest share winner: Other.

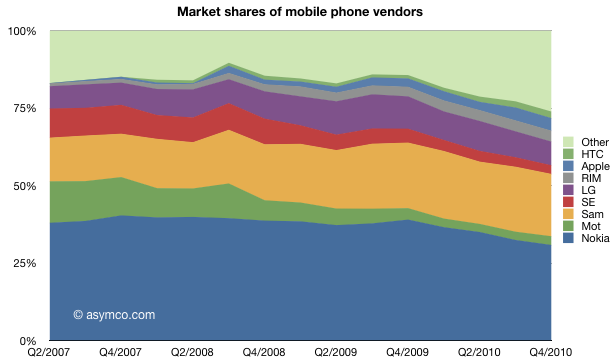
    The trend toward ZTE, Huawei and others taking volume share from the traditional incumbents continues. Smartphones continue to capture value share. Dedicated smartphone vendors HTC, RIM and Apple would make up the third biggest single vendor, starting from a very small base.

    Looking over this three and a half year period, the change in the market is quite dramatic.

  6. Canalys calls it on PCs

    Research · 47 comments

    ‘Any argument that a pad is not a PC is simply out of sync,’ said Chiam. ‘With screen sizes of seven inches or above, ample processing power, and a growing number of applications, pads offer a computing experience comparable to netbooks. They compete for the same customers and will happily coexist. As with smart phones, some users will require a physical keyboard, while others will do without.’

    ‘Each new product category typically causes a significant shift in market shares,’ said Chiam. ‘Apple is benefiting from pads, just as Acer, Samsung and Asus previously did with netbooks. The PC industry has always evolved this way, starting when Toshiba and Compaq rode high on the original notebook wave.’

    via Canalys reports global PC market growth of 19% in Q4 2010 (Canalys research release: r2011012).

    Five years ago, back when Gartner and IDC were confused about what a smartphone was Canalys was on top of the market and was the first to correctly describe the smartphone.

    Kudos for being first again to recognize a re-defined market.

  7. Big in Denmark: iPhone captures 36% of phone market value

    Research · 35 comments

    Thanks for Rob Marsh for forwarding the following snapshot of data from Denmark:

    Salget af smartphones eksploderer i Danmark.

    According to GfK data in Denmark, during the first quarter of 2010 29% of phones sold were smartphones. In the second quarter, the share grew to 37%. In the third quarter, 51% of units and 71% of sales value was captured by smartphones.

    Looking at September alone, Apple's share of the smartphone market was 34%. In terms of value share, 51% of all the dollars that consumers spent for smartphones, was spent on the iPhone.

    In other words, in September in Denmark, iPhone captured 34%*51% = 17% of all units and 51%*71% = 36% of all mobile phone sales.

    Rob adds:

    iPhone 4 is now available on all (4) major networks in Denmark. iPhone 4 has not been advertised very heavily, whilst Android has received a lot of advertising. My experience travelling on public transport in Greater Copenhagen is that iPhone is everywhere, whilst Android and Blackberry is less prevalent.

    To get a sense of how that compares with the global average, in the third quarter Apple's unit share was only 4.1% while sales share comes to about 17%. Seems like there is plenty of room for growth.

    While Denmark is a small country (population: about 5.5 million) and it's not likely to reflect global patterns, it has been rated the happiest place on Earth.

  8. Verizon back at bat: Revisiting the last inning

    Research · 69 comments

    A month ago I wrote an exposé on the problems I felt Verizon was facing with their smartphone strategy: Verizon Strikes Out in Smartphones [Updated]

    Given new information on subscriber growth and the relationship between Verizon and Apple, it's time to look back and assess how the conclusions are standing up.

    The conclusions I drew were that Verizon had three strikes against them:

    1. The iPhone has stolen their growth
    2. They are facing the prospect of a single OS platform supplier
    3. Android is not competitive vs. iOS

    Did iPhone really hurt Verizon?

    I pointed out that based on retail sampling data from ITG and what we know from AT&T own sales data, that iPhone at AT&T was outselling Android at Verizon by a ratio of 2.5 to 1.

    The latest comScore data closely matches the assumed units of Android shipped by Verizon. Here's why: The comScore data shows the number of active users of each platform. So, for example, as the number of Android users at Verizon grew, it follows that the new users had to buy new Android phones. However, you can also sell more phones than just those for new users. Some phones are going to go to replace those of existing users.

    When it comes to Android however, all the Verizon Android devices are pretty new, having been purchased less than a year ago. Replacements would only be sold for damaged or lost devices not covered by warranty.

    So from comScore the change in subs at Verizon comes out to about 2.2 million and my original estimate was about 2 million. That's pretty close.

    On the other hand, if you look at the chart, you'll notice that the number of iPhone users at AT&T grew by a similar amount (about 2 million). However, AT&T activated over 5 million. That means that about 3 million devices were upgrades. This makes a lot of sense since we know that iPhone is the bulk of AT&T smartphone users.

    This is highly supportive evidence that iPhone at AT&T did indeed outsell Verizon Android by at least a factor of 2. Each of those phones came with a 2 year lock-in so indeed AT&T did manage to "steal" growth from Verizon.

    Another data point in support of this conclusion was provided by Turley Muller in a comment.  AT&T smartphones make up a significantly higher proportion of contract subs at 44% vs Verizon at 23%. Effectively, as a result of their sweetheart deal with Apple, AT&T got double the penetration of smartphones than Verizon since these devices are targeted only to contract subscribers. Those are high ARPU customers that either moved from regular voice plans or switched from other carriers.

    So far, the first conclusion seems to be holding up pretty well.

    Was Android a strategic constraint to Verizon?

    Verizon revealed that they had been negotiating with Apple at least since 2008 and that they were testing the phone for a year. This is not as big a surprise as it may seem. Deals of this kind easily gestate for years. The commitment may not be made until the last minute.

    Nevertheless, my point was about the fact that Android was making up to 75% of Verizon's smartphone volume in Q3. This might be a strategic constraint. But "so what?" you may say: AT&T's dependance on iPhone was even greater.

    That's precisely my point though. As we've seen with the shift by Apple to multi-carrier distribution, AT&T is now facing serious constraints on growth and the share price is suffering. Although Verizon did not deal with Google as a direct supplier, they were at risk of having much of the IP on their network at least orchestrated by a company that was not always aligned with their strategic goals. Much the same predicament AT&T is facing now.

    The tale of AT&T and iPhone does lend support to the premise that Verizon felt a bit too constrained by Android hegemony on its network.

    Is Android Competitive with iOS?

    This last point was supported by the data showing a widening higher sell-through rate for iOS vs. Android on comparable addressable markets. Although the data has been confirmed with survey data, there are issues with this interpretation. First, because the addressable base for iPhone is higher at AT&T with the post-paid contracts being more popular there, iPhone had an easier time getting sold. Second, because 3/5 of the phones were upgrades.

    The jury is still out but the apparent pent-up demand (admittedly anecdotal) for iPhone on Verizon does seem to show that given similar pricing, and a similar demographic/geographic addressable market, people do prefer the iPhone.

  9. For every AT&T Android user there are 15 iPhone users: What will be the ratio at Verizon?

    Research · 103 comments

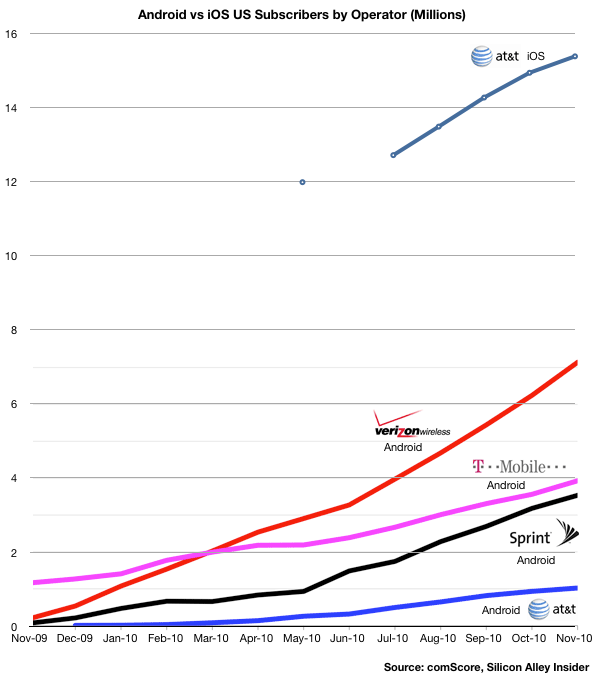
    The following chart uses comScore data to show the relative consumption of Android vs. iOS by the subscribers of the four major US operators. I modified an original chart published by Silicon Alley Insider.

    A few observations:

    • As of November, the ratio of iOS to Android users was more than 15 to 1 at AT&T.
    • iOS at AT&T has twice the users as Android at Verizon
    • Although T-Mobile had the Android franchise to itself for all of 2009, it was overtaken by Verizon within four months
    • T-Mobile Android consumption has also been nearly matched by Sprint within a year

    The rapid eclipse of T-Mobile smartphone penetration makes one wonder how effective Android is as a differentiator for carrier and device vendor alike. It also explains their new pricing model.

    The data also gives clues to how iOS at Verizon will grow.

    Since Verizon and AT&T have nearly the same number of subscribers, excluding RIM ,which is common to both, AT&T has a far larger penetration of smartphones (16.5 million vs. 7 million.) Is the cause iOS itself or the delay with the timing of Android launch at Verizon?

    Other data from comScore shows that much of the gains for Android at Verizon have been at the cost of RIM, so Android has not been entirely additive. Will there be a similar platform switching going on or will iOS be additive to the Android base?

    On one hand, the potential exists for a similar number of touch smartphone users at Verizon as at AT&T (15 million as of November). On the other, Verizon is "half-penetrated" with Android. How many will switch (as they did with RIM) and how many will be new users?

    I'm not going to make any predictions yet but I would not be surprised if Android at Verizon will flatline if not drop while iOS at Verizon will jump quickly to make the sum of both equal to AT&T iOS in about twelve months. That would imply about 10 million new Verizon iOS users by 2012.

    If Verizon users start to switch from Android to iOS, iOS could add as much as 15 million users. It seems that 10 to 13 is a reasonable estimate.

  10. Will T-Mobile's hundred dollar smartphone with ten dollar data plan win subs?

    Research · 21 comments

    Chief Executive Philipp Humm said in an interview that many of his smartphones will eventually be made up of Google-powered phones costing less than $100, half as much as the smartphones typically available at U.S. carriers. In October, to lower the cost of monthly bills, Mr. Humm introduced a limited data plan that costs $10.

    via T-Mobile Smartphones to Head Down Market - WSJ.com.

    T-Mobile seems to be attempting to differentiate on price. In a regular market reaching saturation that might be a viable strategy. However the market is neither regular not saturated. T-Mobile's chances of gaining large share are limited.

    Churn, or the chance that a user will switch networks is still very low. If anything, AT&T and Verizon are more sticky and lose fewer customers than T-Mobile and Sprint.

    Mobile computing saturation (25% to 30% penetration) is also not nearly at a point where competition on price leads adoption.

    Lastly, the $100 price point is being put against the standard $200 price point which itself is an illusion for the user. The drop in smartphone entry price is not as powerful going from $200 to $100 as it is from $300 to $200. Psychologically, $200 is an inflection point. Apple's $100 3GS pricing (now $49) is defensive and probably effective.

    In short, the market for telecom services is not very "liquid" and users are quite trapped in their carrier contracts, pricing is not yet a basis for competition and pricing illusions persist.

    In conclusion:

    Mr. Humm, in an interview at the Consumer Electronics Show in Las Vegas, acknowledged that the likelihood Verizon Wireless getting the iPhone as well could affect his subscriber numbers.

  11. Half of US population to use smartphones by end of 2011: Update

    Research · 10 comments

    Half of US population to use smartphones by end of 2011 | asymco.

    A month ago ComScore reported that in October 2010 25% of Americans above the age of 13 used smartphones. The latest report shows that share to have risen to 26.3%.

    That means there are 24 percentage points of penetration to go until the majority of Americans are smartphone users. In absolute numbers this implies about 56 million additional users (and hence units sold).

    The rate of penetration growth was 1.3 percentage points per month. Assuming no acceleration in this figure and assuming we rely on ComScore (vs. Nielsen which reports higher figures) then majority share is 18 months away, or mid-2012.

    However, assuming some acceleration and a different sampling method, I still believe that we could see this figure by end of this year.

    In either case the tipping point is near.