China smartphone shipments fell 16% in Jan as Android inventory swells; iPhone stays healthier.
China's shipments of smartphones fell 16% in January, due in part to escalating inventory, which was in sharp contrast to Apple iPhones demonstrating a slight month-over-month decline in rolling six-month inventory days, according to data by Jefferies.
"Since our checks indicate smartphone sell-through in Jan. fell 22% (partly due to Chinese New Year timing), we estimate Android's rolling 6-month inventory days have risen by 26 (down by 3 days in Dec.), while iPhone is down by 2," said Jefferies analysts, led by Edison Lee, in a Thursday investor report.
The iPhone's healthier inventory reflects strong demand along with several months of shipment declines.
Jefferies also noted an increase in promotional discounts for Android phones in China as opposed to iPhones.
"Our tracking shows consistently limited promotional discounts on iPhones," Lee said. "PDD (PDD), being the most aggressive platform according to our tracking, has been offering only mid-single-digit discounts on the iPhone 17 series, while there has been no discount on Tmall. However, we saw double-digit % discounts across key eCommerce platforms on Android flagship models, including Huawei Mate 80, vivo X300, OPPO Find X9, and Xiaomi 17."
The average discount on PDD for Android flagship models has increased to an average of 24%.
"That shows the pressure for key brands to reduce inventories," Lee added. "However, as memory costs are skyrocketing, it would create more pressure for Chinese OEMs to cut shipments in order to rely on selling inventories and thus protect margin."
Asymco Bulletin is a digest of all the work we have published for the week ending March 1, 2026.
Office Hours
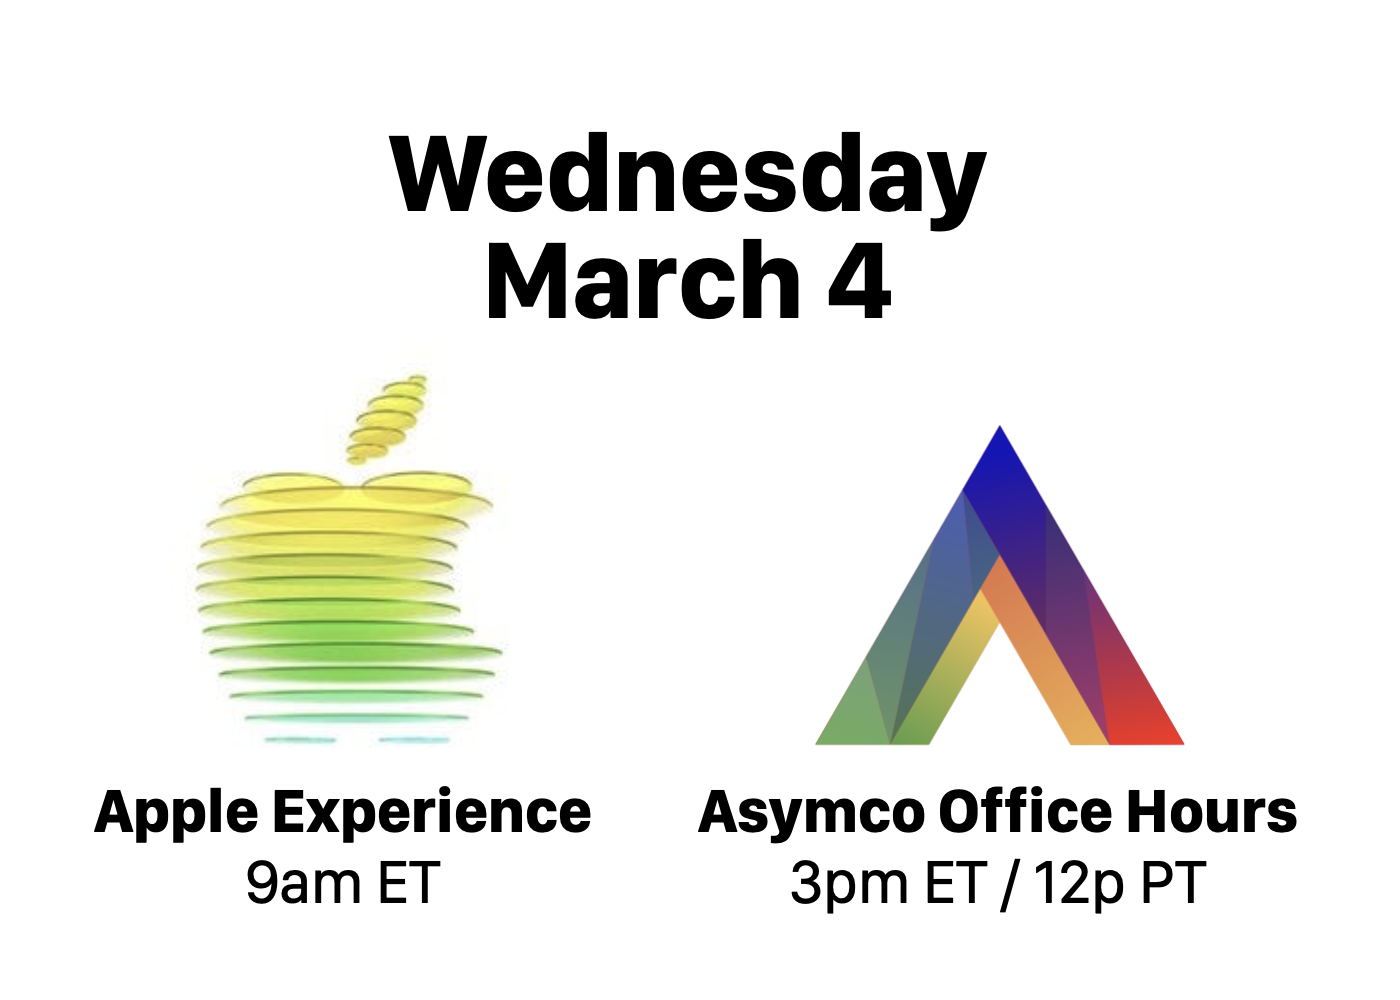
Our firstOffice Hours interactive seminar and Ask Me Anything questions/answer session will be on March 4th, after, presumably all the new announcements Apple will be making during the week. I will be broadcasting to you en vivo y en directo from Paris.
Apple March 4 Special Event – Q&A → Join us for an exclusive Asymco One live Q&A on March 4 at 3pm ET to dissect Apple's latest business moves. →
Greater China (GC) is a specific reporting segment for Apple, encompassing Mainland China, Taiwan, Hong Kong, and Macao, with a combined population nearing 1.5 billion. This region is not just a significant contributor to Apple's revenue—accounting for 18% of net sales in Q4 2025—but also a dynamic landscape of technological adoption and consumer behavior. The smartphone user base in GC has surged from 690 million in 2016 to nearly a billion in 2025, with projections reaching 1.08 billion by 2029.
The iOS ecosystem within GC exhibits varied dynamics across its constituent regions. While Macao maintains a steady iOS share of around 60%, Mainland China and Taiwan show different trajectories. Analyzing these trends through mobile OS share data reveals iOS's ascent, suggesting robust potential for further penetration and user engagement. As Apple navigates this complex market, understanding GC's historical growth patterns and future prospects is crucial for capitalizing on emerging opportunities and sustaining its competitive edge. →
Nota Bene
Apple #1 phone vendor in Europe → Apple leads Q4 2025 with a 7% YoY shipment rise driven by iPhone 17, while Samsung follows with 4% growth; Xiaomi faces a 6% decline amid shifting regional dynamics. →
iPhone becomes India’s top single export item → In 2025, Apple's iPhone exports from India, driven by Tata and Foxconn plants and a robust supply chain, reached $23 billion, making smartphones the top export category. →
Apple’s App Store growth is reaccelerating → Apple's Services, beyond just the App Store, are poised for robust growth, driven by global market expansion and strong hardware demand. →
Here’s why demand for Macs has spiked → Mac lead times have surged to multi-year highs due to increased demand, notably impacting models like Mac Studio, MacBook Pro M4, and Mac Mini. →
A resource for AVP news → "AVP VIP offers a weekly, ad-free digest of tech news and insights, accessible to Asymco One members." →
Eddy Cue says Brazil is Apple TV’s second-largest market, talks Netflix-Warner merger → In an interview, Apple's Eddy Cue highlighted Brazil as the second-largest and fastest-growing market for Apple TV subscribers, while noting potential impacts from proposed streaming regulations and a possible Netflix-Warner deal. Specific user and device numbers were not disclosed. →
Global memory scarcity will cause a 13 percent drop in smartphone sales in 2026, according to IDC. DRAM is in short supply because AI companies are buying huge quantities of high-bandwidth memory (HBM) for servers in data centers, and manufacturers are prioritizing HBM instead of the memory used in consumer devices.
IDC says that the global memory supply has been drained into next year, putting smartphone makers in a tough spot. Prices have spiked because there's not enough memory to meet production needs, which will cause a smartphone market "crisis like no other."
Smartphone makers are expected to ship 1.1 billion devices in 2026, down from 1.26 billion in 2025.
"The tariffs and pandemic crisis seem a joke compared to this," said IDC Senior Research Director Nabila Popal. "The smartphone market will witness a seismic shift by the time this crisis is over -- in size, average selling prices and competitive landscape. We don't expect the situation to ease up until mid-2027, at least."
Cheap Android smartphones will be impacted most heavily by increasing DRAM costs, but Apple is well-positioned to avoid major impact because it focuses on more expensive, premium devices. Apple has more profit margin to work with and is better able to secure available DRAM supply.
IDC says that even when the DRAM shortage is resolved, memory prices are not expected to return to 2025 levels, so there could be a permanent shift toward higher-priced smartphones.
As previously reported, China represented 18% of net sales for Apple in the fourth quarter of 2025. This was up from 15% the year before and the third largest reporting segment. The segment grew by 37.9% year-on-year.
It's time to understand precisely how big this market is in terms of users, iPhone install base and device install base, with an eye toward understanding the history and potential for growth.
First, it's important to note that Apple refers to "Greater China" (GC) not just China. That means within this reporting segment are Mainland China, Taiwan, Hong Kong and Macao. The populations are approximately, 1.4 billion, 23.2 million, 7.5 million and 700k respectively.
Second, the population of smartphone users has been growing dramatically. In 2016 there were about 690 million (GC) and in 2025 the number is about 997 million. The forecast for 2029 is 1.08 billion.
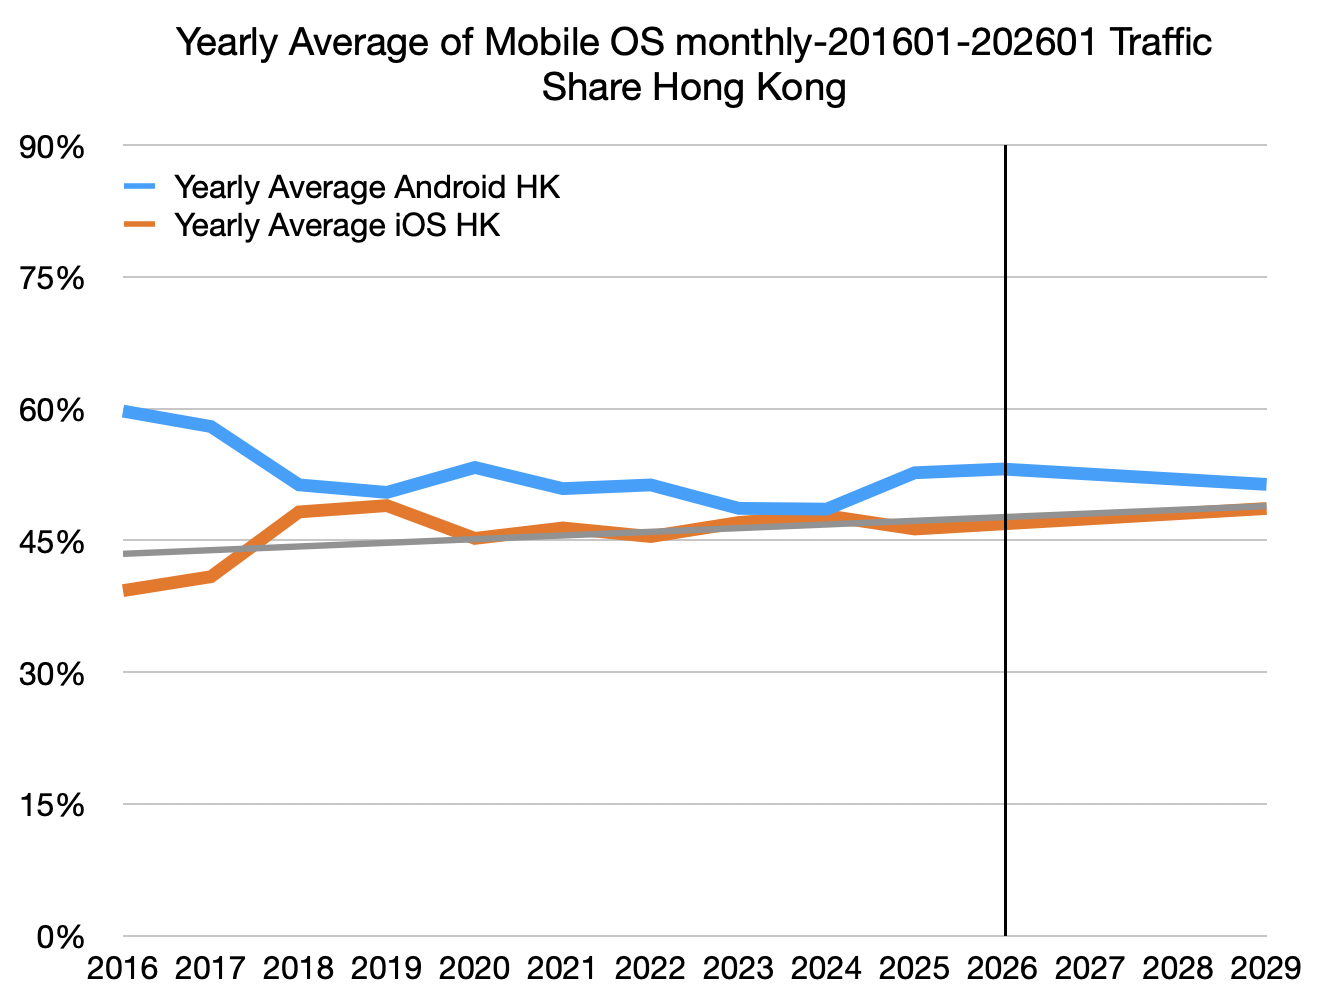
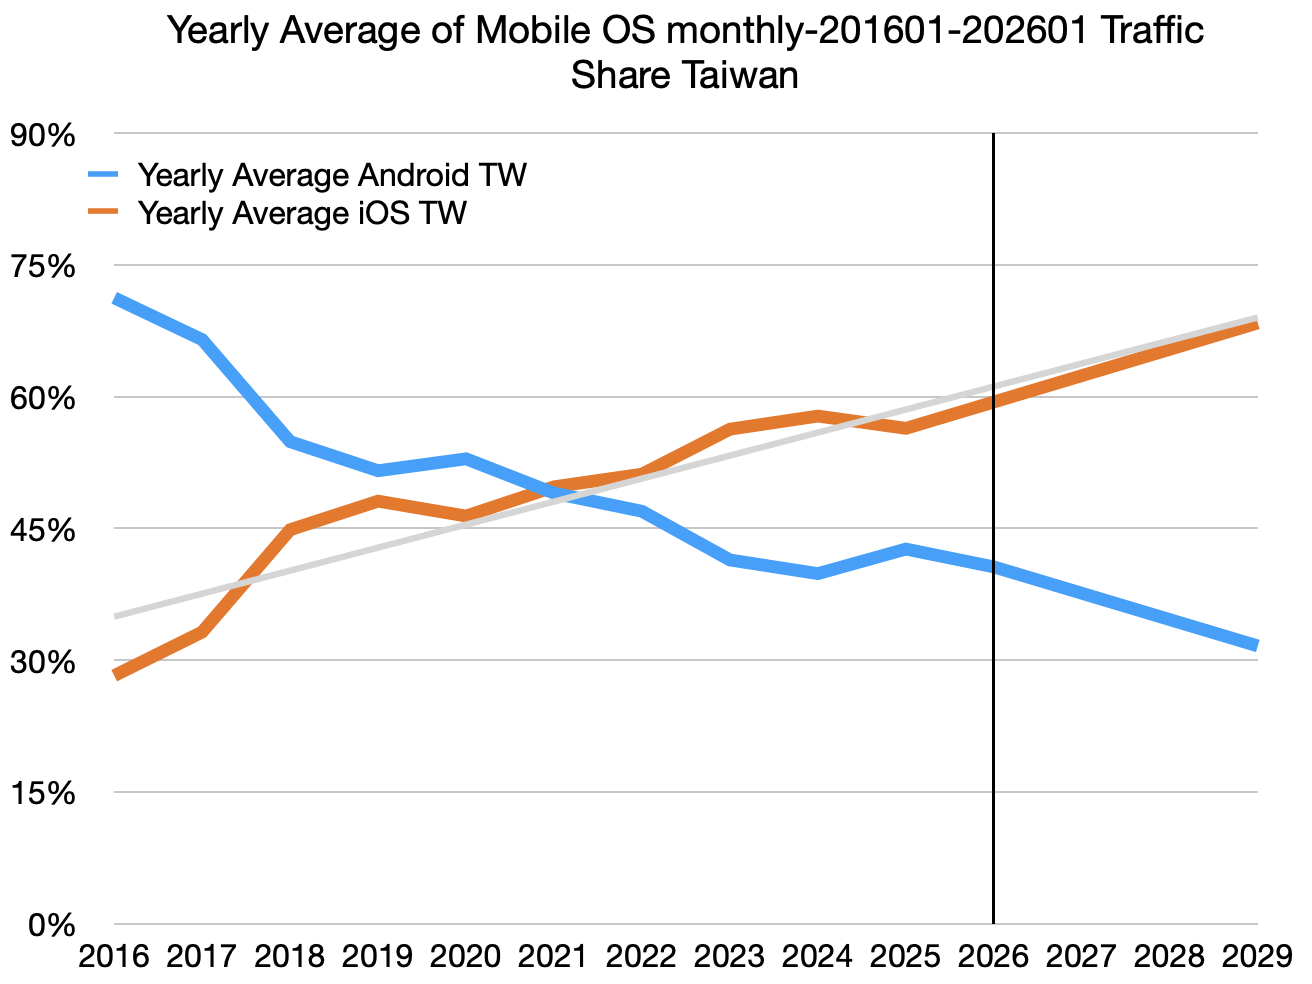
Third, the share of iOS has been rising but at different rates in the three regions (Macao is excluded because of small relative size, but Apple is holding iOS share steady at about 60%.)
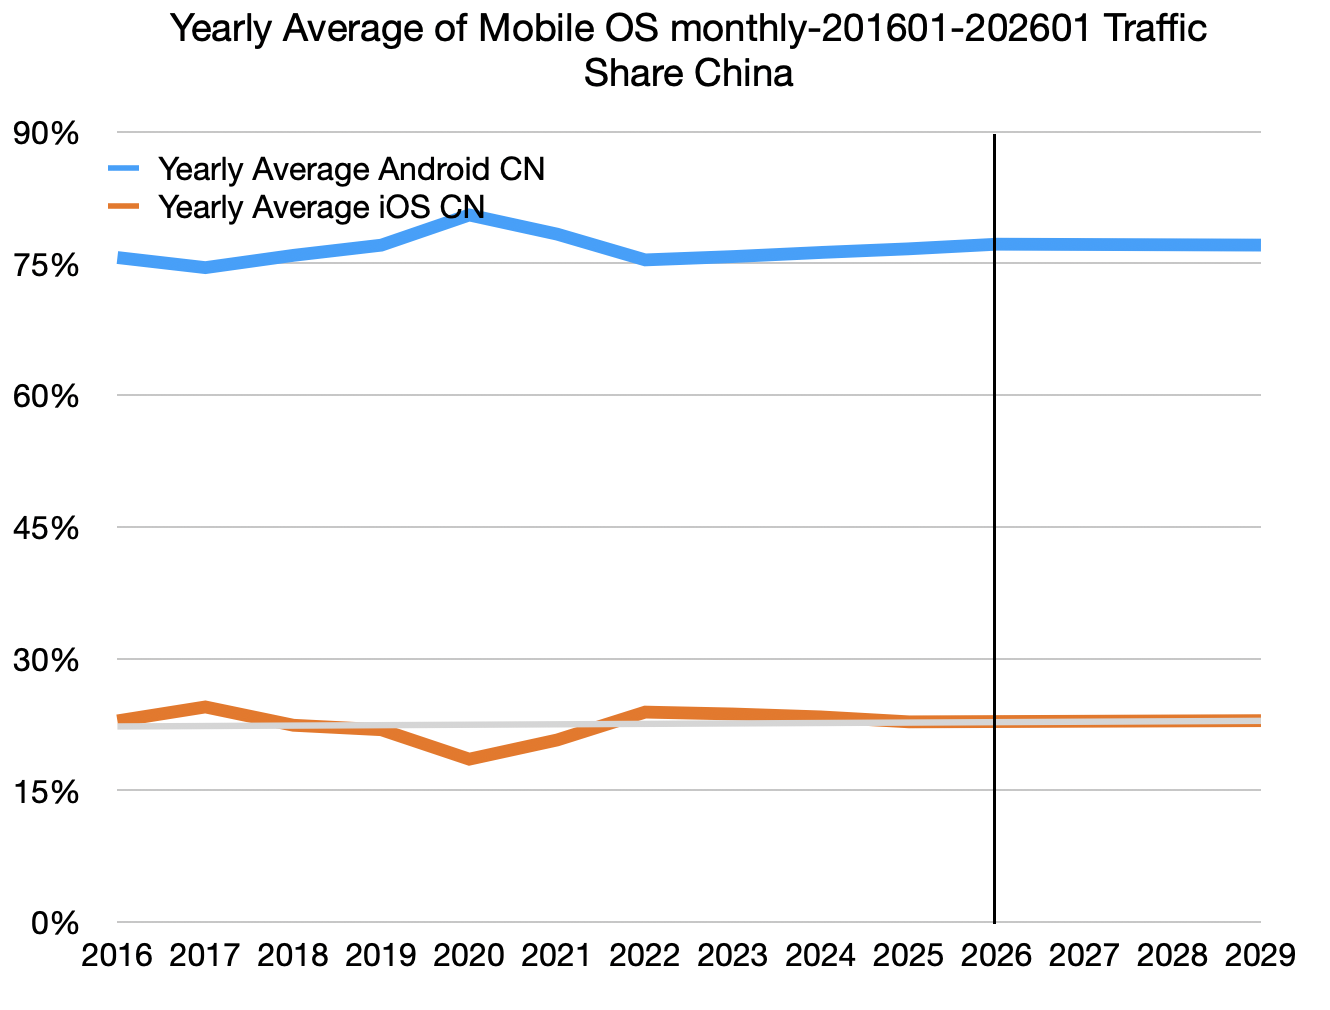
These graphs represent the trends in Mobile OS share as collected by Statcounter and trendlines for iOS are shown with projections to 2029.
Multiplying the share numbers by the user numbers, including projections gives the following iOS users summary.
Apple Pay is set to go live in the Indian market by the end of 2026, according to a report by Business Standard. The service still requires regulatory approvals before it can go live in the country, but Apple is reportedly working with banks, regulators, and card networks to bring the payment service to India within the year, claims the publication's sources.
Once launched, Apple Pay is also expected to offer its Tap to Pay on iPhone feature, allowing users in India to make contactless payments at point-of-sale terminals via NFC. But before that can happen, Apple will have to negotiate fees with major card issuers for use of the payment gateway.
Apple’s App Store revenue growth is strengthening in February, with Morgan Stanley saying the latest data points to a faster pace of expansion heading into the March quarter.
The firm’s analyst, Erik Woodring, said in a note Monday that App Store net revenue is growing 9 percent year-over-year month-to-date, which represents “a 230bps acceleration from January off a 700bps easier Y/Y compare.”
Woodring added that quarter-to-date revenue is now rising 7.5 percent, putting it “50bps behind our +8.0% Y/Y March quarter App Store forecast.”
The bank kept its March-quarter App Store growth and Services growth forecasts unchanged at 8 percent and 13.5 percent, respectively.
Morgan Stanley said the acceleration is broad-based across major markets. China’s App Store is growing 4 percent year-over-year after a decline in January, while the U.S. is rising 3 percent, a 40-basis-point improvement. Japan is down 1 percent, while the rest of the world is seeing 22 percent growth.
The analysts also cited rising Mac lead times, noting they have “quickly inflected to multi-year highs” due to demand for the on-device AI tool OpenClaw.
They said stronger Taiwan component supplier revenue in January is another positive indicator, pointing to “very robust strength in server demand coming from the largest global cloud service providers.”
Five iPhone assembly plants — three operated by Tata Group entities and two by Foxconn — supported by a supply chain of around 45 companies
Apple Inc.'s iPhone became India's top single export item in 2025, with shipments worth $23 billion, largely to the US, driven by the government's PLI scheme and supply chain diversification from China. Smartphones emerged as India's leading export category with Apple contributing 76 per cent.
Smartphones were India's top export category for the first time, surpassing automotive diesel fuel, with a total $30.13 billion worth of exports in the January-December period. Apple accounted for 76 per cent of total smartphone exports. Apple's five‑year PLI window is scheduled to end in March 2026.
Latest data indicates 88% of teens own and intend to purchase iPhones, marking a decade-long trend of increasing adoption. This phenomenon transcends mere functionality; the iPhone has become a cultural icon, symbolizing status and identity.
Unlike other Apple products, such as Apple TV+ or Apple Music, which struggle for traction among teens, the iPhone's appeal is deeply woven into the social fabric, partly due to generational continuity—the children of early iPhone adopters are now loyal users themselves.
In contrast, social media platforms illustrate the fickle nature of tech usage among younger demographics. While Facebook remains prevalent among older millennials, Gen Z gravitates towards Instagram and TikTok, reflecting shifts in cultural preferences and digital behaviors.
For Apple, success in services like Music and TV+ hinges on leveraging existing family dynamics through bundling.
On the Q4 call, Tim Cook highlighted Greater China’s 38% year-over-year revenue growth, fueled by record iPhone sales, strong upgrade activity, and double-digit retail traffic gains.
Europe, however, drew little attention—despite generating more revenue for Apple than China. This is peculiar.
Europe’s smartphone market shows steady structural gains for iOS. Since 2018, share has risen from 24% to 39%, while Android has fallen from 74% to 60%—a 15-point swing equal to roughly 70 million additional users. With an installed base near 459 million users versus about 300 million in the U.S., Europe combines scale with affluence.
In sum, the pattern for Apple in Europe is not saturation but share transfer, signaling durable competitive strength in a mature market and an inkling of how all markets will eventually behave in maturity.
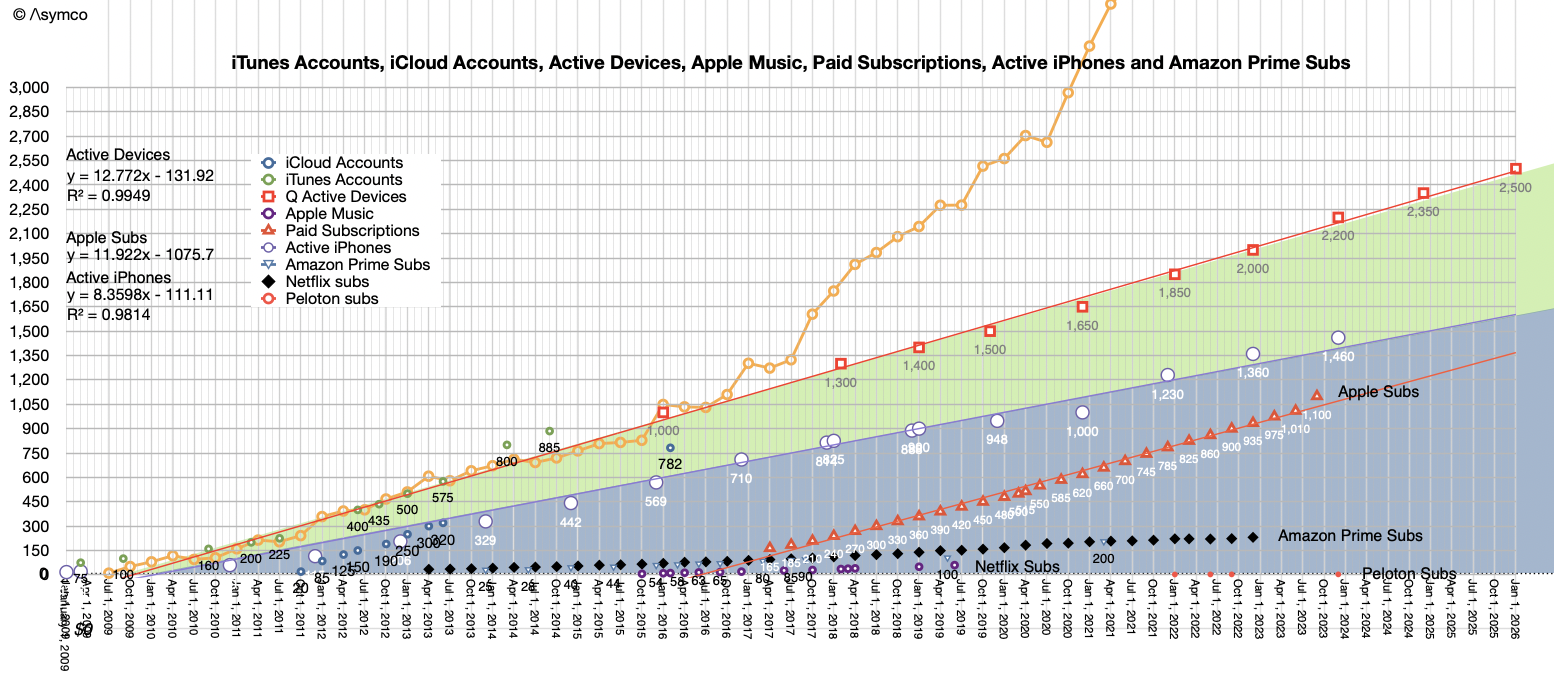
In the last quarter Apple reported 2.5 billion active devices. Of those, I estimate 1.6 billion are iPhones.
Using this as a base, I've created an iPhone installed base estimate looking forward to 2030, integrating Statcounter’s market share data, Ericsson’s global smartphone user forecasts, and BankMyCell’s smartphone install base.
The sources broadly align through 2025, though Statcounter’s historical iOS share (2017–2023) diverges somewhat, possibly reflecting Android’s heavier web traffic footprint due to usage patterns and bot activity rather.
Taken together, the data points to iPhone nearing 2 billion active devices by 2030, consistent with overall smartphone adoption. Android’s projected rise toward 4.5 billion users signals continuing headroom.
If switching dynamics and monetization trends persist, Apple’s ecosystem could expand to 2.5–3 billion users by 2035, with growth thereafter driven by switching and increased engagement depth and value extraction per user.
Apple Announces Special Event in New York, London, and Shanghai on March 4 → Apple is hosting intimate, global "Special Apple Experience" events on March 4, 2026, likely unveiling new products like the iPhone 17e and M5-powered MacBooks, marking a fresh twist on traditional live-streamed launches.
Apple adds video experience to Apple Podcasts → The "pod" in podcasts originated from Apple's iPod, with the company popularizing the medium by integrating podcasting into iTunes in 2005, and continuing to innovate with features like video podcast support and dynamic ad insertion.
Dan Ives Says Apple’s AI Alone Could Be Worth $1.5 Trillion → Apple's unparalleled distribution through its vast user base offers a significant competitive edge for rapidly monetizing AI innovations, potentially adding $1.5 trillion in value.
While big tech burns cash on AI, Apple waits → As foundation models commoditize, Apple strategically curates top AI tech into its ecosystem, prioritizing user experience over engine development.
Secure the chips, absorb the costs, and grab more market share → Apple faces memory cost inflation potentially raising iPhone prices, yet its strong ecosystem and execution provide resilience, whereas competitors like Samsung may struggle more due to lesser volume leverage.
iPhone Emergency SOS via Satellite Helped Six Skiers Survive Tahoe Avalanche → Six skiers survived a deadly Lake Tahoe avalanche by using iPhone's Emergency SOS via satellite, highlighting its transition from luxury to essential. This feature enabled crucial communication with rescuers in remote areas lacking cellular service. The evolution mirrors mobile phones but faces slower adoption due to satellite bandwidth constraints.
Bankers complain that Apple has a tight grip on mobile payments → Canadian banks struggled to compete in the mobile wallet market, dominated by tech giants like Apple and Google, due to their risk-averse nature clashing with tech's innovation-driven approach.
The all new Asymco One
Introducing Asymco One Early Bird Pricing. → Asymco celebrates 17 years of insightful Apple analysis, launching Asymco One to guide stakeholders through Apple's evolving era with comprehensive content and community engagement. →
Introducing: Asymco One Office Hours → Join Asymco One's monthly Office Hours with Horace to get live insights on Apple's business and financials, with special editions during key events.
We have a firm hold on the number of active devices as well as the number of iPhones in use. This is due to Apple reporting the data. The latest active device count was 2.5 billion and the estimate for active iPhones is 1.6 billion.
This patters also allows us to forecast the active base pretty accurately as the growth is predicted by the tight fitting linear approximation.
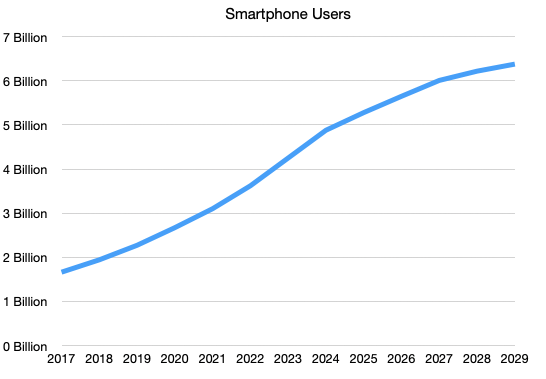
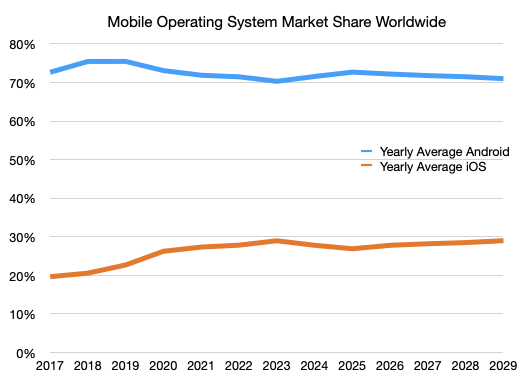
For more confidence it would be useful to confirm these predictions with different estimates. For this I turned to two additional sources: the Statcounter GlobalStats measure of Mobile Operating System Market Shares Worldwide coupled with Number of Smartphone Users Worldwide (forecast by Ericsson) and the Number of of iPhone Users from Bankmycell.
The total Smartphone Users history and forecast is shown below:
The Mobile Operating System Market Share Worldwide is shown below:
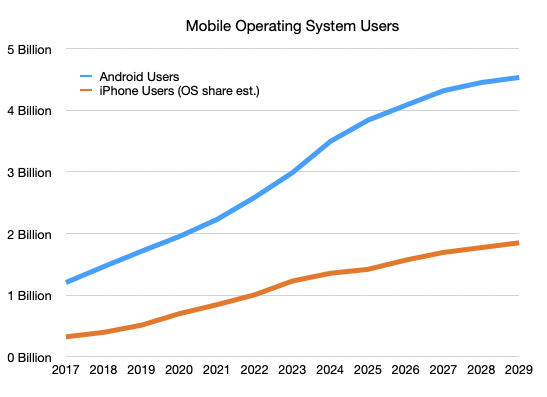
Multiplying these two yields the Mobile Operating System Users
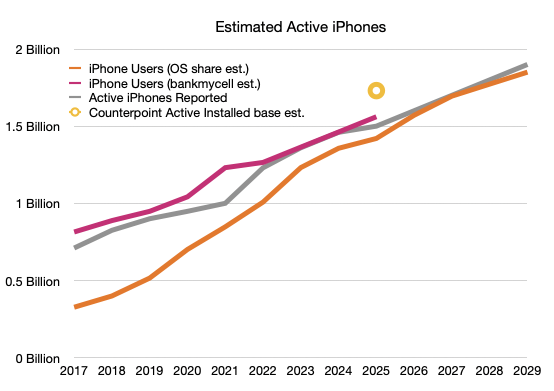
The iOS users (orange line) can now be compared to Apple's own reported active device total (grey line) and the Bankmycell estimate as well as a derived estimate from Counterpoint (24% share of install base)
The graph includes forecasts from 2025 to 2029.
Discussion:
That, coupled with value captured per customer will determine the value of the firm.
Are Apple and Google competitors or are they partners?
Prior to the launch of the Android operating system, Apple and Google collaborated on many projects. Google Search was predominant on Apple products including the (at the time) new iPhone. The iPhone also launched with support for Gmail and had native Google Maps and even YouTube. Google was a cornerstone supplier for the new smartphone.
After the launch of Android only a year later, the relationship changed. The two companies came to be viewed as mortal enemies. The perception that Android was disruptive to Apple—insofar as it undercut the pricing power of the new touch-based user experience—was universal. The "zero price" of Android and its licensing by all other phone makers suggested a competitive collapse was imminent for the fledgling iPhone. Android phones were far cheaper and "good enough." If not immediately, then with the resources of all phone makers and Google itself, Android would surely soon overtake the iPhone in performance along all dimensions. It took a great deal of courage to argue otherwise.
But, over time, the notion that the iPhone would continue to exist became more widely held. Holding on to a "premium" positioning, iPhone seemed to be have pulled a rabbit out of a hat, perhaps because of Steve Jobs' reality distortion field or because of magical marketing. Nonetheless, doubts over long-term growth persisted.
Having survived Android, Apple was still seen as vulnerable to a multitude of Google initiatives including Chrome and Chromebooks, a range of Google Pixel phones (enabled by the acquisition of Motorola and HTC.) The entry of Google wearables (enabled by the acquisition of Fitbit), Glasses, the Play Store, YouTube content, Google productivity apps, Google cloud, Google TV, Nest, Google Assistant and numerous other services were all cited as nails in the iPhone coffin. This is all before the age of Crypto a new generation of AIs came into fashion.
Throughout this period the iPhone continued to increase its audience, growing its base of users not only from smartphone non-users but also from so-called "switchers", that is, those who moved from Android to iOS. Apple has benefitted from this net positive switching for at least five years now as most of its addressable market has already adopted the smartphone. There are about 1.2 billion iPhone users and it's far more likely that a new iPhone user today arrives from the 3.5 billion Android users than from the 3.2 billion people who don't yet have any smartphone. That is because those who don't yet have a smartphone today are also likely to not yet have access to electricity, cellular networks or money.
Indeed, it is Android that seems to be in a precarious position. The ecosystem is bleeding not just high-end users but also from fragmentation. Chinese OEMs in particular deliver their own experiences and code bases, eschewing Google services altogether. Large OEMs such as Samsung are seeking to differentiate with their own experiences and ecosystems and accessories and chafe against Google's hardware offerings. Upgrade rates to new Android versions are poor. Support of hardware beyond a few years is lacking. But, most fundamentally, Google has not developed a business model that directly fuels development of Android.
Put simply, Android is not a profitable product. It's not designed to create revenues. It's designed to reduce costs.
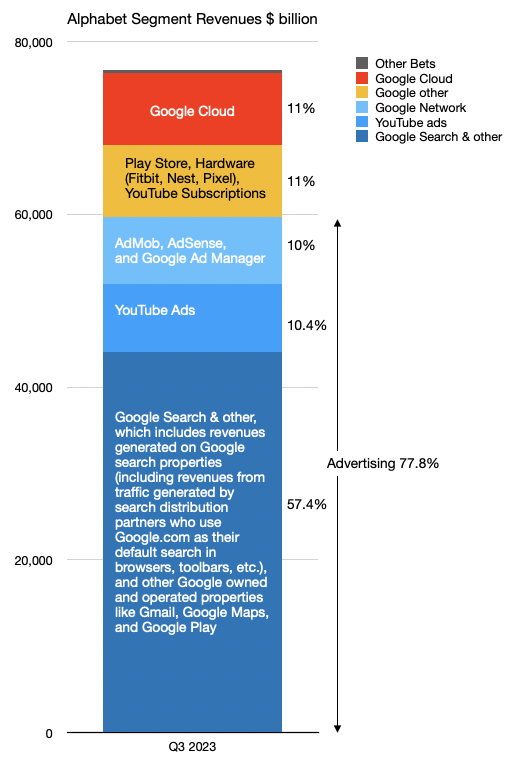
To understand this, we have to understand Google's business. It's not very complicated. Google's revenues in the last quarter are segmented as follows:
The colors above indicate the major categories. Blues are Advertising, yellow is "Other" and red is Google Cloud. Other Bets, consisting of research projects, is a 0.4% rounding error. Apart from Search which is about 60%, each major category is about 10%. Advertising as a business model is about 78%.
To Alphabet's credit, Advertising as a business model has been reduced from 94% a few years ago. Much of that credit goes to Cloud which is a B2B business and has completely different resources, processes and priorities than Search. The "one trick pony" label is less applicable to Google today.
Search however, and the ancillary properties, are still, by far, the largest sources of revenues and profit. Note that Android itself is missing from this mix apart from Play Store which is a direct Android extension. Play does contribute somewhat as part of "Other" but the OS itself is an enabler across all these categories.
While not directly producing revenues, what Android does is perhaps even more important. It helps reduce the amount Google has to pay to access its customers. Think of Search as a system which takes queries in and puts results out. These results are what advertisers pay for and the queries are what Google pays for. The output depends on the input. That input is harvested from many users. Access to those users is not free. The cost can be paid by building access directly (Android) or by paying for access to someone else's property (Apple, Windows, or Firefox). In old-school business terminology this is called distribution.
Distribution is often ignored or considered a superfluous "middleman" to be bypassed. But distribution is foundational to any business. It is, effectively, other people, outside your company, helping you sell your product because they have access to the customers. They get paid for that access, often with a percent of sales. Stores are distribution. Wholesalers are distribution. Resellers are distribution. Without distribution scale cannot happen. Distributors help both producers and consumers by creating access.
Access is also provided by what we call infrastructure. Just like you can't travel by car from your house to your destination without roads, all access to products and services is effectively infrastructure. If you own the infrastructure then you have to pay to build it and maintain it. If you don't own it you have to pay to use it. All infrastructure has value and all infrastructure has costs.
This all makes more sense when recalling the historic birth of Android. At the time (2006 to 2008) the worry for Google was that Microsoft's mobile operating system (Windows Mobile née Windows CE) would be licensed as was Windows. That is to say that all phone OEMs would take a license for a nominal fee and build Windows Mobile phones. Microsoft would thus dominate the mobile computing market the way it dominated the PC market (with market share above 95%). Microsoft would then ensure that Bing search was the default on all devices running Windows and Windows Mobile, thus blocking access to what was expected to be the next 3 billion users while capturing all search ad dollars ad infinitum.
If Windows Mobile were to dominate, Google would be denied distribution, at any price. It would thus be relegated to, at best, 10% market share of mobile search. This would be an existential crisis.
In this setting, Apple was an ally for Google. Apple was not a search engine provider and was very welcoming of Google search on a nascent Safari browser. Whereas Explorer would block Google search, Safari would offer default placement. Not for free, but for a reasonable cost. Google was a "go-to-market" partner for Apple and it was a symbiotic relationship.
However, the expectation of Google at the time was that Apple would be no more successful with iPhone than it was with the Mac: A fringe of "creative" or "fanboy" quirky oddballs. This was not just Google's expectation. It was everyone's expectation.
Android was built to counter a Microsoft mobile OS monopoly with a "zero cost" option vs. Microsoft's end-user-license model. Microsoft made money selling software. Both system software (Windows) and application software (Office.) Google would give away system software (Android) and services (Gmail and Docs) but make money on advertising.
A genius move. Phone OEMs would much rather pay zero of the OS on their phones than for the non-zero Windows Mobile license. [On a $200 retail cost phone (and thus $90 bill of materials) a $8 OS license is a huge cost.] Google's Android did indeed block Windows Mobile from getting a foothold in the post-PC era.
But it did so by taking some short cuts. Android itself was an acquisition in 2005 (for $50 million, with a keyboard interface) and, in response to the iPhone, a new touch user interface was developed. It so happened that this interface copied as closely iOS as Windows had copied the original Mac. This perceived theft was such an affront to Steve Jobs that he declared war on Google.
It was important to ask (as few did) why did Google need to develop an OS, only to give it away. Was its business that robust if it needed to expend enormous energy and capital to build an enabler? The answer is, of course, distribution.
Google was initially not paying for distribution as most people just typed "google.com" into their browsers. As the URL field became a search field, Google could still expect PC users to make Google.com their search bookmark, one click away.
But on mobile devices, the friction of the constrained interface meant that defaults mattered. Mobile was going to require new distribution economics. Devices were going to be in the hands of many more people, who, since they did not have full-size keyboards, would type less and who would interact in new (and very succinct) ways. One click away was one click too far.
With Android (and Chrome) Google set defaults for its services across the platform. If Android was the OS then Chrome would be the default. If Chrome was the default, then Google Search would be the default. For these Android-sourced queries, Google would not pay for distribution. Or, more precisely, would only pay to build and keep Android. Thus the more Android there was, the cheaper it was to obtain search queries for Google. Google had built its own highways: it owned the infrastructure that connected users to its services. These roads were for Android users. And what about iOS users?
Over a 15 year period the smartphone went from essentially zero to 5 billion users. It became so important to those 5 billion people that they keep it with them every waking moment, use it 100 times for a total of 5 hours each day. That adds up to 182,500,000,000,000 interactions a year and, as a result, it has changed behavior, politics and humanity itself.
Throughout this period, the relationship between Google and Apple changed. From being allies, to mortal enemies to, as we shall see, partners. We have to understand this new relationship that has emerged and its consequences.
The next post will explore the relationship in detail using the lens of the deal structure that exists. A deal which is not public and largely unexamined.
As I remember it, at least 10 years ago, I began to hear anecdotes from developers who built apps for both iOS and Android about their economics. The story is that they tended to have twice as many users using Android but that iPhone App Store revenues were roughly twice those of Google Play Store. From that I devised a rule of thumb that an iPhone user was about 4 times more valuable than an Android user. Half the users, paying 4 times as much means double the income.
Over the years I came across a lot more data about market development (the diffusion of innovations) and market creation (the innovation process) and applied it to transportation. Along the way I also became more aware that figures of consumption and spending are not normally distributed. That it turns out that the governing function of much of human behavior is log-normal. That is, it is skewed rather than balanced or symmetric around an average. Classic examples are income distribution and the distribution of travel distances.
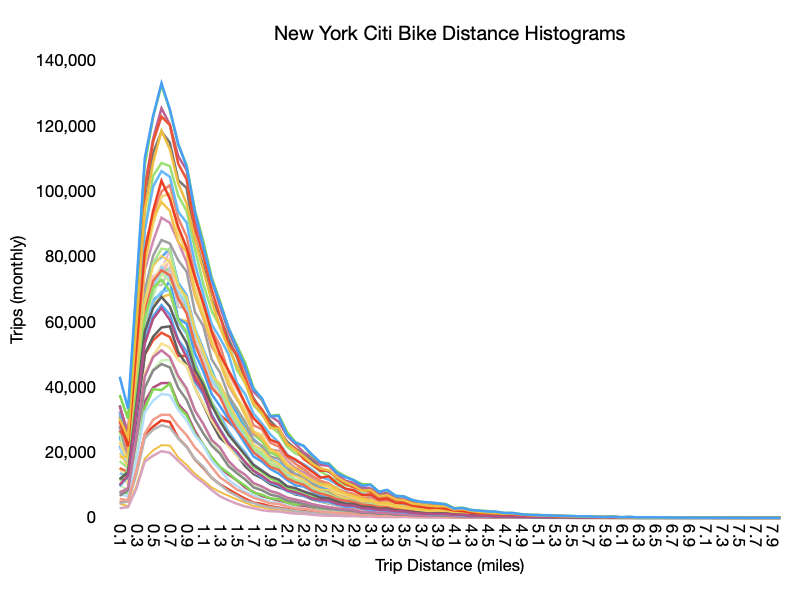
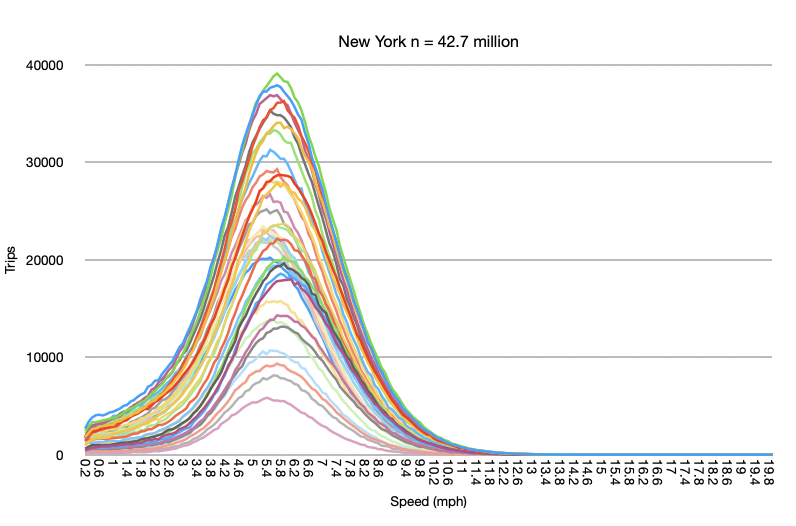
Consider the following diagrams: Trip Distances vs. Trip Speeds for New York Citi Bike travelers (n=42.7 million.)
The different lines represent different time periods spanning the months of the year.
The top graph shows that most trips are short, and the average distance is not the most common distance. The bottom graph shows that the average speed is the most common speed. The top graph is very accurately modeled with the log-normal function. The bottom graph is the classic bell curve of the normal or Gaussian function.
Income is log-normally distributed and so it has to be with services revenues. There must be a definite skew where there is a disproportionate spend by those who have more income. Thus segmenting or, to put it less kindly, discriminating customers properly is super important. Customer quality is just as important, perhaps more so, than quantity.
So let's revisit the question of user quality for online services.
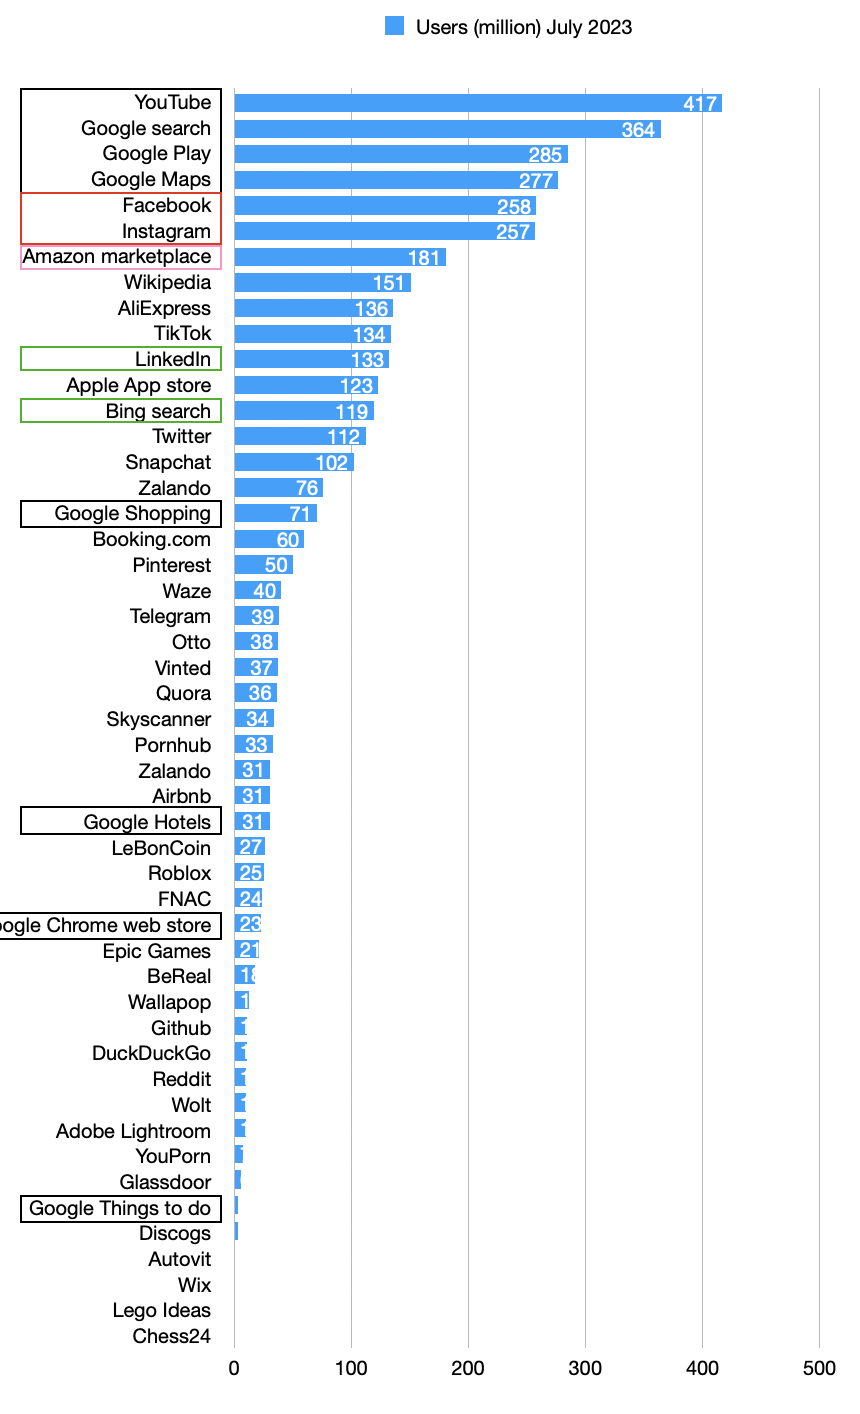
Unlike 10 years ago, there is a lot more data. The EU, for instance requires a report of the number of users on each platform.
The figures I want to focus on are those of Apple App Store and Google Play Store: 123 million and 284.6 million respectively. These are strikingly similar to the ratio of 2x between iOS and Android from my old anecdotes. However, if we look at global data, Apple claims 650 million active App Store users while Google claims 2.5 billion active users. That makes the global ratio closer to 4x Android. However, if we look at the US, the ratio is 167 million iPhone users vs. 144 million Android. In the US, iOS is a majority.
This is explained by income. The wealthier the user base the more iOS seems to be in use.
Now let's look at revenues for the platform stores.
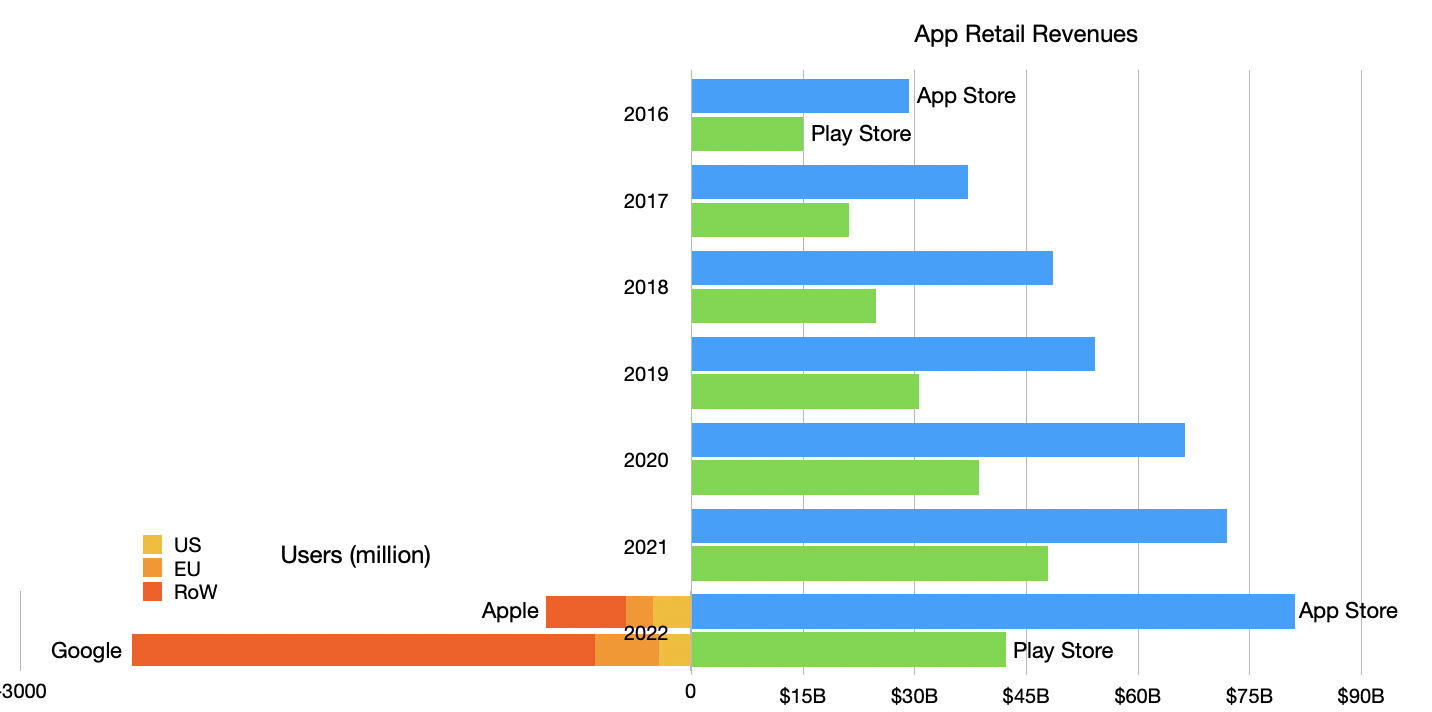
On the right side is the history of retail revenues by year from 2016 to 2022 and split between Apple App Store and Google Play Store. Mirrored on the left is the number of users, also split by store but also by region, but only for 2022. [App Store revenues are my own analysis (with validation against other sources) and include billings not just Apple's own cut. Play Store revenues are from Business of Apps.]
The ratio between revenues has kept remarkably steady, with 2016 revenues at a Apple:Google ratio of 29:15 (1.93) and 2022 at a ratio of 81:42 (1.93).
The global user numbers are, as mentioned, 3.8 to 1.
[Aside: One sanity check on the data is that the 650 million App Store users is about half of my estimate of iPhones in use (1.2 billion). That might be alarming. Why are only 54% of iPhones in use paired with App Store use? However, if we take the sum of both App Store and Play store users (3.15 billion) and compare it with the total number of global smartphone users (6.92 billion), we discover that 45.5% of all smartphone users use some store. Adding Chinese Android stores we can see that the ratio of 54% for iOS is somewhat consistent.]
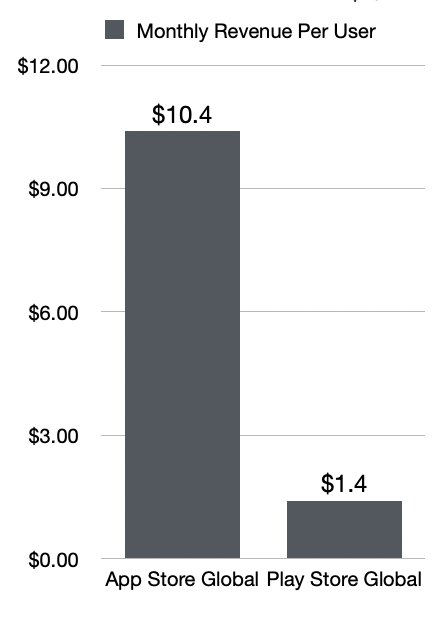
Thus we can compare the app revenue per user of the two platforms by dividing global revenue number by the global user numbers. The results are shown below:
I scaled the spending to a per-month basis.
So the picture becomes clearer. The iPhone customer is 7.4 times more valuable than the Android customer. This is more impressive than the 4x rule I had 10 years ago. The reasons are mainly that my anecdotes were from developers who sold products in the US or EU whereas expansion of smartphones to 7 billion global users has drawn in more lower spending customers.
But Apple's base has also grown to over 1 billion users (650 million store users). This highlights that Apple has effectively grown and discriminated customers effectively. It obtained not just 1 billion customers but the best 1 billion customers.
How to discriminate effectively is the holy grail of marketing. The naïve approach is to keep prices high. But that usually only results in a "luxury" branding and a small base that tends not to grow. The alternative "premium" approach is to offer functionality and multiple tiers and distribution options and financing and merchandising. There is no simple formula.
The bottom line is that Apple's approach is attracting 650 million $10/month app spenders. When we factor in additional subscription services, we get to the juggernaut that is Apple Services. This analysis has shown how difficult it is for anyone to come close to this quality of revenue.
As we look forward to Spatial Computing, the idea of increasing that spend from $10/month for a small glass rectangle in your palm to perhaps $100/month for an immersive 360-degree 3D experience does not sound too crazy.
But only if you can find those customers. I suspect Apple already knows who they are.
If you want to learn more and hear an in-depth discussion on this topic make sure you subscribe to the Asymetric Podcast on Supercast and Apple Podcasts.