Just recently, the 2 billionth iPhone was sold. Unlike the 1 billionth, there was no announcement, no celebration. Partly this is because Apple stopped reporting unit shipments, but partly it's because it's not as interesting to talk about 2 billion as it is about 1 billion. There is a desensitizing when numbers get that big. What happens after you achieve the status of the most popular and valuable product of all time? How much more better can the world absorb?
Before we answer, let's reflect on how it's going. The iPhone is doing better than ever.
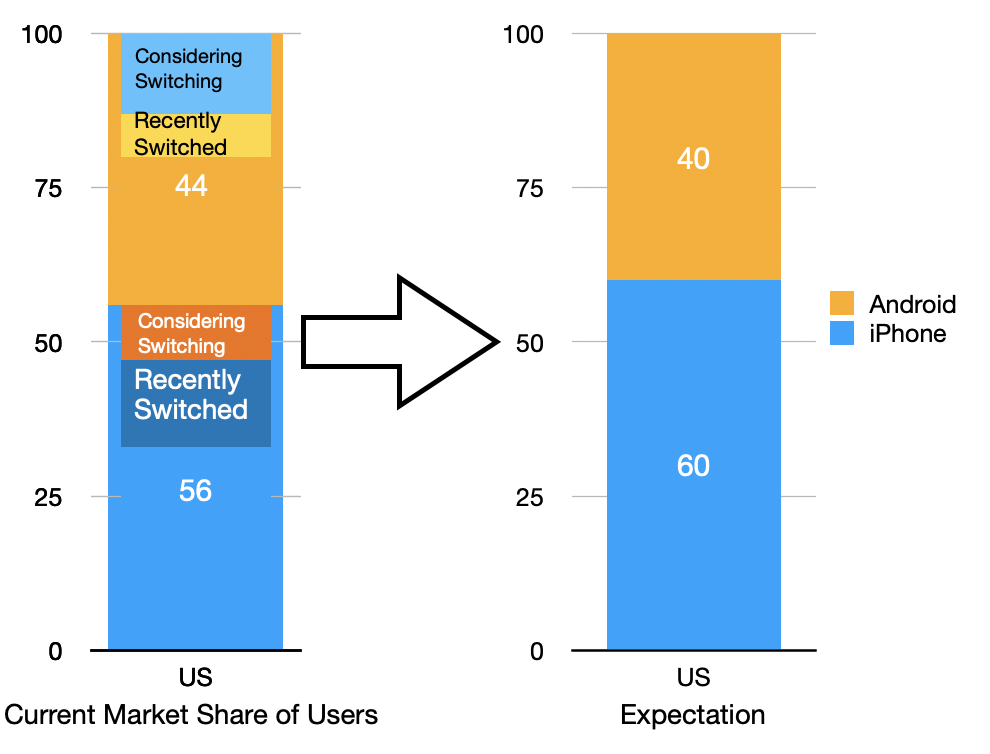
There are more than 1 billion iPhone users. The total number of users has been rising steadily. iPhone users make up about 26% of all smartphone users (3.8 billion is the current estimate). The share of users in the US is about 60% (or soon will be.) The share in UK is close to 50%. All these share numbers are higher than ever. Over 14% of US and 10% of UK survey respondents have switched to an iPhone in the past two years. The following graph shows how churn is boosting iPhone market share in terms of users.
Source: Piplsay
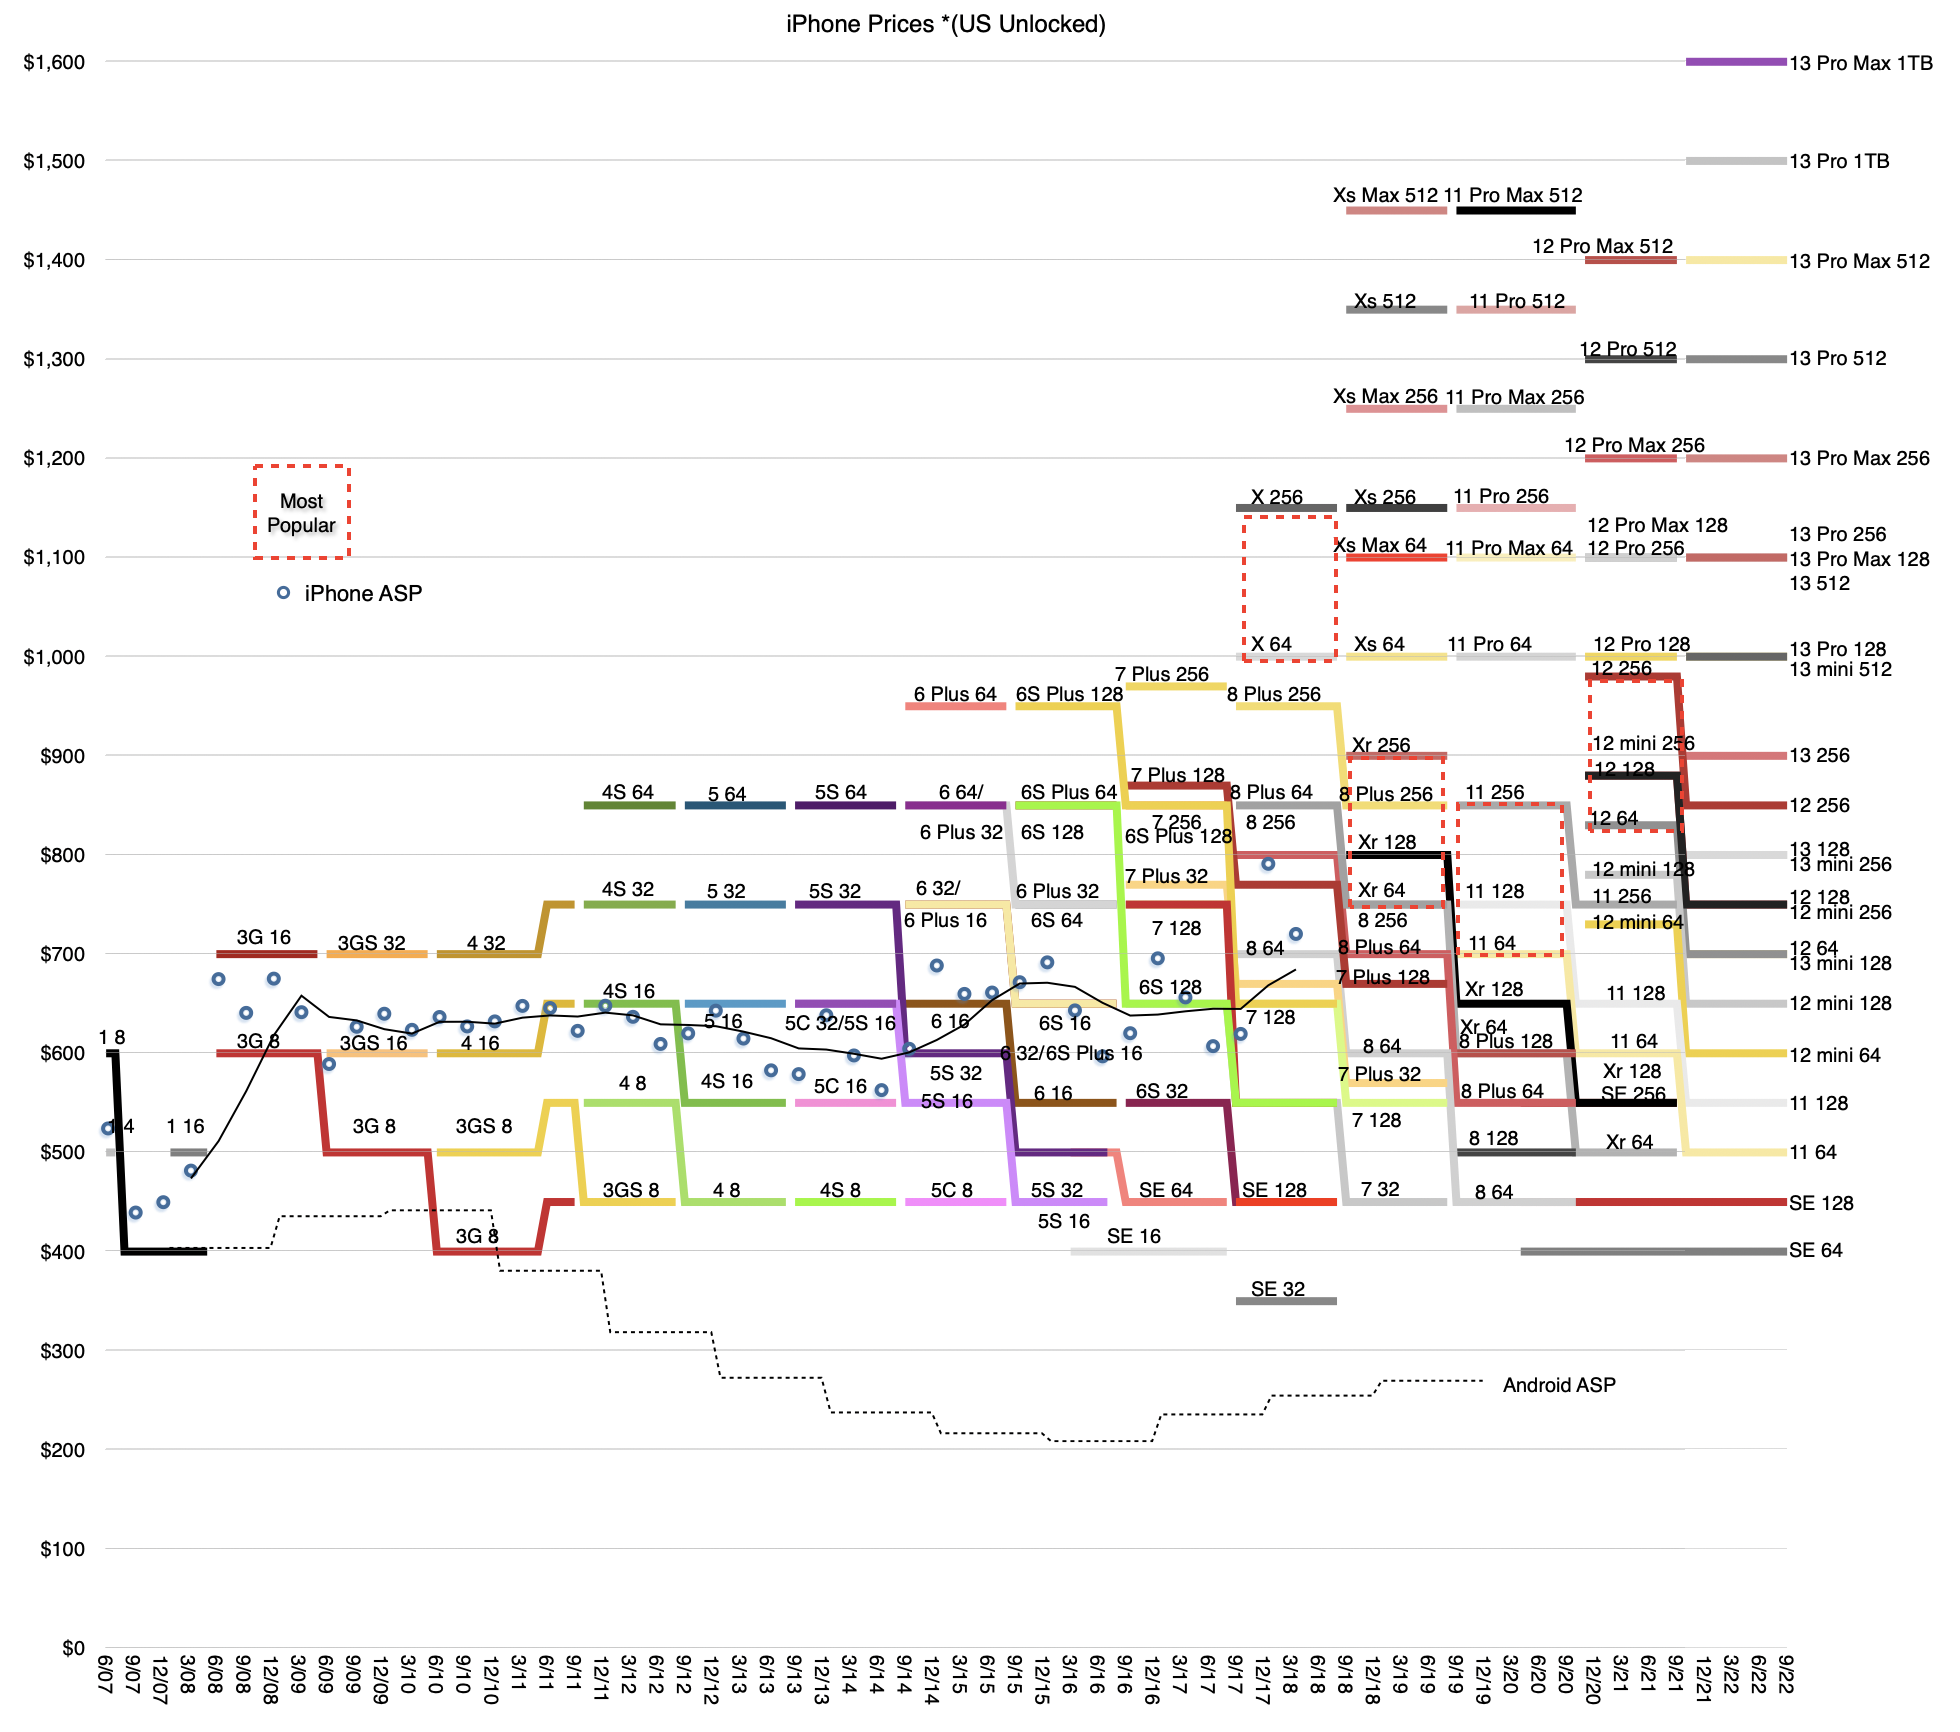
There are more iPhone configurations. As the following graph shows the spread of phone price points is wider than ever. Reaching $1600, the range still starts at $399 in the US (excluding taxes.) The total range (number of lines in each year) is increasing also, now 24 mainly due to the addition of a 1TB storage option. NB: There are now two iPhone minis (12 and 13) and one SE bringing up the rear.
Carrier incentives are picking up again. There are tremendous trade-ins and incentives for financing new iPhones which is bound to create retail traffic. Also with the opening of more economies, there is likely to be a surge in shopping. Bear in mind that around 400 million users have iPhones older than 3 years. Trade-in values are as high as $1000. Which leads to...
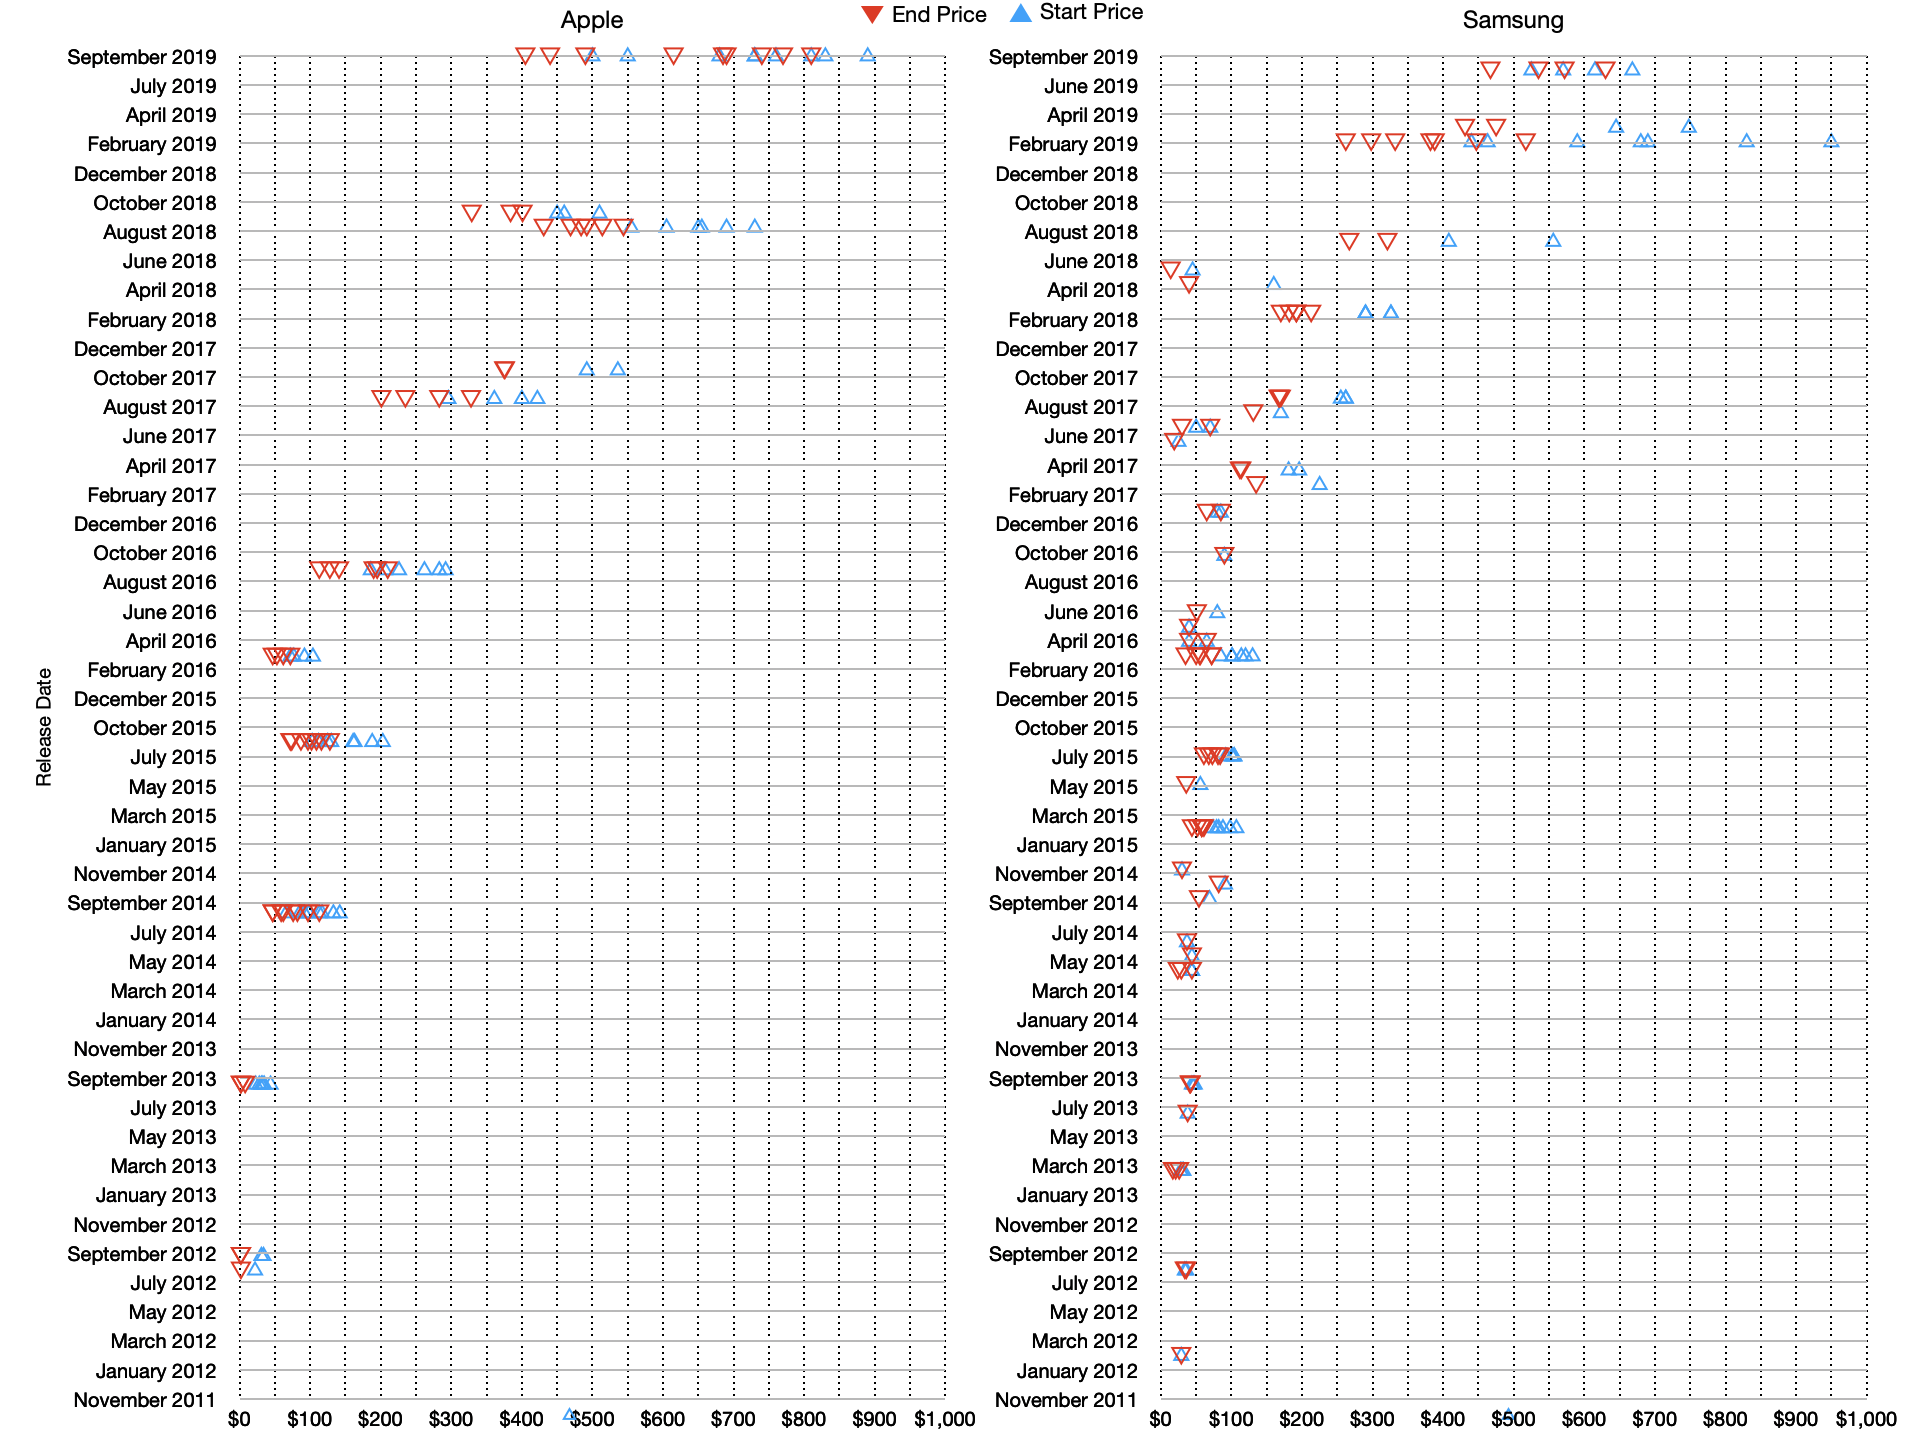
A thriving secondary market. The used smartphone market is dominated by iPhones and this drops the floor for entry into the iPhone ecosystem to essentially $0. The following graph shows price drops across 2019 for Apple and Samsung smartphones (for various models by date of initial release).
Most importantly, the specification of the iPhone continues to push the boundaries of what consumers demand from a phone. The camera performance for the latest iPhone 13 enables a set of new behaviors beyond the selfie, the snapshot or 10 second video. Apple is putting cinematographic power in the hands of amateurs. It's not so much about replacing professionals but enabling amateurs to look better to each other. Be sure to listen to the latest Asymetric podcast to hear from John J. Connor, accomplished film industry camera operator and cinematographer on the power of iPhone cameras.
The new cameras are for the new generation of YouTube, Instagram and TikTok influencers. Ordinary people with extraordinary tools can do extraordinary work.
The latest iPhone 13 is, in my opinion, the most important iPhone ever. It creates the perception of what a phone should be and it sets up the trajectory for demand that did not yet exist. It's facile to think that the utility of an ok older phone is good enough. That assumes that we are satisfied with ok messaging and ok apps. With ok photos and ok video. With no wide angles, no nightmode and no macro photos. What the iPhone has shown however is that the demand for performance can be nudged up.
We did not ask for rack focus, post-production focus (!), night mode, macro photography and portrait bokeh. But once we have these features we begin, ever so slowly, to use them and then we start demanding them. Conversely it seems that what people mostly ask for—that is what the critics ask for—are extrapolations of existing features. The "faster horse" dilemma.
What makes the iPhone and perhaps Apple special is that it seems to deliver things that nobody asks for but then everybody wants while eschewing overshooting a performance dimension that a few demand but most won't use.
The tragedy of overservice and disruption is that if you don't shift the definition of performance eventually you run out of demand at the top of the performance curve. That opens you up to "good enough" competition from below. Instead you need to re-define the notion of performance: compete on a new basis, reset expectations. That the iPhone can find new dimensions of performance and hence demand is effectively a solution to the innovator's dilemma.
The following is a transcript of the comments from Tim Cook (CEO) and Luca Maestri (CFO) at Apple's Q1 2018 Earnings Conference Call February 1, 2018. I color coded my interpretation of the comments into four categories:
Grey: Background and promotional commentary
Red: Strategy and signals of what management considers important and may include data beyond the regularly reported numbers.
Green: Financial data
Black: Commentary.
Blue: My commentary, in brackets.
For a quick read of Apple's strategy, read the Red text. These comments are not repeated in financial reports. Highly recommended.
For a quick read of Apple's financial performance, read the green text (which are replicated in financial reports). Read this if you don't want to wade through the financial reports.
For marketing or product material, read the grey text.This is sometimes unique but also repeats product launch information.
---- Tim Cook: Thanks, Nancy and thanks everyone on the call, and welcome to everyone today. Before we dive into the quarter, I'd like to take a moment to talk about a significant milestone we recently crossed.
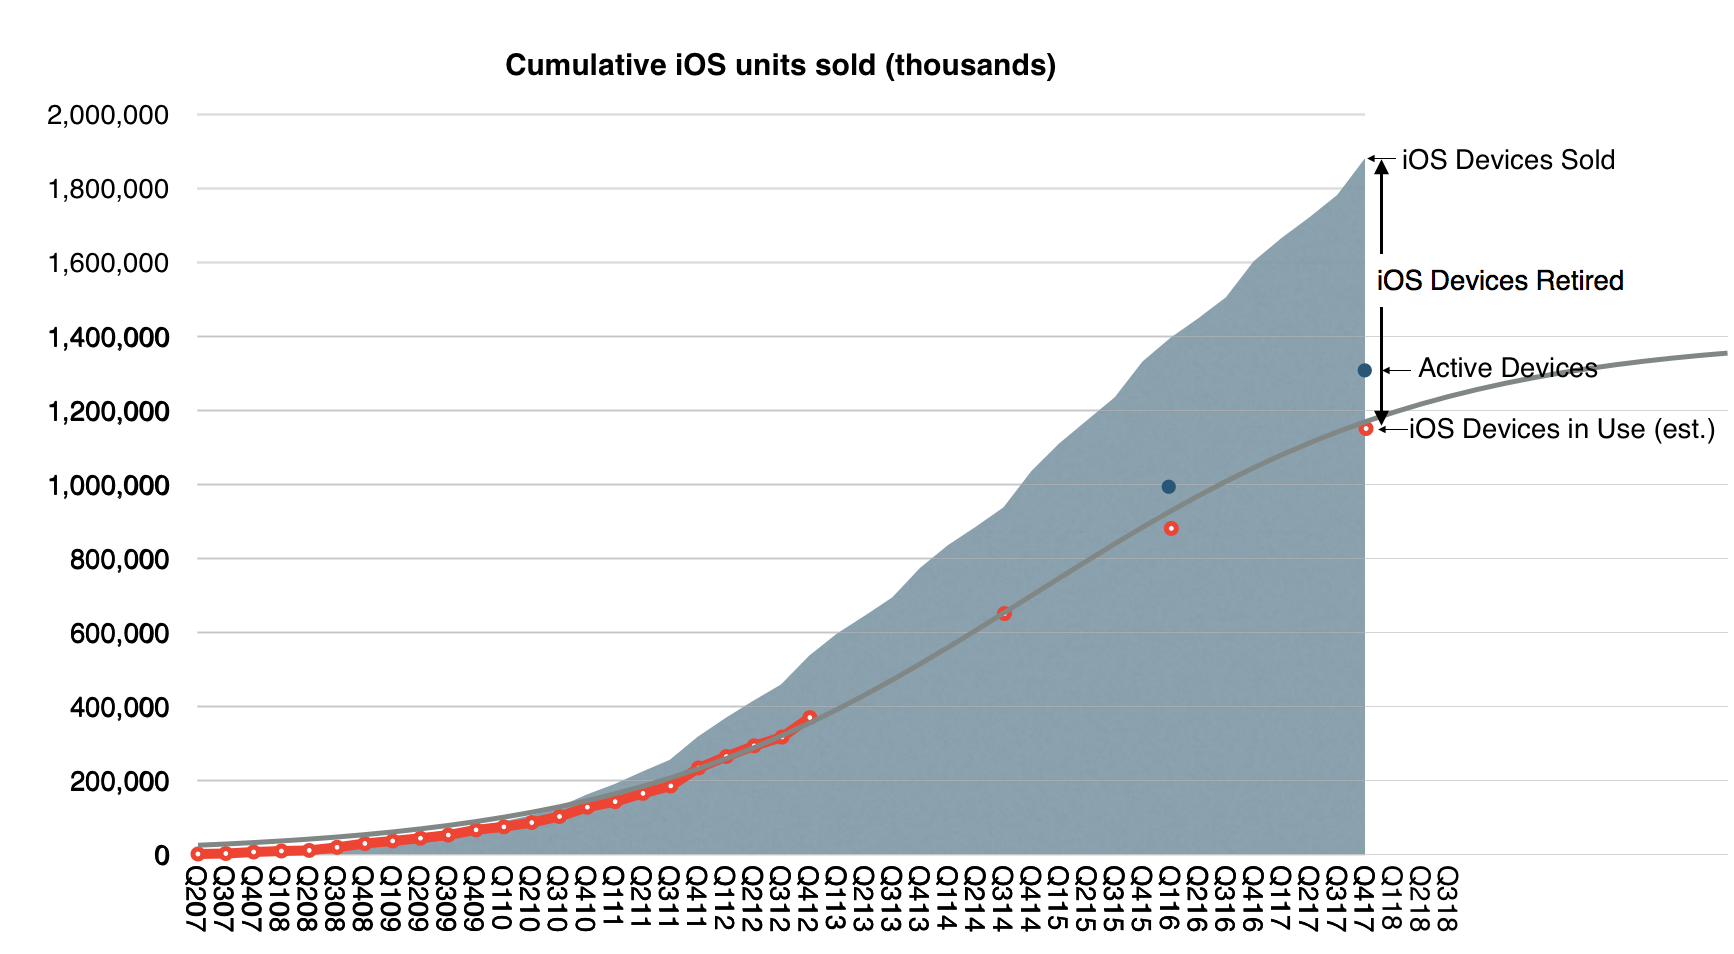
Apple's active installed base reached 1.3 billion devices in January and is at an all-time high for all of our major products. 1.3 billion devices represents an astonishing 30% growth in just two years. It speaks to the strength and reliability of our products and our ecosystem, as well as the loyalty, satisfaction and engagement of our customers. It's also fueling tremendous growth in our services business, which I’ll talk about a little later in the call. [This is probably Apple's most important number. For at least the next 20 years this is the key performance metric and it can be used to derive company's valuation. A summary of the history of active devices vs. units sold is shown in the graph below:]
Turning to the December quarter. We're thrilled to report Apple's biggest quarter ever, which set new all-time records in both revenue and earnings. We generated revenue of $88.3 billion, which is above the high-end of our guidance range, and it is up almost $10 billion or 13% over the previous all-time record we set a year ago.
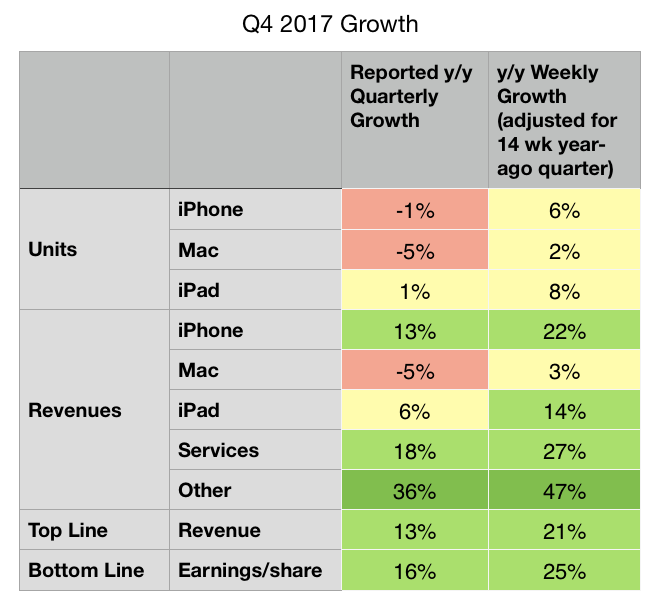
It's also our fifth consecutive quarter of accelerating revenue growth with double digit growth in each of our geographic segments around the world. What makes us even more remarkable is that the quarter we're reporting today was 13-weeks long, while the year ago quarter was 14-weeks. When we look at the average revenue per week in the December quarter this year compared to last year, our growth was a stunning 21%. [The 13-week vs. 14-week year-on-year comparison is repeated several times. The summary differences are shown in the table below:]
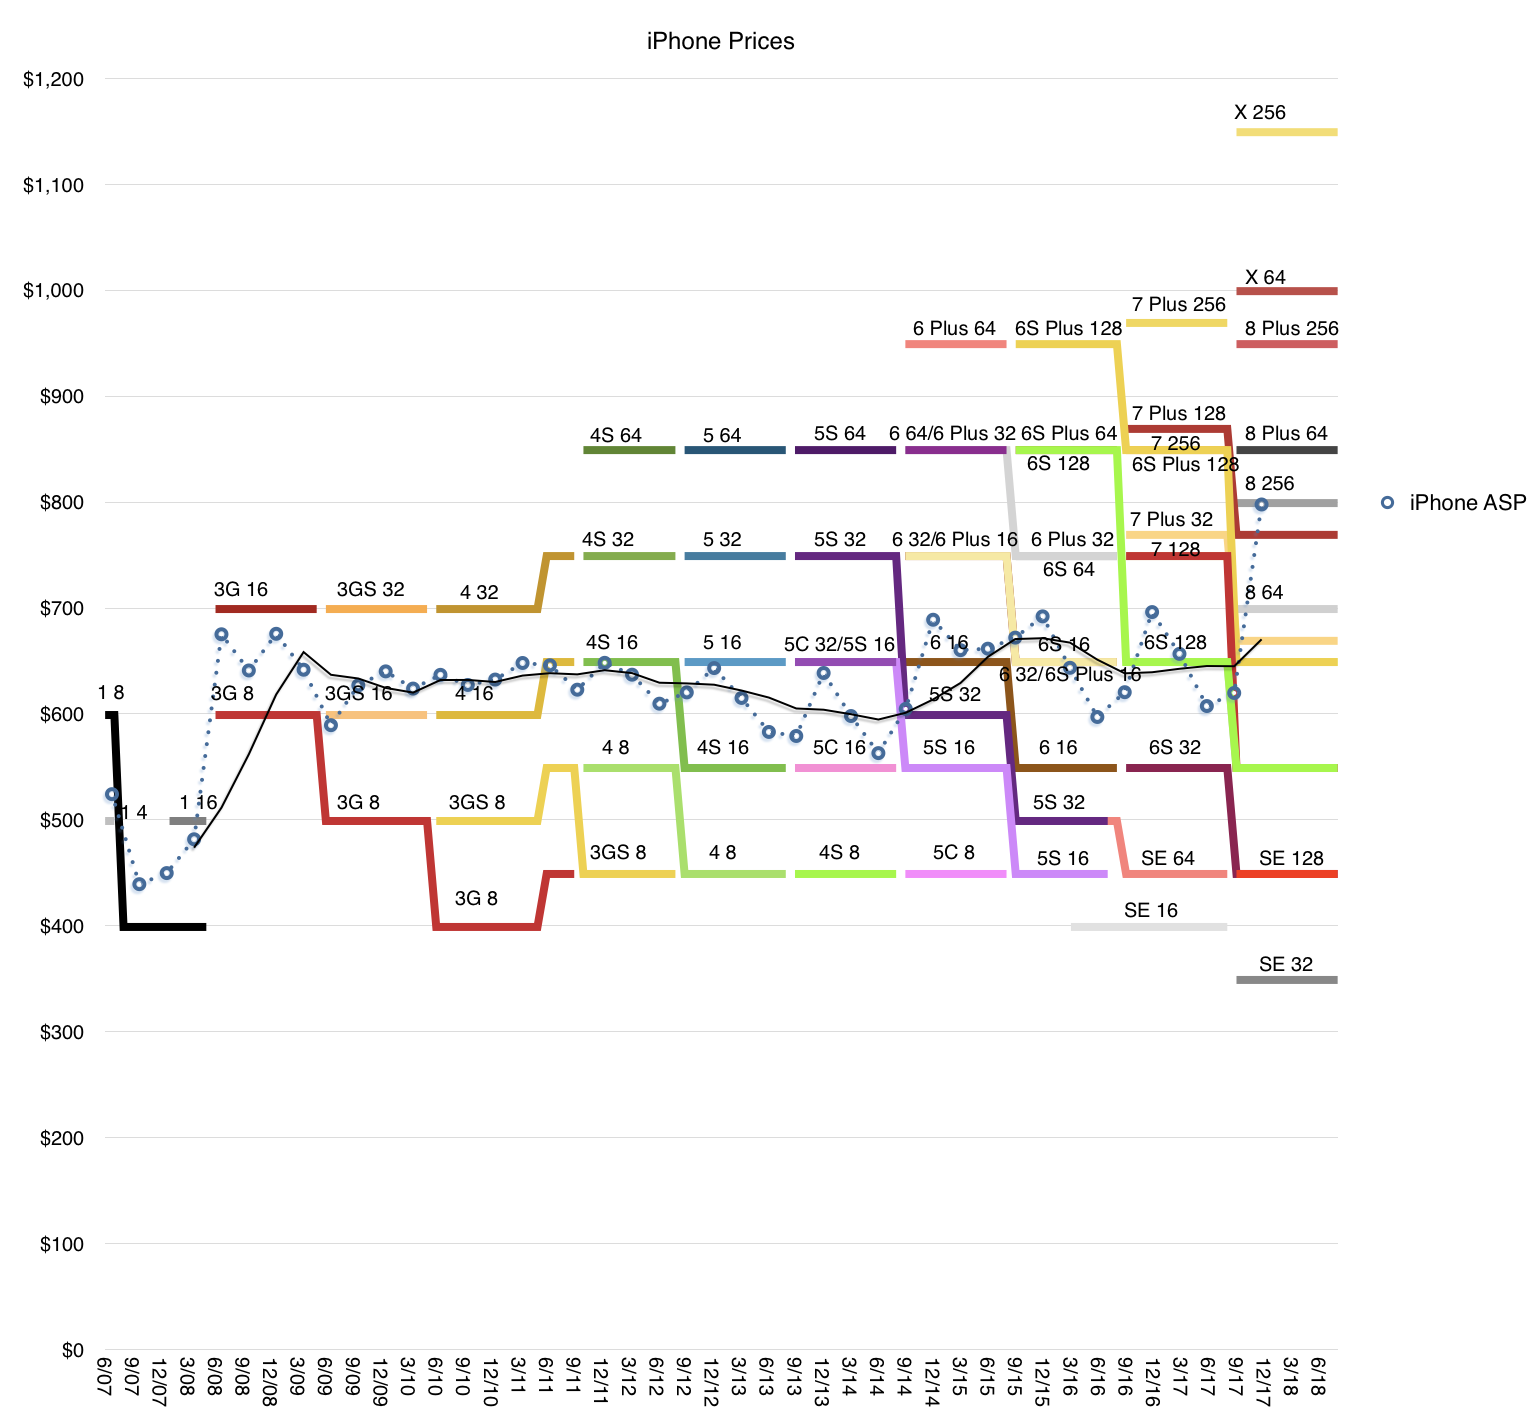
Our growth was broad-based and a key driver was iPhone, which generated its highest revenue ever. iPhone X was the best-selling smartphone in the world in the December quarter according to Canalys, and it has been our top selling phone every week since it launched. iPhone 8 and iPhone 8 Plus rounded out the top three iPhones in the quarter. In fact, revenue for our newly launched iPhones was the highest of any lineup in our history, driving total Apple revenue above our guidance range. [The iPhone X is a huge hit. It drove the average selling price $100 higher y/y. This is not only unprecedented for Apple but for the entire Industry. The average smartphone sells for less than $300 while iPhones sold for $800. The gap is widening. The following graph shows the product mix and the average resulting price.]
I want to take a moment to recognize the tremendous amount of work that went into creating iPhone 10. Our teams carried out an extremely complex launch from both an engineering and operations perspective, executing an outstanding product ramp that required years of research and development; one that introduced innovative features like an edge-to-edge Super Retina Display and the TrueDepth Camera, which enables face ID. Our customers love these new features and the new gestures like simply swiping up from the bottom, which make using iPhone even more intuitive and enjoyable.
Our team has put the technology of tomorrow in our customers’ hands today, set a standard for the next decade of smartphones and we are very proud of their achievements.
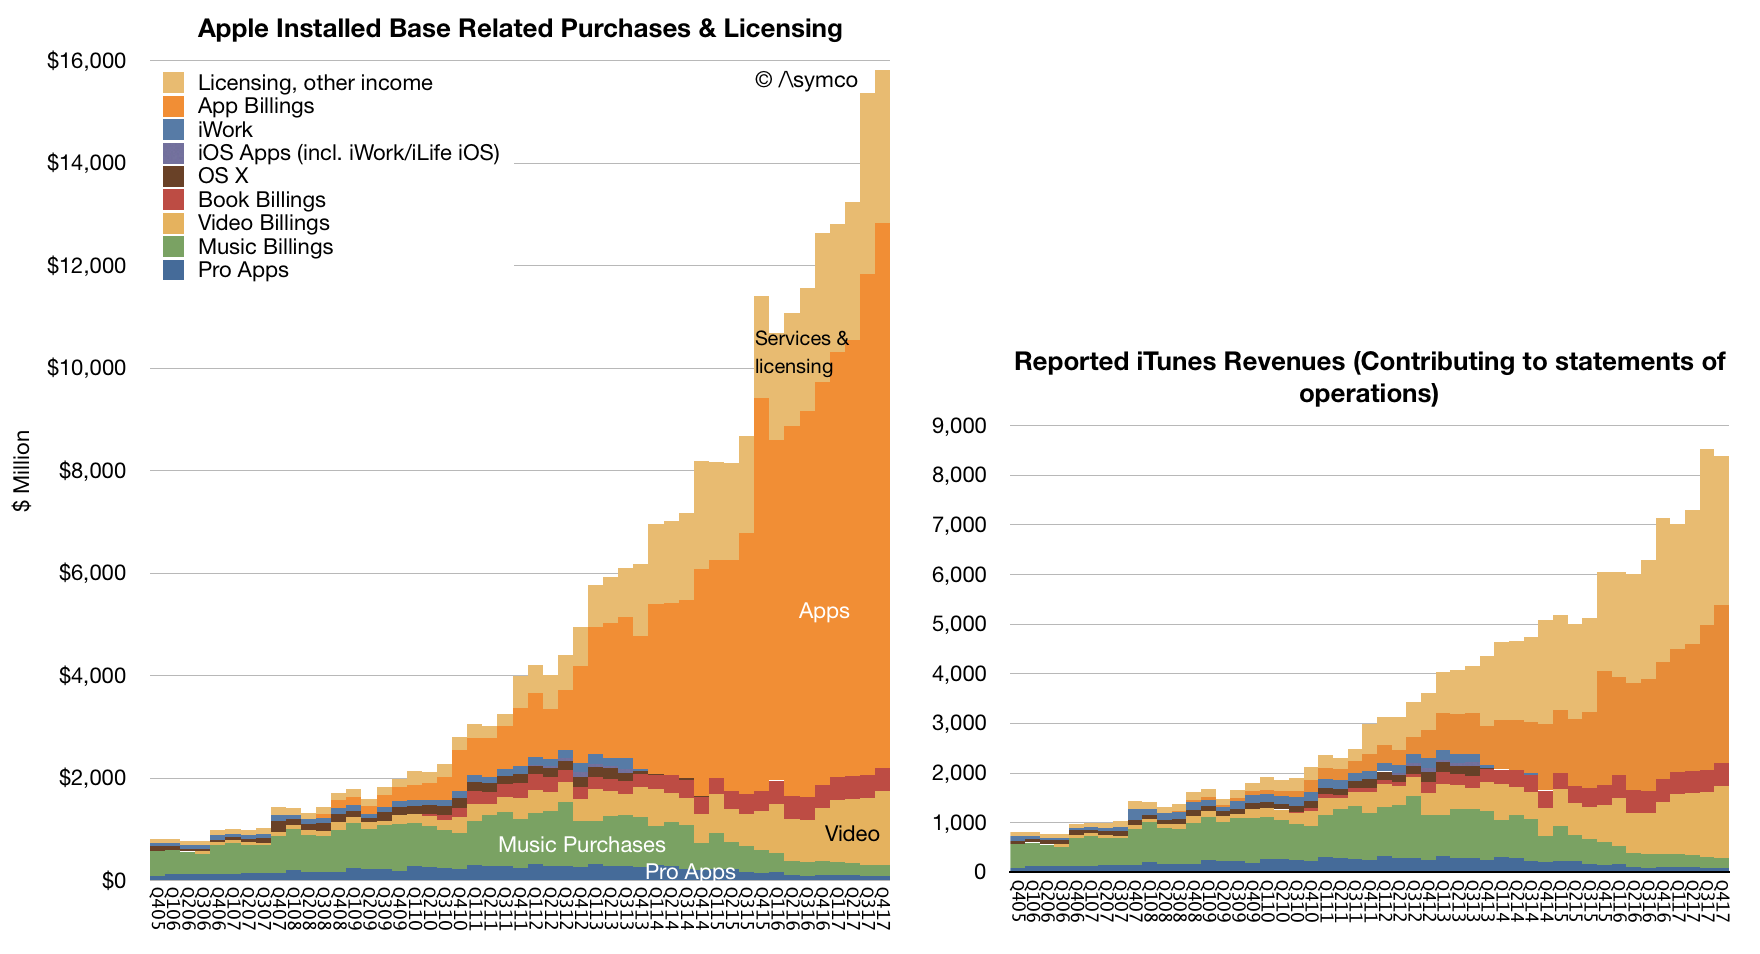
It was another very strong quarter for services with revenue of $8.5 billion, up 18% over last year, and we’re on pace to achieve our goal of doubling our 2016 services revenue by 2020. The number of paid subscriptions across our services offerings passed 240 million by the end of the December quarter, that’s an increase of 30 million in the last 90 days alone, which is the largest quarterly growth ever. [Services has been growing relentlessly for over a decade. This steadiness of growth makes is a juggernaut. Apple is increasingly speaking about subscriptions as the key metric and 240 million is reaching record territory. The rise of Services is shown below (both revenues and consumer spending.)]
We had an all-time record quarter for the App Store with our best holiday season ever. We’re seeing great excitement around augmented reality with customers now enjoying over 2,000 ARKit enabled app, spanning every category in the App Store. In December, when Pokémon GO released its new augmented reality features built with ARKit, it jumped the top of the App Store charts. Last week, on a stop in Toronto, I met developers who are hard at work on creative applications using ARKit from art appreciation to ecommerce, and I was very impressed with what I saw.
Just for months after ARKit launched to the public, we’ve already released ARKit 1.5 in beta to developers around the world, and the response has been tremendous. Augmented reality is going to revolutionize many of the experiences we have with mobile devices. And with ARKit, we’re giving developers the most advanced tools on the market to create apps for the most advanced operating system running on the most advanced hardware. This is something only Apple can do.
In addition to the App Store, several other services had their biggest quarter ever, including Apple Music, iCloud and Apple Pay, all of which saw growth in both active users and revenue.
Apple Pay has reached an important milestone in the U.S. As a result of 50% year-over-year growth in merchant adoption, it’s now accepted at more than half of all American retail locations, which includes more than two-thirds of the country’s top 100 retailers. Now available in 20 markets, global Apple Pay purchase volume more than tripled year-over-year and we’re delighted to be expanding to Brazil in the coming months. [There are no absolute data points on Apple Pay but we do have some scattered growth data. The US data is cited here but in my experience it's more popular in select countries like UK where users are using it habitually]
Today, you can use Apple Pay to take the subway in Guangzhou, China, see a concert at London’s Wembley Stadium or buy a souvenir in Yosemite National Park. In the U.S., we launched Apple Pay Cash in December, and it’s off to a terrific start. Millions of people are already using it to send and receive money with friends and family quickly, easily and securely; to split a bill, pay someone back, or send last minute gift right from the messages app.
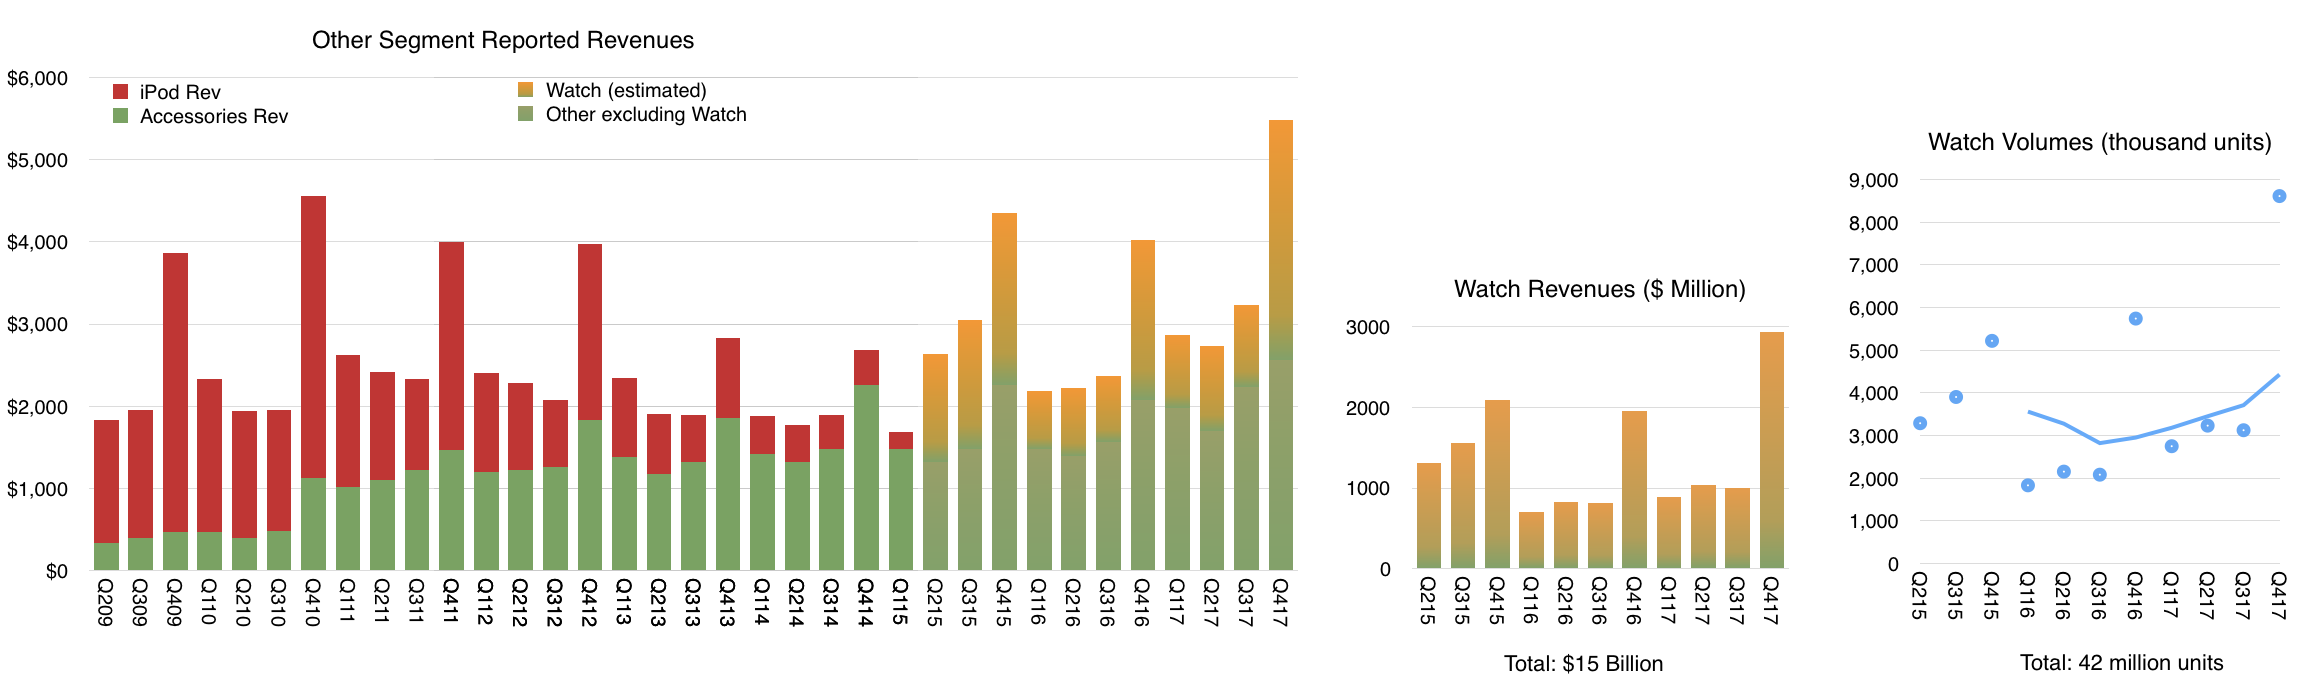
It was our best quarter ever for the Apple Watch with over 50% growth in revenue and units for the fourth quarter in a row and strong double-digit growth in every geographic segment. Sales of Apple Watch Series 3 models were also more than twice the volume of Series 2 a year ago. Apple Watch is the most popular, smart watch in the world and gained market share during the quarter based on the latest estimates from IDC. [Apple Watch is growing consistently. The following graph shows my estimates of volume (total 42 million to date) and revenues (total $15 billion) based on all available data and commentary from management.]
It was the third consecutive quarter of growth for iPad revenue, thanks to the strength of both iPad and iPad Pro. Based on the latest data from IDC, we gained share in nearly every market we track with strong outperformance in emerging markets.
Worldwide, almost half of our iPad sales were the first-time tablet buyers are those switching to Apple, and that’s true in some of our most developed markets, including Japan and France. In China, new and switching users made up over 70% of all iPad sales.
For Mac, we launched the all new, iMac Pro in mid-December. It’s an entirely new product line designed for our Pro users who love the all-in-one design of iMac and require workstation class performance. It's the fastest, most powerful Mac ever, delivering incredible computational power, for simulation and real time 3D rendering, immersive VR and complex photography audio and video projects. Worldwide, 60% of our Mac sales were the first time buyers and switchers and in China, that number was almost 90%.
We're looking forward to getting HomePod in customers’ hands beginning next week. HomePod is an innovative wireless speaker, which delivers stunning audio quality wherever its placed in the home, thanks to the advanced Apple engineered hardware and software.
Together with Apple Music, HomePod gives you instant access to one of the world's largest music catalogs. And with the intelligence of Siri, it’s a powerful assistant you control through natural voice interaction. We're very happy with the initial response from reviewers who've experienced HomePod ahead of its launch, and we think our customers are going to love this new product.
We believe one of the key issues of the 21st century is education. And because of that, we've strengthened our commitment and investment into initiatives like everyone can code. To find the innovators of the future, we need to nurture the students of today. Our App Development with Swift curriculum, which is available free on iBooks, has been downloaded more than 1.2 million times worldwide with almost half of those coming from here in the United States. It’s also being taught in dozens of community colleges across the country, putting practical skills in the hands of today’s jobs seekers.
I was in London two weeks ago as we announced that the program was expanding to more than 70 colleges and universities in Europe. Millions of students around the world will have the opportunity to add Swift to their coding vocabulary and gain skills that are essential for today’s economy.
This is an exciting time at Apple and with the best lineup of products and services we've ever had and a set of initiatives that show how business can be a force for good in the world. We could not be more excited about our future.
Now, for more details on the December quarter results, I'd like to turn over the call to Luca.
Luca Maestri: Thank you, Tim. Good afternoon, everyone. Our business and financial performance in the December quarter were exceptional, as we set new all-time records for revenue, operating income, net income and earnings per share.
Starting with revenue, we’re reporting an all-time record, $88.3 billion, up nearly $10 billion or 13% over the prior record set last year. It is our fifth consecutive quarter of accelerating revenue growth. As you know, the December quarter a year ago spanned 14-weeks compared to 13-weeks this year, which is important to consider as we have set the underlying performance of our business this year. When we look at average revenue per week, our growth rate was even higher at 21% with growth across all product categories for the third consecutive quarter.
Our results were terrific all around the world with double digit revenue growth in all our geographic segments, an all-time quarterly record in the vast majority of markets we track, including the U.S., Western Europe, Japan, Canada, Australia and Korea, as well as Mainland China, Latin America, The Middle East, Central and Eastern Europe, and India.
In Greater China, we were very happy to generate double digit revenue growth for the second quarter in a row and in emerging markets outside of Greater China, we saw 25% year-over-year growth.
Gross margin was 38.4% at the high end of our guidance range. Operating margin was 29.8% of revenue. Our net income was $20.1 billion an all-time record, and up $2.2 billion over the last year. Diluted earnings per share were $3.89 also an all-time record and cash flow from operations was very strong at $28.3 billion.
During the quarter, we sold 77.3 million iPhones, the highest number ever for a 13-week quarter. Average weekly iPhone sales were up 6% compared to December quarter last year with growth in every region of the world despite the staggered launch of iPhone 10. We established all-time iPhone revenue record in nearly every market we track with double-digit growth in all of our geographic segments. iPhone ASP increased to $796 from $695 a year ago, driven primarily by the launch of iPhone 10 and the success of iPhone 8 and 8 Plus.
We exited the December quarter towards the lower end of our target range of five to seven weeks of iPhone channel inventory with less than 1 million more iPhones in the channel compared to the December quarter a year ago, in line with our growth in average weekly unit sales. Customer interest and satisfaction with iPhone are very, very strong for both consumers and business users.
The latest data from 451 Research indicates U.S. customer satisfaction ratings of 96% or higher across iPhone models. In fact, combining iPhone 8, iPhone 8 Plus and iPhone 10, consumers reported an amazing 99% satisfaction rating. And among business customers planning to purchase smartphones in the next quarter, 77% planned to purchase iPhone. Our customers are also incredibly loyal with Kantar's latest U.S. research, reflecting a 96% iPhone loyalty rate, the highest ever measured. [Customer satisfaction is the second most important figure after active user base. Combining these two figures yields the recurring revenue value of the company. Remember what Deming said: the most important measurements for a company's value are the multipliers of a satisfied customer and a dissatisfied customer--these numbers never appear on any financial report but they are applied to all the numbers on every report].
Turning to services. We had a terrific quarter with revenue of $8.5 billion, up 18% year-over-year and up 27% in terms of average revenue per week; that is an acceleration to the 24% services growth run rate that we experienced in the September quarter.
The App Store set a new all-time revenue record. The Store’s all-new design is off to a fantastic start with quarterly store visitors, transacting accounts and paying accounts, reaching new all-time highs. During the week beginning December 24th, a record number of customers made purchases or downloaded Apps from the App Store, spending over $890 million in that seven-day period, followed by $300 million in purchases on New Year’s day alone.
And according to App Annie’s latest report, the App Store continues to be the preferred destination for customer purchases by a very wide margin, generating nearly twice the revenue of Google Play. Across all our services offerings, paid subscriptions reached $240 million with growth of 58% over last year and they were a major contributor to the overall strong growth in services revenue. [Apple has half the user base of Google Android. This is based on Google's May 2017 report of 2 billion active devices vs. the 1.3 billion that we just got from Apple. And yet these users collectively spend twice as much on apps. This ratio of "half the users, twice the spending" has been cropping up in individual developer anecdotes and can also be seen in other metrics of engagement and consumption. This should not be surprising as it conforms to the Pareto distribution of economic value.]
As Tim mentioned, it was our best quarter ever for Apple Watch. And when we add to this us from Beats and AirPods, our total revenue from wearables was up almost 70% year-over-year. In fact, wearables were the second largest contributor to revenue growth after iPhone, which is impressive for a business that started only three years ago. In total, our other products category set a new all-time record with quarterly revenue exceeding $5 billion for the first time. [Wearables now includes more than watches but watches are likely still the dominant product.]
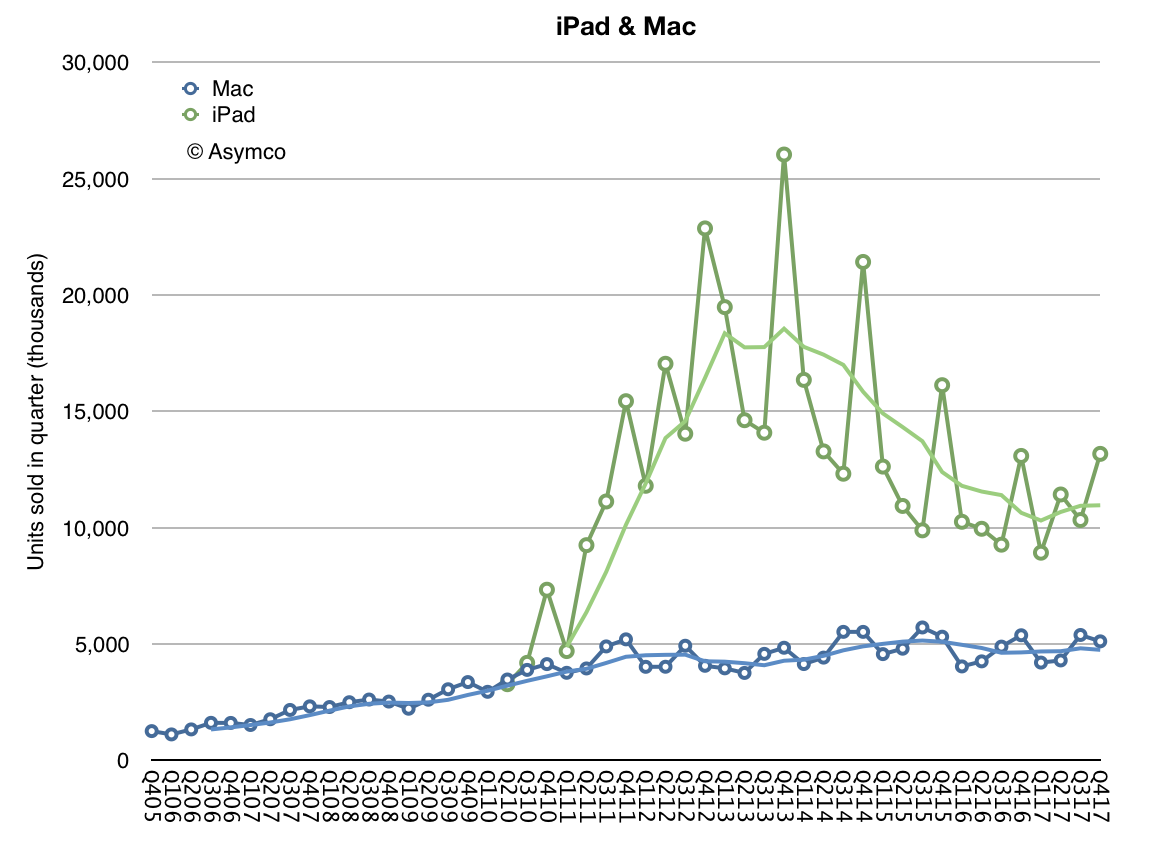
Next, I’d like to talk about the Mac. We sold 5.1 million Macs during the December quarter, which translates to a 2% year-over-year increase in average sales per week. Mac performance was particularly strong in emerging markets with unit sales up 13% year-over-year and with all-time records in Latin America, in India, Turkey and Central and Eastern Europe. On a worldwide basis, the active install base of Macs was up double-digits year-over-year to a new record.
It was also another growth quarter for iPad. We sold 13.2 million units with average iPad sales per week up 8% over last year’s December quarter. iPad sales grew strong double-digits in many emerging markets, including Latin America, the Middle East, Central and Eastern Europe and India, as well as developed markets, including Japan, Australia and Korea. The active install base of iPad has grown every quarter since its launch in 2010, and it reached a new all-time high in December, thanks to extremely high customer loyalty and large numbers of first-time iPad users. [iPad is clearly recovering from a long decline. ASPs are rising as it's being positioned as a PC alternative. Its low end functions are being absorbed by large screen iPhones.]
NPD indicates that iPad had 46% share of the U.S. tablet market in the December quarter, up from 36% share a year ago. And the most recent surveys from 451 Research found that among customers planning to purchase tablets within 90 days, 72% of consumers and 68% of business users planned to purchase iPads. Customer satisfaction is also very high with businesses reporting a 99% satisfaction rating for iPad.
We are seeing great traction in enterprise as businesses across industries and around the world standardize on iOS. For example, Intesa Sanpaolo, one of Europe’s leading banks, has chosen iOS as the mobile standard for its entire 70,000 employee base in Italy; choosing iOS for its security, user interface, accessibility and reliability, Intesa Sanpaolo will deploy native apps to improve employee productivity in customer support, human resources, and marketing across the company.
And LensCrafters, one of the largest optical retail brands in North America, will be using over 7,000 iPad Pros to enable digital eye exams and digital optical measurements in a personalized and interactive experience. We’re also rolling out a new initiative, called Apple AtWork to help businesses implement employee choice programs more easily and offer Apple products company-wide.
Resources from both Apple and our channel partners will enable enterprise IT and procurement teams to buy or lease Apple products more efficiently, streamline the setup of iPhone, iPad, and Mac, and deliver a seamless onboarding experience for employees. We launched the program with CDW in the U.S. last week, and we would be expanding to more channels and regions later this year.
The December quarter was extremely busy for our retail and online stores, which welcomed 538 million visitors. Traffic was particularly strong during the four-weeks following the launch of iPhone 10, up 46% over last year. And across the quarter, our stores conducted over 200,000 today at Apple sessions, covering topics including photography, music, gaming, and app development, and art and design. Just last weekend, we opened our first store in Seoul, Korea and we’re looking forward to opening our first store in Austria in a few weeks. These newest openings will mark the expansion of our retail store presence to 21 countries.
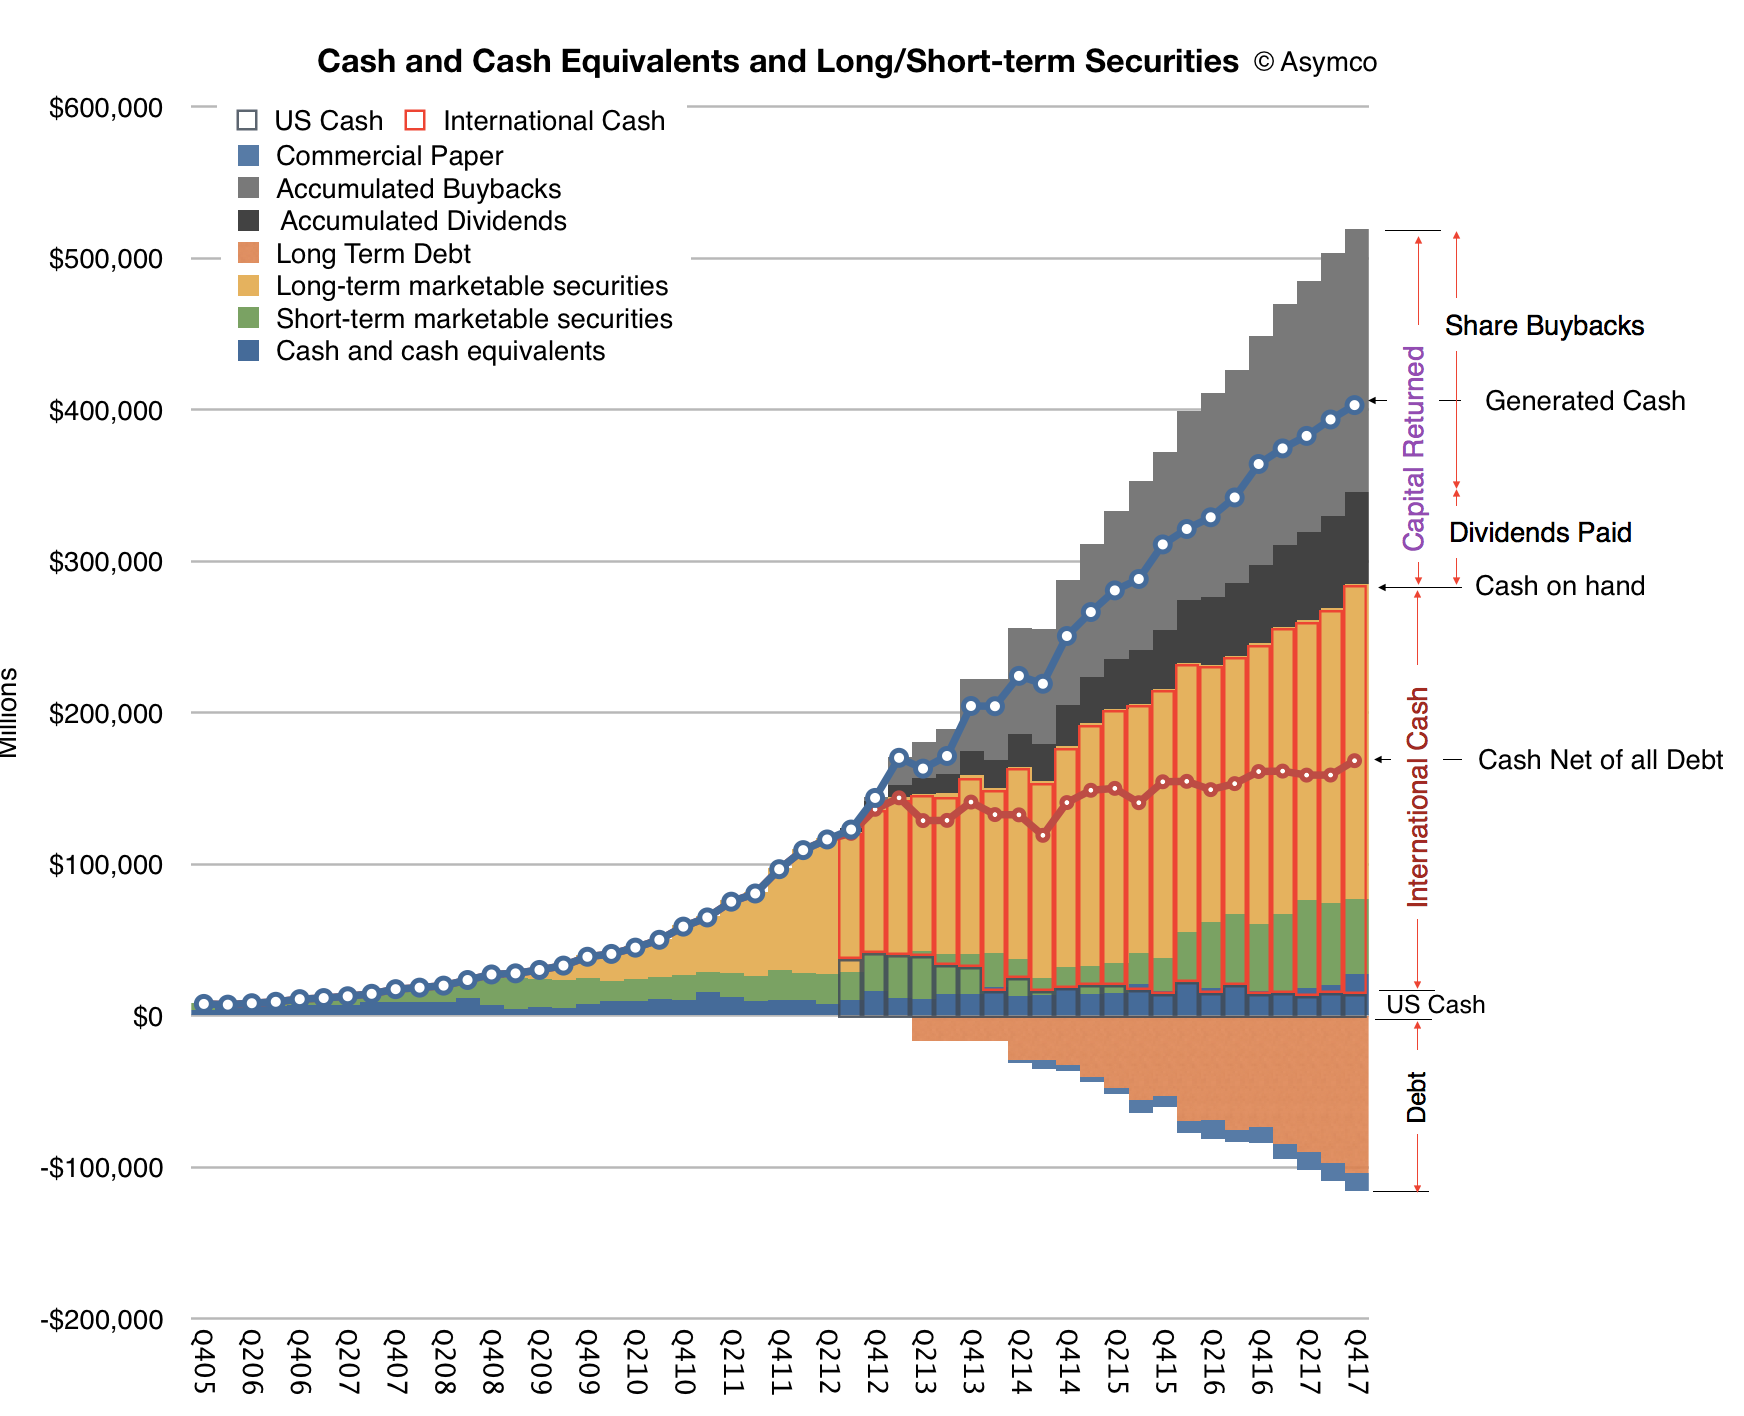
Let me now turn to our cash position. We ended the quarter with $285.1 billion in cash plus marketable securities, a sequential increase of $16.2 billion. $269 billion of this cash, or 94% of the total, was outside the United States. We issued $7 billion in debt during the quarter, bringing us to $110 billion in term-debt and $12 billion in commercial paper outstanding, for a total net cash position of $163 billion at the end of the quarter. We also returned $14.5 billion to investors during the quarter. We paid $3.3 billion in dividends and equivalents, and spent $5.1 billion on repurchases of 30.2 million Apple shares through open market transactions.
We launched a new $5 billion ASR program, resulting in initial delivery and retirement of 23.6 million shares and we retired 3.8 million shares upon the completion of our 12th ASR during the quarter. We’ve now completed over $248 billion of our $300 billion capital return program, including $176 billion in share repurchases against our announced $210 billion buyback program with $34 billion remaining under our current authorization. [An updated look at Apple's cash is shown below]
Turning to taxes. Due to the recently enacted legislation in the U.S., we estimate making a corporate income tax payment of approximately $38 billion to the U.S. government on our cumulative past foreign earnings. This amount is very similar to what we had been accruing on those earnings in our financial results through fiscal year 2017, including the $38 billion payment. We will have paid over $110 billion of corporate income tax on our total domestic and foreign earnings during the last 10 years for a cash tax rate of about 26%. [Apple has paid more tax than any company in history, and is about the make the largest single payment to the US Treasury.]
Our tax rate of 25.8% for the December quarter was close to our guidance of 25.5% as the lower U.S. statutory rate from the new legislation was effective offset by the remeasurement of deferred tax balances.
As we move ahead into the March quarter, I'd like to review our outlook, which includes the types of forward looking information that Nancy referred to at the beginning of the call; we expect revenue to be between $60 billion and $62 billion; we expect gross margin to be between 38% and 38.5%; we expect OpEx to be between $7.6 billion and $7.7 billion; we expect OI&E to be about $300 million; and we expect the tax rate to be about 15%.
Tax reform will allow us to pursue a more optimal capital structure for our company. Our current net cash position is $163 billion. And given the increased financial and operational flexibility from the access to our foreign cash, we are targeting to become approximately net cash neutral overtime. We will provide an update to our specific capital allocation plans when we report results for our second fiscal quarter, consistent with the timing of updates that we have provided in the past.
Finally, today our Board of Directors has declared a cash dividend of $0.63 per share of common stock, payable on February 15, 2018, to shareholders of record as of February 12, 2018.
The above interview was conducted October 17 with Carlos Morales Editor en Jefe, Forbes Digital (Mexico).
The source questions and my answers in English are below:
How can we read the fact that the new iPhone lineup raised so little noise? There was no massive lines outside the Apple Stores and people demonstrated almost zero interest in the new models compared with the hype motivated by the iPhone 7.
I don’t know about you but I don’t like waiting in lines. I don’t think Apple considers waiting in lines to be a good user experience for its customers. Over the years Apple has been able to improve availability and online orders so that lines can be eliminated. I suggest a better way to gauge interest in new models and that would be to look at sales. Sales seem to be going up even as lines have been going down.
The iPhone 8. What do you think of the fact that the iPhone 7 is outselling the iPhone 8?
Is it a fact? I think this notion is coming from a survey of operator stores in the US over a short time period. The mix of phones has never been known and is a matter of speculation. The only data we do have is the average selling price derived by dividing the revenues by the number of units sold (and ignoring deferrals). This price set a new record during the last 12 months. Expectations are that it will increase to another record again next year. I might add that this has never been observed in the phone business as far as I know. The opposite has been the trend.
Whats the outlook for the the iPhone 8 vs the iPhone 7 and the iPhone X?
The iPhone 8 is likely to be the best selling model over the next 12 months. The iPhone X will be the best seller in the first quarter but I expect it will come second during the following quarters. The iPhone 7 will end up 3rd.
What do you think about the smartphone prices, aren't they too high? How far can they be stretched ?
Smartphone prices are very low. World-wide, average smartphones sell for less than $300. You can see a break-down by region here.
iPhone prices are, on average, more than double the average of all smartphones. Note that apple’s latest line-up also includes the cheapest iPhone ever with the SE now starting at $350.
I don’t think the average selling price will increase in 2018 globally. It will probably decrease as it has for a long time. Average iPhone prices will increase but probably only by $10 or so.
The iPhone price tiers are well understood. I published an analysis here:
More important however is that the iPhone remains priced at about $1/day, no matter the model, and as such the value users perceive is very high. The most expensive iPhone costs about 8 cents per hour of use, 1.4 cents each time you unlock it and 1 cent for ever 25 interactions you have with it (touches or taps). On a per use basis the iPhone is extraordinarily cheap. I know of no consumer product that is cheaper. This is determined partly by the intensity of use and by the high resale value (I assume 30% residual value after 2 years).
Do we really need a borderless OLED display in a smartphone? What about the face recognition technology?
Having no borders means you can get a screen that is bigger than the iPhone Plus in a phone the size of an iPhone. I think users will value getting more screen in a smaller phone. I certainly would. Having OLED means it can be curved a bit and also have nicer, truer black.
Face recognition saves time and is more secure. I don’t know another way of making the experience better for something that you do 30,000 times a year.
What do you think about the Apple Watch, which seems to be—finally—on the right track?
The Apple Watch has been on the same track for 2.5 years. I don’t see any change in that trajectory.
In my quoting of the "Cook Doctrine" I cited the primary criteria for Apple to enter a new market:
We believe that we need to own and control the primary technologies behind the products we make, and participate only in markets where we can make a significant contribution.
These criteria, often repeated, were certainly in force when Apple chose to enter the watch market. Apple has sought and achieved a significant market share and did so while owning and controlling the primary technologies behind the product.
I now turn to the significant contribution criterion to study the possibility of Apple's entry into the car industry. ((Control of the primary technologies behind the product is a topic for another post.))
The significance test shifts the speculation from whether Apple would build a car, to how many cars is could build. Making a few cars is easy (see first commandment of The Entrant's Guide to the Automotive Industry). Making lots of cars is hard and hence significance in the automotive market (as in watches and phones) means achieving some degree of adoption, a higher degree of usage and a very high degree of profitability.
So what does being significant in the car business mean? Does it mean becoming the next Tesla? The next BYD or the next VW? How quickly?
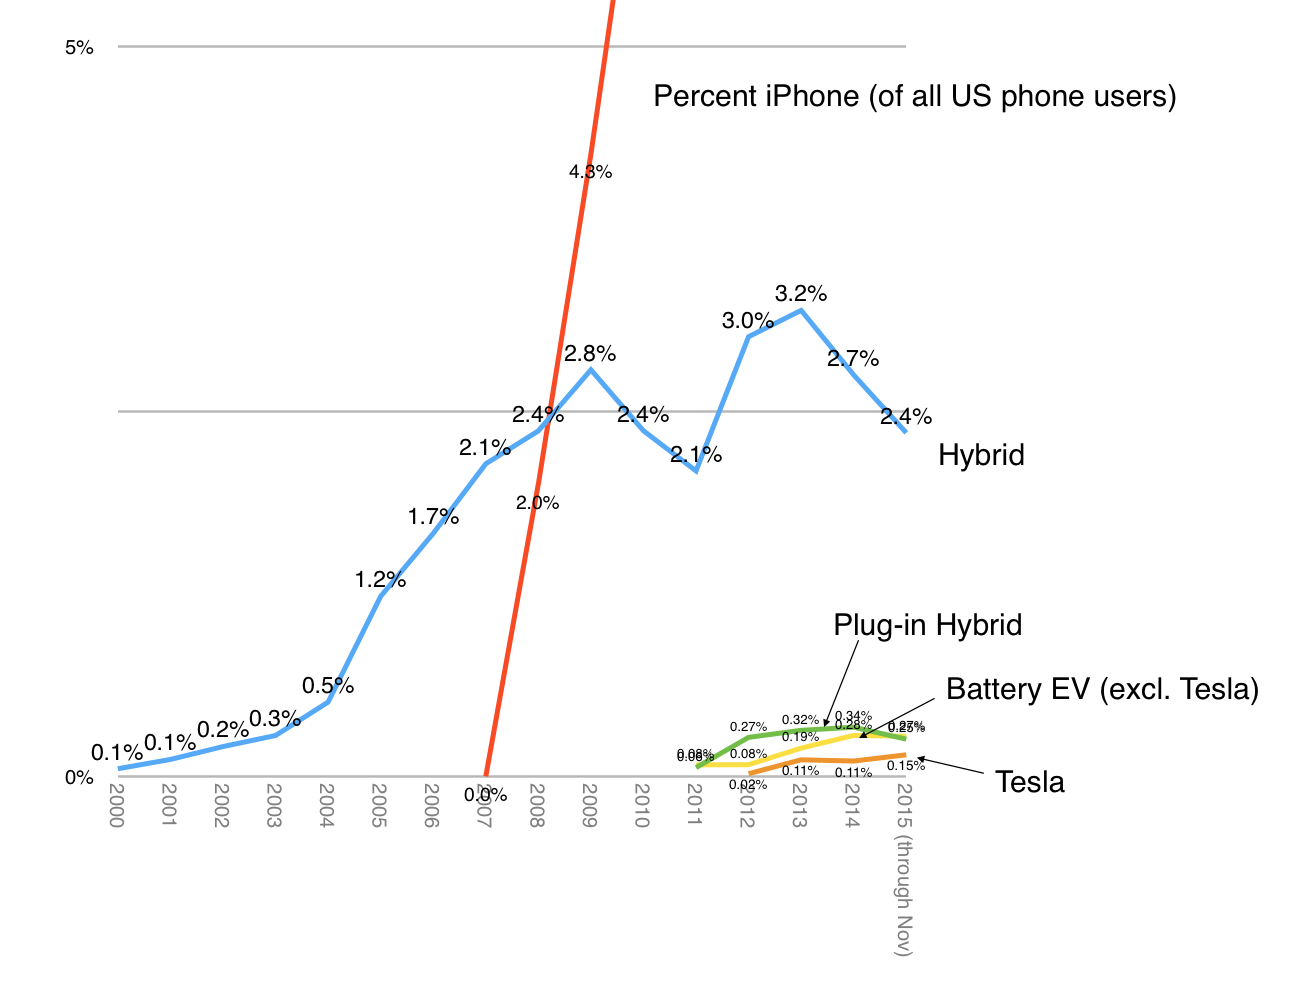
Fortunately, we have something to compare an Apple entry to. Apple has made a "significant" market entry in phones and others have made entries in cars. If we contrast the rate of growth of Tesla, EVs, and Hybrids ((Of which Toyota has 70% to 80% share)) to the rate of growth of iPhones in their respective US markets, we obtain a test of significance:
The graph shows the percent of sales for the alternative car technologies (and Tesla) vs. the percent of US phone users using iPhones (comScore). Here are the conclusions:
Hybrid cars were introduced in 2000 in the US. They managed to gain 2.5% within 8 years but have not increased to a consistently higher level since.
Electric vehicle sales re-sarted in earnest in 2008 and have gained 0.4% share in eight years. They are still growing, partly helped by significant federal and state subsidies.
Between sales start in 2008 and 2015 Tesla achieved 0.15% share.
The iPhone ushered in a new paradigm within the phone market ((Incidentally the number of phones in use and cars in use in the US is comparable.)) in mid 2007. In the time since, Apple achieved the equivalent of about 35% share of unit sales. ((Significantly more in terms of sales value and over 90% of profitability.))
Between 2002 and 2015 the share of smartphones as a percent of all phones reached over 80%.
To summarize, the range for entrant technology share capture spans between 0.4% (EVs between 2008 and 2015), 2.4% (Hybrids between 2000 and 2015) and 80% (Smartphones between 2002 and 2015).
Within a similar time frame, the range for entrant company share capture spanned between 0.15% (Tesla as percent of US car market) and 35% (Apple iPhone percent of US phone market). ((Toyota's capture of 2% of the market with hybrids may or may not be considered entrant--I chose to consider Toyota an incumbent which took share from others with the Prius))
The differences thus span two orders of magnitude (>100x). Put another way, if Tesla's car entry was equivalent to Apple's iPhone entry they would have delivered about 5.5 million cars rather than the 50.5k they delivered in 2015.
This wide gap in the impact of entry in the two markets has much to do with how modular are the systems being engaged by the entrants. An electric automotive system requires new infrastructure, new user behavior, and, in the case of Tesla, new distribution network and new post-sales support network. Offsetting this partially is a government subsidy.
In contrast, the smartphone communications and computing system leveraged existing infrastructure ((And vice-versa)), consistent behavior, at least initially, and the same distribution and support network. In addition, smartphones benefited from significant hardware and software and services ecosystems which encouraged third parties to add value to the system.
The difference in collaborative development and conforming user experiences (i.e. modularity) between the two innovations allowed the speed of change to be two orders of magnitude faster. The result is what I would consider significance for the iPhone vs. insignificance for electric vehicles to date.
Which leads us back to the question of why Apple would enter this market. If the absence of modularity prevents rapid change, that implies Apple cannot achieve any significant impact from entry.
We could ask the question differently: If they do enter, they could achieve significance only if they change the degree of modularity in the system. Think of it as allowing infrastructure leverage, consistent user behavior, wide distribution, wide support network, ecosystems, and component architecture; allowing rapid scale production and lower costs, etc.
Therefore the only way that Apple could justify entry would be if they "rationalized" the system into a sufficiently modular alternative. Only if we assume that change is possible could we then target share above the 0.1% insignificant change that has been demonstrated. They might even perhaps aim at 1% impact within a few years of entry. 1% was the iPhone target within the first full year of sales.
If system-wide change could be brought about and made uniquely (through some form of sustainable asymmetry) then the foreseeable share possibility quickly reaches the 10% range.
The last time that happened was when Toyota changed the way cars are designed and built. ((VW before Toyota and GM before VW. Incidentally Toyota, GM and VW are now nearly tied as the top three automakers globally.))
During the last quarterly earnings call, Tim Cook said that Apple has seen the highest switching rate from Android ever. That there is switching isn't surprising. We've seen many surveys which show higher loyalty with iOS than with Android. But it's been very hard to spot the evidence in the data which is visible publicly. Both iOS and Android are adding users and sales for both platforms are still increasing.
The switching effect is easier to discern when the market is not growing overall. In that situation one platform's growth has to be at the expense of another. However, some markets do show evidence of "churn" in users.
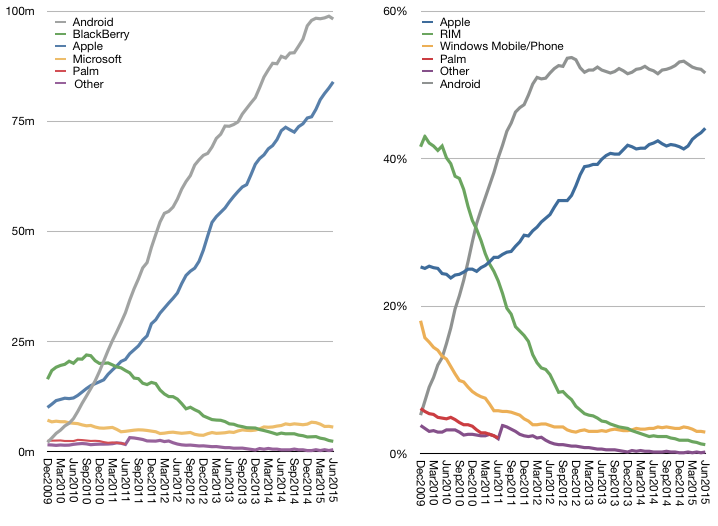
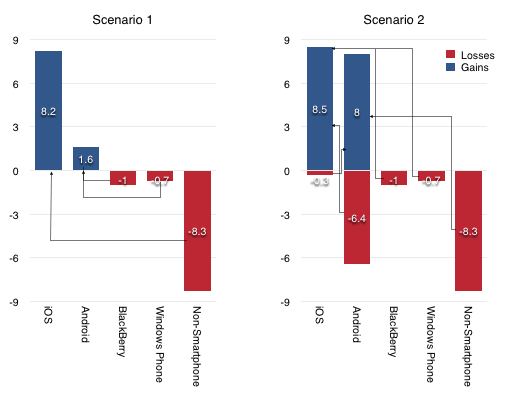
Consider the ComScore data on US platform users (above). If we look at the last six months' data ((these data are actually three month averages)) we can count that there are about 8.2 million more Americans using iPhones than there were six months ago. At the same time, there are 1.6 million Android users. One million users left the BlackBerry platform and about 700,000 left Windows Mobile. The data also suggests that the total number of first-time smartphone users is about 8.3 million.
Now, we could say that Android recruited all the Windows and BlackBerry users that switched (1.6 gained equivalent to 1.7 million lost) and Apple recruited all the new-to-smartphone users (8.2 million gained by Apple vs. 8.3 million non-consumers).
But this is not very plausible. It's much more likely that Apple converts existing smartphone users while Android converts first-time users.
In this scenario, 8 million non-users first started using Android while 1.7 million BlackBerry and Windows users switched to iPhone. But that leaves the question of what happened to the missing 6.3 million that Apple should have gained.
That's where the switching number comes into the picture. This Scenario 2 is shown in the figure above and suggests that although Android gained 8 million new users, it lost 6.4 million to iPhone for a net gain of 1.6.
Apple may have also lost a few users to Android but overall gained switchers from other platforms, mainly Android. This is what would support Tim Cook's comments.
Thinking further ahead, as the markets mature globally, they may well evolve into the way the US market evolves today. Apple's brand promise ensures loyalty while competing platforms slowly "leak" users. If this sounds eerily familiar then you'd be right. This is exactly how the PC market behaves today.
Will there come a time when Samsung will earn more profits from the iPhone franchise than from its own Galaxy product line?
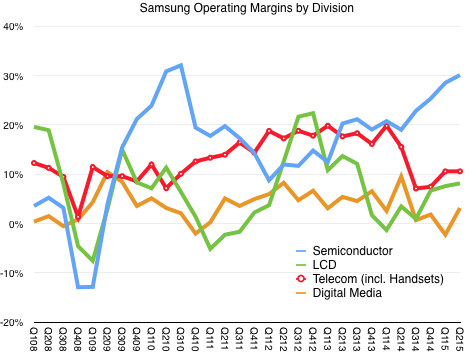
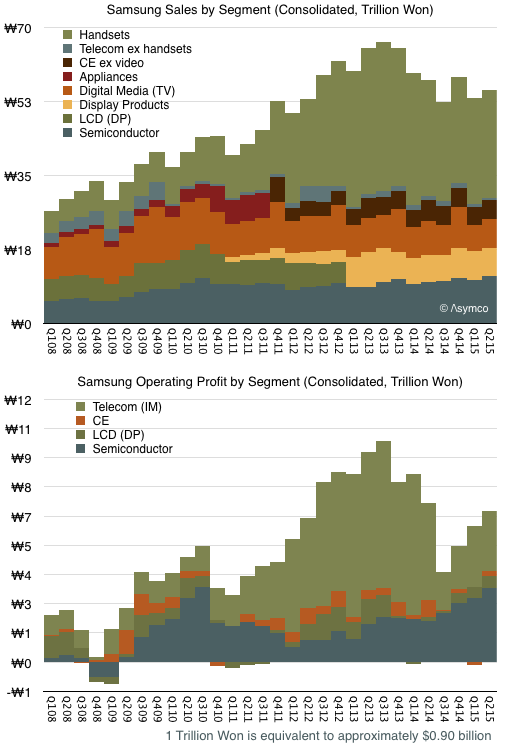
The problem for Samsung is that although it still sells the most phones ((over 80 million but we don't have a precise figure)), and the most smartphones, the price and margins for these products are collapsing. The pattern is shown in the graphs below:
Phone operating margins peaked in Q1 2014 at 20% but are half that level today. These margins have dropped to levels Samsung had in 2009, before the Galaxy launched and before they had any substantial revenues from smartphones.
In contrast, the semiconductor group is growing both revenues and margins. Margins and operating profits are both 50% higher than those of devices.
We also know that Apple is Samsung Semiconductor's single biggest customer. We can't be sure how much of the total revenue/profit comes from Apple but if the pattern continues then Apple could be the greatest contributor to Samsung's profitability in the near future.
How could this be? Wasn't Samsung supposed to "disrupt" Apple?
The reality is that Samsung's own smartphones are being disrupted by good-enough Android devices, typically made by Chinese brands. This low-end disruption is also affecting LG, another phone maker and Apple supplier.
Unlike Samsung and LG, Apple is less susceptible to low-end disruption. What Apple offers is a brand promise, an ecosystem, associated products and services and what amounts to a new market. It's this parallel value network that competes with Android/Google, rather than with Samsung.
Samsung is a supplier in the Apple network and a licensee in the Google network. As a result, it has a near monopoly position with a platform controller (Apple) and a commodity position with a platform licensor.
Neither position is one of control, but the current market stage benefits Samsung within the Apple ecosystem more than in Google's ecosystem. It's a situation analogous to one where Intel made both x86 chips and PCs that ran Windows. Long term it's likely that the sole-source chip business does a lot better than the multi-source systems business.
That should be a warning to others who hoped to survive as Android OEMs. They don't have semiconductors to sell to Apple.
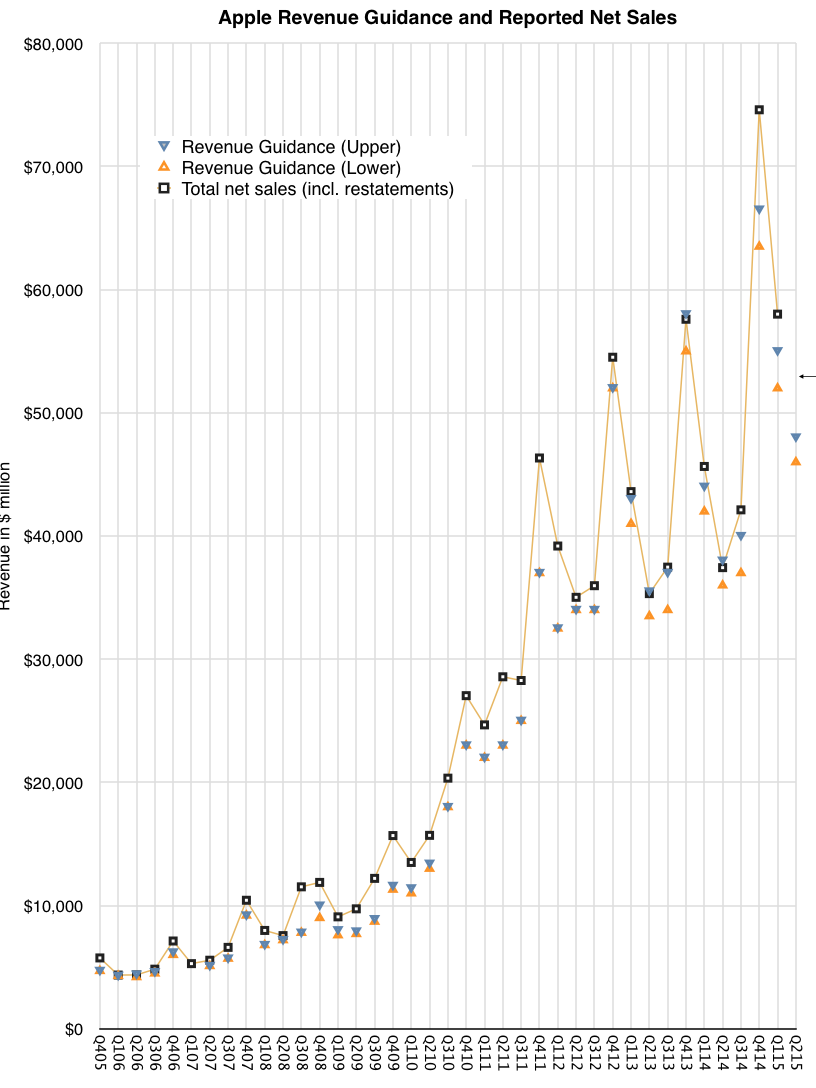
For the first time in many years I feel that there is some potential uncertainty in the results Apple will announce. After a period of excellent accuracy (shown in graph below), the company's guidance has begun to diverge dramatically from reality and the trend might continue this quarter. The cause might be unanticipated demand for the iPhone 6/6 Plus. The growth rate for the product was 46% in Q4 and 40% in Q1. This is unanticipated because growth rates have been below 20% for five quarters and below 50% for eight.
This slowing of growth was explainable given the rate of diffusion of smartphones in the global population. Within the US and some other early adopting economies the market is reaching late stages where most people have switched to smartphones. Globally we are at a more modest 30% or so but in many of the late adopting economies Apple does not have wide distribution.
Of course this thesis is thinly supported. There are many reasons to think that late adopters would still start with iPhone and that earlier adopters of Android would upgrade to iPhone after a few purchase cycles. Thus, the iPhone could prosper in later-adoption or even in post-saturation states of the market.
Indeed, in the post-saturation PC market, Apple is doing very well with the Mac and in the late to post-saturation MP3 player market the iPod did extremely well. This suggests that when it comes to value capture brand, experience and satisfaction trump function, price and share considerations in almost all consumer markets ((Enabled by design for jobs to be done. See non-technology markets for abundant evidence of this. ))
With so many assumptions put asunder the iPhone business suddenly looks downright lively. I adjusted my own growth assumptions and the resulting figures are shown below.
F3Q15
Daniel Tello
Horace Dediu
iPhone
Units
51.0
52.8
Price
626
645
Revenues
31925
34059
iPad
Units
10.0
10.6
Price
428
430
Revenues
4280
4567
Mac
Units
4.95
4.94
Price
1240
1240
Revenues
6136
6129
Services
Revenues
5006
5196
Other
Revenues
3902
3092
Total
Revenues
51249
53043
COGS
30577
31766
GM
40.3%
40.1%
OpEx
5733
5789
OpInc
14939
15488
OI&E
357
350
Pre-tax
15296
15838
Tax
4023
4165
NetInc
11273
11673
Shares
5779
5780
EPS
1.95
2.02
I include for comparison Daniel Tello's forecast as his work carries quite a bit of thoughtful analysis.
The upshot of this is that the company is poised to grow earnings per share at a rate of at least 50%!
That growth rate is astronomical, especially for what is already, by far, the world's biggest company by market capitalization.
This was not supposed to happen because of a so-called "law of large numbers." The "law" is actually a probability theorem which states that the average of experimental results should be close to the expected value given sufficiently large number of experiments. The way it's applied in market analysis (I assume) is that "no company can perform above market average performance for a sufficiently long time".
It implies that there can be no outliers and that all companies "revert to the mean because ..."
Actually, I don't have any idea why they might. The premise that all companies are the same must play into this but companies can only be alike if they have the same processes, priorities and resources. As long as I've been able to observe and as much as I've ever read on the subject I have never encountered any two which had anything in common.
And so the law of large numbers, as applied to market performance is a myth. It is easily disproved with a simple deconstruction into the causes of firm performance, but the empirical data from Apple alone shows how foolish it is to believe it.
In the fourth quarter of 2013, mobile phone sales in mature regions fell due to weaker demand."Mature markets face limited growth potentialis the markets are saturated with smartphone sales, leaving little room for growth with declining feature phone market and a longer replacement cycle," said Anshul Gupta, principal research analyst at Gartner. "Lack of compelling hardware innovation has further exacerbated replacement cycles for high-end smartphones in 2013 because consumers don't find enough reasons to upgrade." - Gartner
Anshul Gupta's assertion of market saturation was not the first. IDC also cited "a number of mature markets nearing smartphone saturation" in late 2013.
Shortchanging the smartphone market is nothing new. It was happening very early in the market's formation when initial growth was not as rapid as expected. I recall Nokia managers disappointed with sales growth losing faith in smartphones in 2004. Eleven years later, the market is still growing.
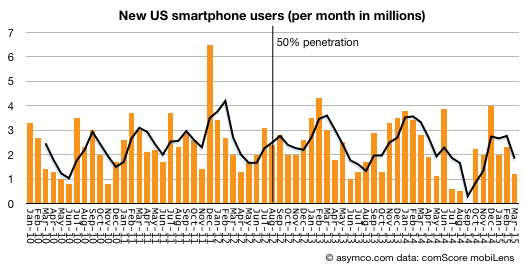
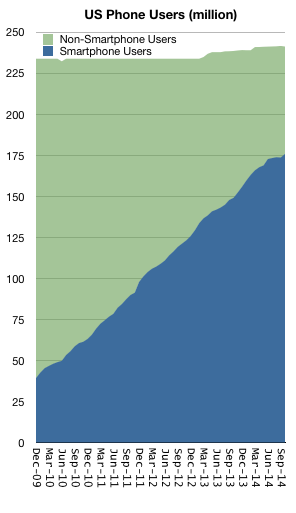
comScore reported that during the first quarter of 2015 the US market was adding over two million new smartphone users every month. These are not two million units sold every month but two million new users who began using smartphones for the first time ever, every month.
Since the end of 2013 when both IDC and Gartner declared the onset of saturation in "mature regions" ((The US is the most mature by penetration data)) 31.5 million new-to-smartphones Americans adopted the product. That's an addition of 11% of the sampled market.
And the sampled market is just a subset of the addressable market. comScore only counts 'primary phones' in use and excludes company-purchased devices and any users below age 13.
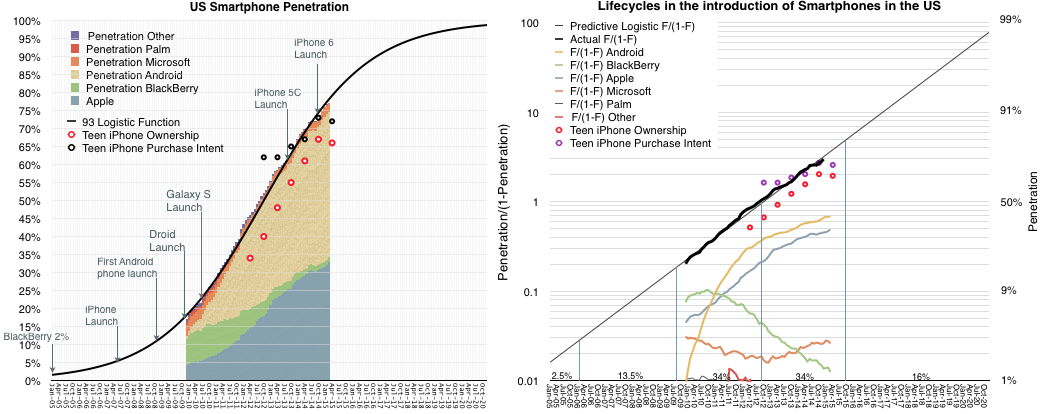
So according to comScore's data, the US market is at 77% smartphone usage. My assumption is that saturation would come at the earliest at 90% and could be 100%. ((Of the market comScore measures)) The fact that conversion to smartphones is still proceeding at roughly the same rate it has been for five years, makes this assumption pretty safe.
The pattern of growth fits a diffusion S curve (Logistic curve) as closely as ever:
Note that the curve continues to rise even into 2020, and that this is the US only.
The US is the most highly penetrated market but it's not the biggest. That would be China. So it's not surprising that two years after declaring US growth was over, IDC claims "China's smartphone market has reached saturation".
Chinese penetration is far below the US. It was estimated at 43% by the end of 2014. If we assume Chinese users are no less hungry for information than US consumers, then why should Chinese stop adopting the technology at less than half of US levels of use?
That would be risky.
This understanding of the maximum potential of a market — its highest level of user adoption — is crucial for product development. Paying attention to short term sales trends blinds you to the power of the job your product is hired to do. Your product's purpose is not to be sold, but to be hired. If your product is powerful enough, it can be hired for universal jobs and it should be desired by all consumers, not just the fickle.
Being patient for growth means that you can release features when the majority of users can absorb them, not just when early adopters choose to play with them. Often, early adopters offer feedback which is off-putting to later, mainstream adopters. In engineering and design one has to always make compromises. The right balance at the right time avoids overshooting a market or under-performing against competitors.
There are plenty of examples of getting it wrong (see the graph on the right above).
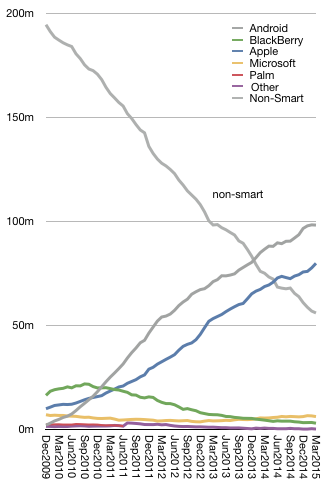
At this stage in the US market, the iPhone has more than 80 million (sampled) users. Android has about 100 million. It's still a growing market so apart from BlackBerry, ((Three million BlackBerry users in the US remain.)) the churn between the smartphone platforms is still minimal. The two main platforms are still harvesting non-consumers.
This will change of course. And when it does, the competition will shift from winning against non-consumption to winning against other-consumption or over-consumption. That post-saturation competition will be decided by brand loyalty as much as anything else.
---
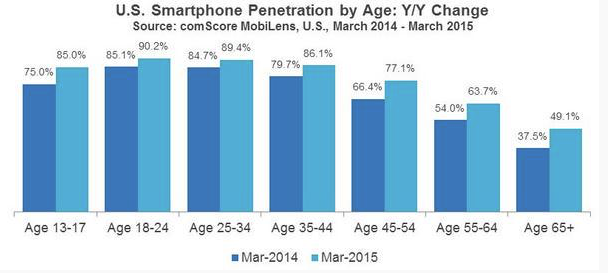
Update: comScore just published US Smartphone penetration by Age which offers some clues where smartphone hiring is still going on. (Note: <13 ages are not shown).
It won't be easy. The company will not be reporting the Watch segment revenues or (presumably) unit sales and therefore we won't have an accurate unadulterated view of the business. In addition, the large number of products in the mix and wide price variance means that it will be difficult for analysts to determine demand and price.
There is a hidden benefit to not having this data. All data is a creation and it tends to lead thinking in directions led by whatever is being measured (and whoever chose those measures and their motives). And yet without data there is no evidence and no credibility. In other words: You can't manage without measurement but you can't be sure what to measure.
The analyst is then faced with a requirement to have good taste or at least judgement about what to measure. This judgement is based on experience and good theory. Given that, what could we measure to determine whether the Apple Watch will be a success?
Here are some suggestions:
Language. Measure whether "Watch" will come to mean "Apple Watch". "Phone" has come to mean not only "smartphone" but also all mobile/cellular phones and not just things used for calling but things used for all manner of information. This is a great test because the theft of semantics can only be accomplished through a degree of ubiquity of influential mindshare. Incidentally, the brand may well have been designed to do just that. ((It leaves open the question as to what watches as currently defined will come to be known as.))
A measurable and significant reduction in the use of the iPhone. The Watch peels off uses from the iPhone and therefore the more it peels off, the less remains. However, that which remains will be more uniquely valuable to the incumbent. This is the process of carving and erosion that the PC experienced vs. mobile devices in general.
An increase in the mix of large-screen iPhones. As iPhones are removed from pockets more rarely, the larger version might be more comfortable to carry and more useful to use for the immersive tasks that are outside the scope of Watch.
An overall increase in iPhone sales beyond the foreseeable trajectory. This would suggest switchers from Android would be drawn to the platform purely for the value of the "accessory". Note that this is not inconsistent with the lower usage and higher spec mix measurements.
Apps uniquely targeting the Watch. It's hard to imagine how this will develop as it involves millions of creative minds, but as smartphones created new economic value through the solving of new jobs to be done, the Watch should do the same. As a side-effect it should lead to new empires (or at least Unicorns) being formed around Watch use.
Iteration. How quickly and deeply will the product be improved? Basic accessories like headphones and Apple TV have a leisurely update cycle. Smarter devices are faster. The cycle time of iteration should indicate how seriously Apple takes the platform and that itself should be fueled by positive consumer sentiment for the product.
These indicators are vague and the data will be weakly signaled but in many ways it will be more meaningful than any financial performance figures.
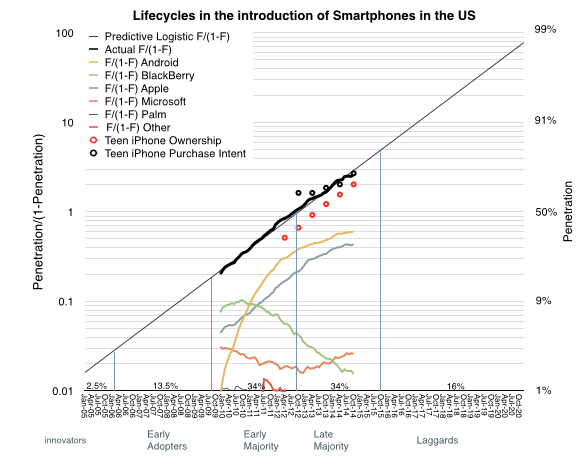
The adoption curve has been used to categorize adopters into groups by their behavior: innovators, early adopters, early majority, late majority and laggards. This categorization asserts that adoption is function of psychology, or the likelihood of people to act or react within social systems. [Rogers first edition 1962]
It's a compelling model and has been proposed as a tool for firms to help with their marketing strategy. As diffusion proceeds through each adopter category, the product is re-positioned to address each group's presumed behavior. Innovators (first 2.5% of the population) are offered novelty, a chance to experiment and uniqueness of experience; early adopters are offered a chance to create or enhance their position of social leadership; the early majority build imitate the leadership of the early adopters and justify it with productivity gains; the late majority are skeptics but, given a set of specific benefits, join the earlier adopters. Finally the laggards reluctantly agree to adopt as their preferred alternative of not adopting disappears.
The theory suggests that a firm can be successful if they modify their marketing and perhaps product mix to accommodate these adopter categories in a timely manner.
If this is the case however, why is it that those who have access to these data (i.e. who is buying and when) not to do the right thing? Why is it that during a technology adoption curve, there is a high degree of turnover in the firms which capture profits from the products that deliver this technology?
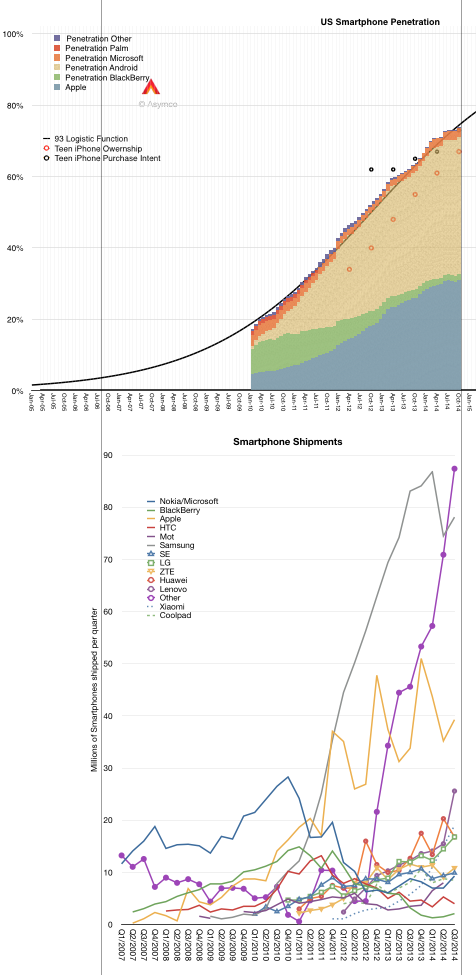
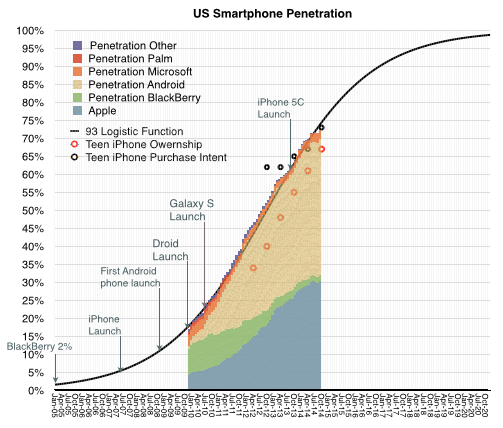
If you don't believe this to be the case, consider the smartphone market. The data about buyers is easily obtained (even without paying a fee). Shown below is the US smartphone penetration data as obtained by comScore (including teenage survey data from Piper Jaffray).
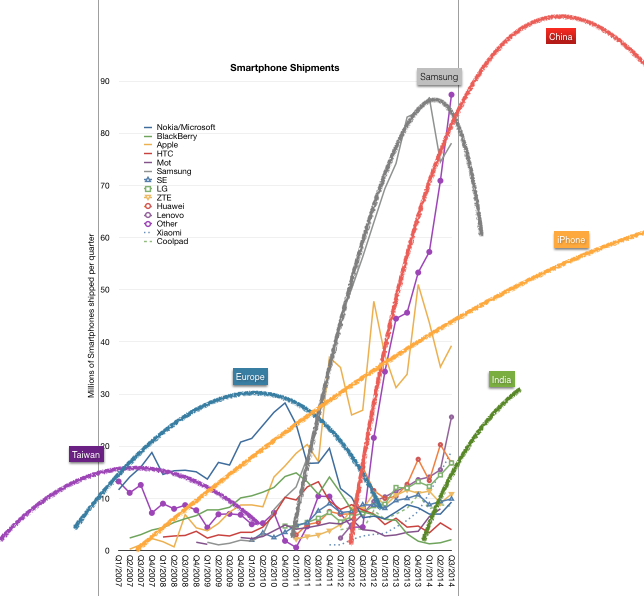
Following the penetration data there is a second graph showing the smartphone shipments for the largest vendors as well as the sum of the "others" which make up the difference with the total market. I used vertical registration lines to align the different data sets to the same time scale.
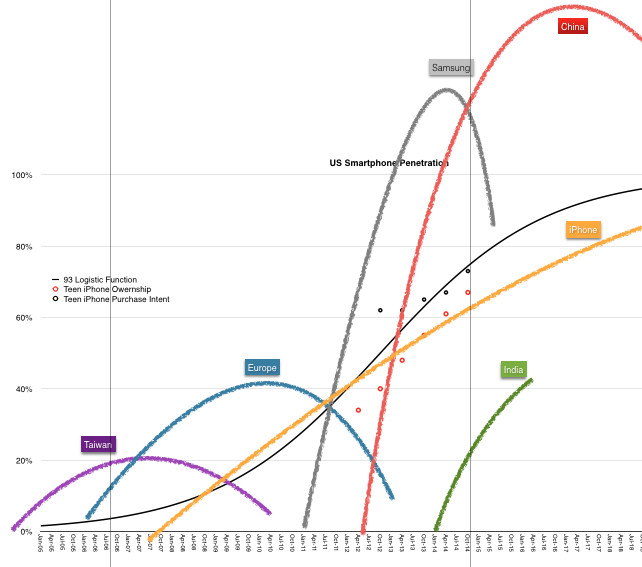
Having observed the market for some time, it's possible to see a set of "epochs" which show the rise and fall of various platforms/vendors/geographic production areas. I applied these "epochs" as a rough sketch over the production data.
I define these epochs as:
The Windows Mobile epoch from 2003 to about 2010 peaking in 2007. Competitors from Taiwan using Windows Mobile fielded a large number of devices and led that platform to win over proprietary Palm and Symbian.
The Nokia/RIM epoch from 2005 to about 2012 peaking in 2010. Nokia's distribution power takes its platform to global dominance. At the same time BlackBerry surges in popularity peaking at about the same time.
The Samsung epoch from 2010 to (probably) 2016 peaking in 2014. Samsung surges from almost no smartphone volumes to double the nearest competitor in a matter of three years.
The Chinese epoch from 2012 and ongoing. With a vast number of new competitors doubling or tripling sales over a few short years, "Other" becomes once again the bulk of volumes with additional brands like Lenovo, Huawei, ZTE, Xiaomi, Coolpad adding to the total.
The (probable) Indian epoch from 2014. This epoch is not so much of or about India as the "local brands" which begin to have large, even majority, market share in markets such as India, Indonesia, Philippines, Vietnam, etc. This epoch is the triumph of the local over the global and represents the latter stages of adoption.
Now I deliberately left out Apple because, as can be seen in the shipments data, Apple never held a pre-eminent volume position. It is however a competitor with a steady rate of growth. So steady in fact, that it seems to mirror the overall market. Essentially, Apple shows that there is a potential for growth without competitive flux. A type of growth that is "systemic" rather than a function of some rivalry and hence turnover.
But Apple is an exception. As so often it tends to be.
The real puzzle is why are there so many turnovers in leadership in such a short span of time. The idea that five distinct eras can exist in a mere decade seems preposterous. These turnovers are not without economic drama. They are booms as well as busts. They happen in a market where there are literally billions of consumers spending the equivalent of $300 billion/yr. so the stakes are pretty high.
But it's even more strange. If you super-impose the epochs on the (early) diffusion curve you can observe how a predictable adoption curve ((I.e. one whose shape can be determined well in advance and updated with very high precision)) results in unpredictable success in the market.
There must be something about the way companies behave *while* they are watching the evolution of the market. They seem to be running at a cycle time far faster than the market's overall absorption rate. Is this because competition is forcing them to mis-spend their energies?
Could it be that the behavior of firms is also a function of the psychology and reward systems of managers? That they seem compelled to optimize for a time frame shorter than the economic lifespan of the technology? That this mismatch of phase between lifespans of a technology market and their profit model leads to premature demise of their market position?
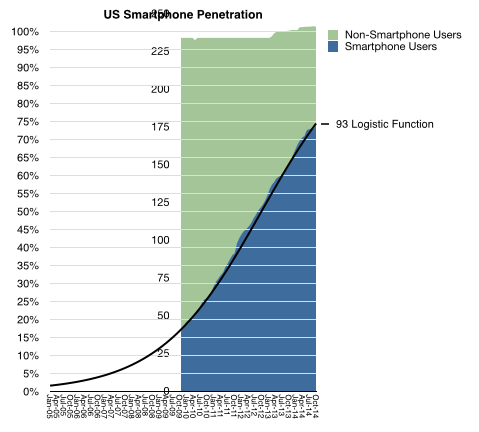
Remarkable as that may be, what is even more exciting is that the pattern of adoption is predictable. The following graph charts the adoption of this product category with a monthly resolution between January 2010 and October 2014.
Knowing the datum for March 2005 allows us to fill-in the graph with a logistic function approximation for the period to date.
The logistic function is a wonderful model for how technologies are adopted. It's been evident in samples take for dozens of diffusions, from 18th century canal construction, 19th century railroads, 20th century consumer products as well as industrial and agricultural innovations and the internet itself.
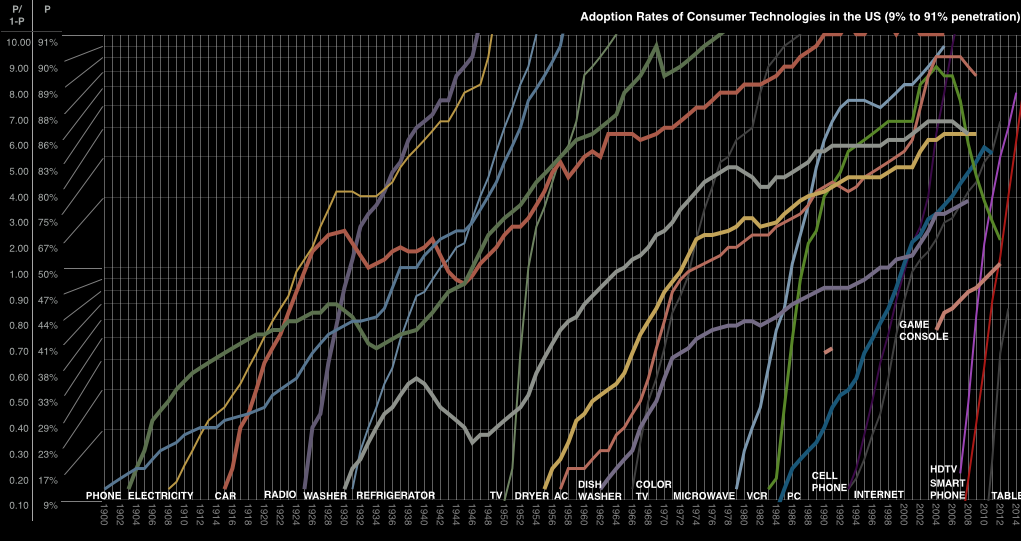
The reason the logistic curve is so commonly observed is because of its reflection of sociological behavior. When a technology serves a manifest need (or can be hired for a distinct, unmet job to be done) its universal adoption is a certainty. The only unknown is the rate at which this happens. As the graphs above show, some technologies are rapid (examples) and some are slow. Some could be constrained by the communication of its benefits or by the presence of regulation or by the unavailability of infrastructure or resources or financing. Conversely, some could be accelerated by conformability with existing infrastructure or by network effects resulting from communication between adopters. The balance between accelerants to adopting and the constraints on adoption yields the "slope" in the logistic curve.
So given a high degree of confidence in the model, we can forecast how smartphones will be adopted. This model yields further details such as when the various classes of adopter (Early/late/laggard) will join and perhaps that itself will allow managers to plan their marketing and product development.
It would seem therefore that this tool is the answer to building a successful and sustainable enterprise. It would seem that the early movers would have an advantage as their users create the virtuous cycle of learning which the firm will use to capture later adopters. It would seem that firms can effect strategy changes to adopt to each wave of users added to the user base.
It would seem but it has not proven to be the case. For most technology categories, the predictability of adoption has not aided or informed success for firms competing to supply the burgeoning market. If we look at the firms which supply the smartphone market in the US (with platforms as proxies) we see how much turnover has occurred. All the early movers are highly disadvantaged and even some of the later entrants are not assured of viability into the later stages of the market.
It's a something of a paradox that as a technology takes root we might be able to predict how it gets bought but not who will sell it.
This paradox is at the root of the volatility in asset pricing around technology firms. The question investors typically sweat is not whether a company is in the right market, but whether it's in the right time.