We expect revenue to be about $22 billion, compared to $13.5 billion in the March quarter last year. We expect gross margins to be about 38.5%, reflecting approximately $50 million related to stock-based compensation expense. We expect OpEx to be about $2.35 billion, including about $250 million related to stock-based compensation. We expect OI&E to be about $50 million, and we expect the tax rate to be about 25.5%. We are targeting EPS of about $4.90.
This is a particularly aggressive revenue growth forecast of 63% (note again that Apple's P/E has dropped to 18 and 14 ex cash and 10 on a forward basis) . Since Apple always guides very conservatively, the likely figures for the top and bottom lines are likely to be higher.
How much higher? Here are my estimates (growth in parentheses is year over year).
iPhone units: 18.4 million (110%)
Macs: 3.62 million (23%)
iPads: 6 million
iPods: 10.1 million (-7%)
Music (incl. app) rev. growth: 25%
Peripherals rev. growth: 23%
Software rev. growth: 23%
Total sales: $24.5 billion (82%)
GM: 38.8%
EPS: $5.89 (77%)
Looking a bit further ahead, earnings suggest the company is now trading at a forward P/E of about 9.5.
But in this forum I've been critical of their strategy. Though I'll be the first to admit that such criticism is not founded on data but on intuition, strategy is always made in a vacuum of data. It is just an unfortunate fact of life that we don't have data about the future.
But what data we do have is about the past and it shows the contrast between Apple and Google.
As a sample, let's look at the performance in the last quarter:
[nohang]
Growth
Google
Apple
Revenue
26%
70%
Earnings
29%
75%
P/E
24.13
18.57
[/nohang] Apple grew about 2.5x faster. The companies are in very different businesses, but the money they make is the same color. The investors have been paying attention:
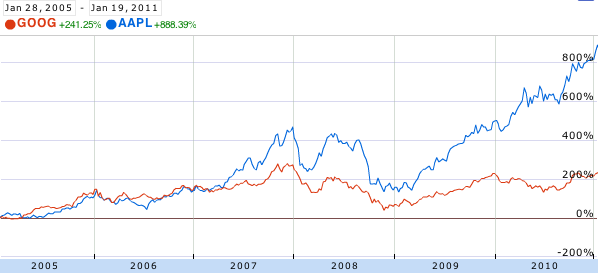
In 2005 and 2006, Apple and Google were neck-and-neck in terms of returns to shareholders. However, with the iPhone's arrival in 2007 the stocks diverged. Google gained 38% since January 2007 while Apple gained 300%.
However, going forward, the market is kinder to Google than to Apple, punishing Apple's 75% growth with a P/E of 18 (ex-cash 15) and rewarding Google's 29% growth with a P/E of 24 (22.5 ex-cash) . Although Google's P/E is proportionate relative to its growth, Apple's P/E implies deep pessimism.
But does Google's performance suggest management failure? Certainly not. It's been a great performance. Google is arguably at the top of its game. Market share of search has never been better.
Cracks in strategy are hard to spot. One hint is that most of Google's R&D efforts are defensive. Building browsers and mobile operating systems are methods to ensure they have distribution of search to as many screens as possible. These are expensive means to ensure channels are available for distribution. Expensive not only in terms of engineering costs but also in terms of relationships and opportunity costs.
But even a defensive posture is not sufficient for management change. What I think is the most serious failure is that for the past five years Google has not addressed the possibility of search itself becoming commoditized. Social media and app economies are asymmetric to search. They make money in different ways and appear to be less efficient or effective means to reach users, but they are growing. Facebook has overtaken Google in terms of page views and apps are a new interaction model for cloud-based content that does away with the indexing model Google champions.
The real condemnation of the leadership at Google is that there has been a failure to create entirely new disruptions. As the stock chart above confirms, Android and Chrome are, if successful, sustaining technologies for Google. That's not going to be enough.
In a recent but recurring lament I asked why Apple shareholders are not being rewarded for the company's growth. I pointed out that there is no fundamental reason why the company should receive such a low P/E multiple (about 18 ex-cash trailing and 10x forward while maintaining 70% earnings growth for over a year).
There were many objections in the comments. Most of them dealt with recent reasons why doubts might have arisen among investors: Android hegemony or some perceived lack of competitiveness leading to margin compression or some macro hangover from the recession.
In this article I argue that none of these objections hold water. My argument hinges on the fact that there is a precise date when Apple ceased being seen as an exceptionally valuable company and that date precedes any of the causes being suggested.
The day of disillusionment was almost exactly three years ago: January 14th, 2008.
How to pin down the date of disillusionment
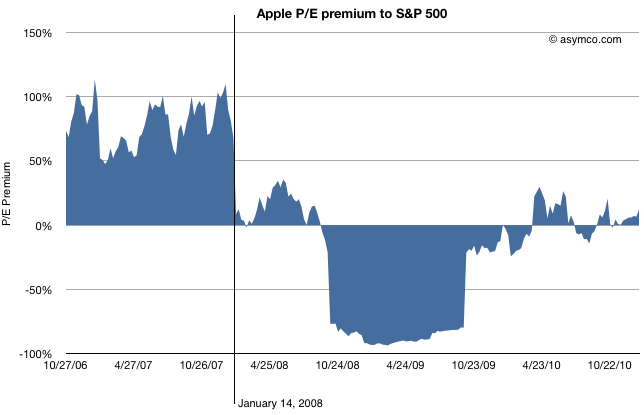
Consider the following chart.
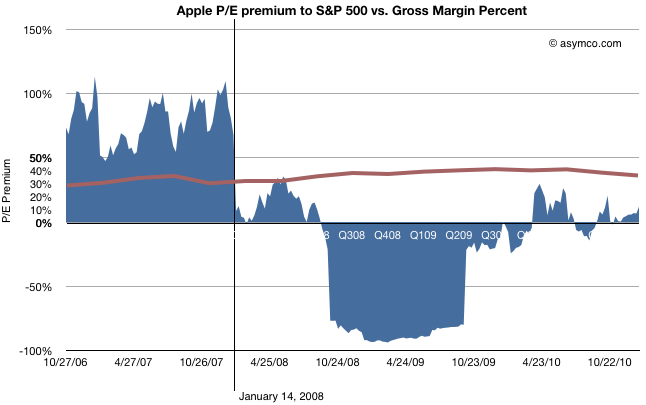
The blue area represents either a premium (above 0) or a deficit (below 0) of Apple's P/E (ex-cash) relative to the S&P 500 P/E. This is a re-imaging of a chart, first introduced in June 2010 when I first pointed out that Apple was being discounted relative to the S&P 500.
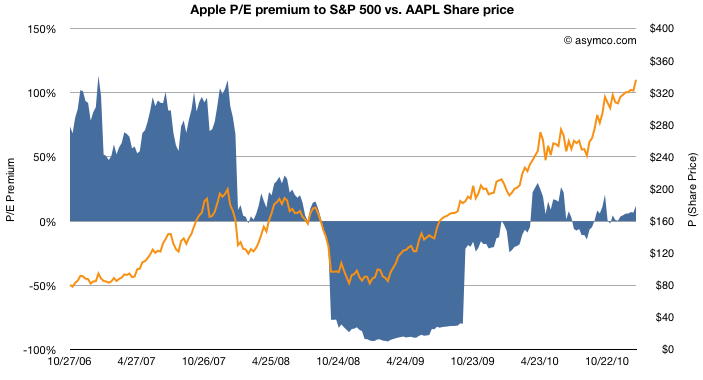
By measuring P/E I am focusing not on the stock price, which has grown nicely, but the ratio of the price relative to earnings, which hasn't (see the next chart below). P/E is a fundamental measure of potential (its reciprocal is the stock's earnings yield.) It is usually highly correlated to the company's growth. If that P/E is uncorrelated to past growth, there is some significant discounting of future growth. It's the most significant (and simplest) measure of "faith" in a company.
By measuring the company's P/E relative to an index of other large companies (S&P 500 P/E) we can assess whether the company's potential is being valued as extraordinary or whether it's being valued as ordinary. In other words we are measuring whether a company is "special".
The chart shows that until January 14th, 2008 the company was valued at a significant earnings premium--a P/E consistently 50% higher than the norm.[1]
Following the collapse (about 40% drop in share price but 100% drop in P/E premium), there was a small recovery followed by a huge trough in valuation. During the recession quarters Q308 to Q309 S&P earnings fell to zero or below. As a result of S&P earnings collapse the S&P P/E shot up astronomically (as E approaches zero, P/E approaches infinity). Apple's earnings dropped as well but remained positive throughout that period bottoming at 37% growth(!) in Q408. As a consequence Apple's P/E fell as low as 11 while the market's went well above 100 (122.41 peak). The P/E deficit for Apple went 80%: Apple was valued as basically worthless (3x cash).
After the earnings recession, the S&P P/E recovered close to historic levels but Apple's P/E did not. It's in-line with the S&P but does not obtain the 50% premium preceding the recession.
So we can establish that the day that Apple's potential was discounted was nearly six months before the onset of recession.
What other discounting factors can we discard?
How about earnings growth itself? Did the collapse foretell an earnings collapse?
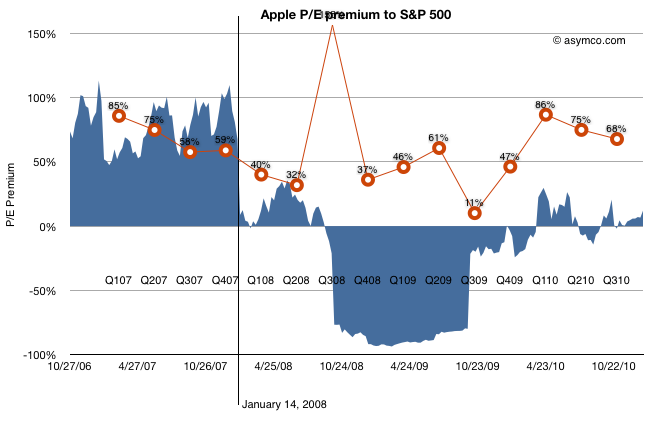
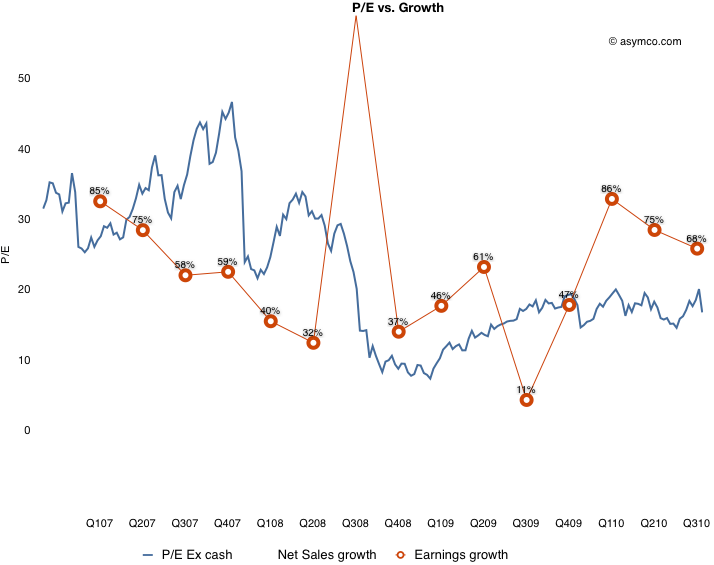
The chart above shows the P/E premium vs. earnings growth (in red). Although earnings growth began to slow soon after the 14th (earnings for CQ407 were not yet announced at that point), growth recovered six months later after the launch of the iPhone 3G[2]. Growth continued throughout 2009 and 2010 reaching new heights last year of 86%.
Still, the company received no premium to the S&P 500 P/E. Companies in the index averaged, at best, a quarter of Apple's growth in earnings.
What about Android? The first Android device did not ship until October 2008 (HTC Dream or T-Mobile G1). There were no appreciable Android volumes until 2009, one year after the drop in relative value and no talk of a threat until 18 months later.
The last objection to be put aside is that of margin compression.
This last chart shows how margins (in brown) behaved during the same time period. They went up. The only slight decline took place during the last few quarters, after the launch of the iPad, long after the collapse.
Regardless of the adjustments with product launches, Apple's GM is the envy of the world and is not at all correlated with the loss of faith in the company.
So What happened on January 14, 2008?
Having led you this far in the story, I'm afraid I'm going to let you down at the end: The cause for the loss of faith is a mystery to me.
There is only one noteworthy event that took place on that date: Macworld 2008 (January 14-18). During the keynote, Steve Jobs introduced the Macbook Air (and Time Capsule and Leopard and pre-announced the iPhone SDK which, six months later led to the app supernova). I remember that day and I remember that the stock began selling off exactly at the point when the Air was mentioned. It has never been the same since.
Obviously, correlation is not causation. The Macbook Air need not be the cause for the loss of faith in Apple as an investment. Or can it? I'm hoping someone can explain this because to me it makes no sense. The product was not a home run but it did not do badly either and its current incarnation seems to be a hit. Whatever sins the original Air may have had have surely been expurgated by now.
Regardless the cause, the bottom line is that, in the eyes of investors, Apple stopped being "special" that day. Its valuation dropped to in-line the S&P and, given its growth, well below what a large growth company should be worth. The company's shares went into the bargain bin and are still there today.
---
[1] I should point out that the P/E ratio is based on post 2009 re-stated earnings. The restatement changed the P/E as the "E" changed. This was based on the abolition of subscription accounting for the iPhone. Although it may seem unfair to hold the market to this standard, restatement did not actually change cash flows which were transparent and visible to all, even to amateurs such as myself and the other unaffiliated analysts that published throughout this period. Earnings may be an opinion but cash flow is a fact. Valuation on the basis of cash flow should have yielded the same results as shown above.
[2] That quarter showed a y/y growth of 150% while the stock was in freefall. In fact, it was during that earnings day that Steve Jobs came on the conference call and pointed out the astronomic iPhone cash flow to an audience of analysts more concerned about their own jobs.
[Goldman Sachs analyst Bill] Shope also expects both iPad and iPhone sales to exceed expectations in 2011; he sees sales of 37.2 million iPads next year, “which could potentially make Apple one of the largest vendors in the global personal computing market,” if you include both tablets and PCs.
Apparently, it's not just the crazy ones who dare to think the iPad is computer.
My forecast for iPad in calendar 2011 was set at about 33 million since last summer. I may raise it if Q4 units top 6 million.
Meanwhile...
He re-launched coverage of the stock for Goldman this morning, setting a Buy rating and $430 price target, while placing the stock on the firms “America's Conviction List.”
I don't make stock price forecasts as they are based on a random number called 'sentiment'. But by forecasting earnings and assuming a range of P/E multiples between 15 and 20 (essentially in-line or below the S&P 500) values Apple's stock at between $360 and $480 by this time next year.
Goldman's target of $430 is about in the middle of this range so I don't see it as requiring much in the way of conviction.
In the previous article discussing the growth scorecard, I left open the question of how Apple's growth is reflected in its share price.
The approach to answering this question is to show how the share price correlates to that growth. The challenge for analysts has been that the company switched from subscription to current accounting for the iPhone (the largest component in its income statement). As they re-stated income and thus earnings, any historic review of P/E or other multiples of Earnings have to also be re-computed.
So this is what I've done:
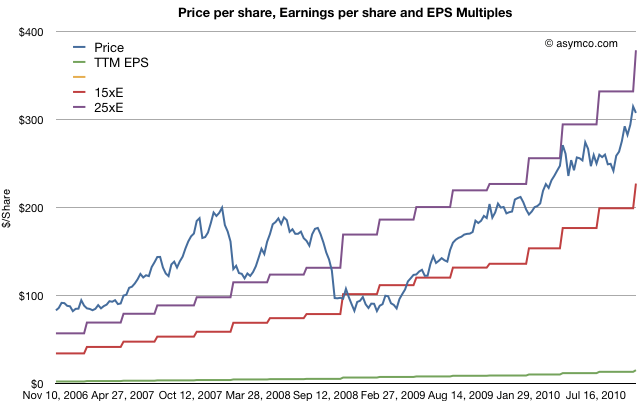
The first chart shows Apple's price per share (blue) vs. its trailing twelve months earnings (green) and multiples of those earnings (15x and 25x).
The chart shows how Apple was priced well above 25 P/E before October 2008 and has remained within the 15 to 25 multiple bands since the winter of 2008/2009. This seems fairly reasonable and the stock's rise is a cause of celebration for many, but a cause for concern for some. Is this rise in price matching a rise in value?
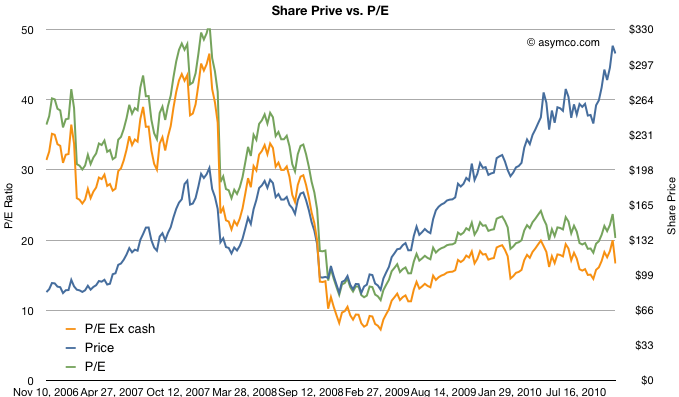
To answer, we need a way to look at the valuation of Apple. One way is to plot the P/E ratio over time. That would show how the market perceives the value of the company (i.e. how many years' worth of earnings is built into the price) The chart below does that.
I took the additional steps of plotting the P/E excluding cash from the price to show "P/E Ex cash" in the orange colored line and I also copied the Share price line from the first chart on this one for contrast.
What the P/E analysis shows is that as the stock rose, it's P/E ratio fell. This means that the "valuation" of the company is quite a bit lower now than it was in 2006 and 2007. In fact, as a multiple of profitability, Apple's stock is nearly half as valuable now as before the recession.
Since valuation is usually correlated with growth, (P/E is often compared in a ratio with Growth) we need to see whether the P/E in the chart above matches the actual growth of earnings. Fortunately we have just measured growth with the scorecard. Here are the two charts together:
What this shows is that while earnings growth did slow down in the lead-up to recession (with the hugely anomalous 3G launch spiking growth to 155% in Q308 causing the year-later plunge to 11%), growth picked up again in the depths of recession and has moved back to pre-recession levels. The only difference is that the multiple assigned to the stock has remained near recession lows. This is visualized by the blue line being mostly above the red line pre-crash and usually under it post-crash.
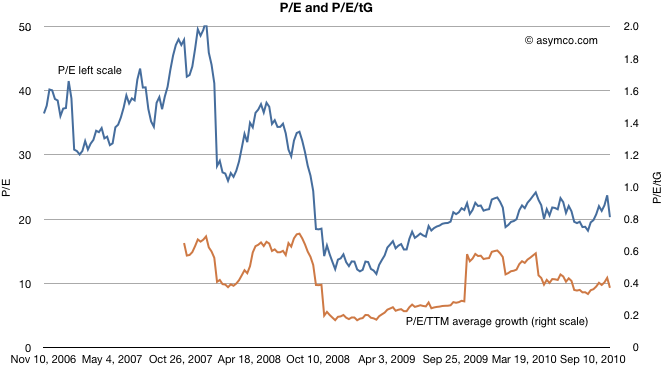
To put a finer point on this, I plot the ratio of P/E and trailing growth (P/E/tG) in the brown line below:
It shows that as a measure of valuation with respect to growth, Apple is trending down. A P/E/tG ratio of 0.4 and closer to 0.2 if we exclude cash shows very weak confidence.
The only conclusion I can draw is that the market does not believe that Apple has significant growth opportunities. A P/E of 20 with consistent 70% growth is, to be blunt, damnation. For comparison, Amazon just reported 16% growth in earnings and was rewarded with a P/E of 68.
Amazon notwithstanding, is Apple an anomaly? Is the disconnect between earnings growth and the stock price unique to Apple or does it apply to most other equities? Is pessimism about Apple a symptom of pessimism in general? I will suggest a way to answer this in a future article.
Apple's stock price has been rising. Although it's still priced at a P/E of 22 while facing near term EPS growth well above 50%, this is belated recognition of the potential of the iPad and the iPhone.
However, as it has grown, Apple's valuation is now not only higher than any other technology company but it's nearly the most valuable company on the planet. There is a theory that ultra-large market caps are reserved for companies that are past their prime. Sometimes this is attributed to the law of large numbers: that conclusion that big numbers cannot grow much bigger because compounding growth is exponential whereas markets are limited and become quickly saturated.
The trouble with this theory is that "large" is relative; large is often simply "the largest". Large market caps are not what they used to be. During past booms, large caps touched a trillion dollars. Today, the largest market cap is merely $314 billion.
So I don't put much faith in large number "laws". The real question of under/over-valuation rests on whether the company is growing or not. Valuation is simply the net present value of future free cash flows (plus assets). So the most important determinant of current value is growth in cash flows.
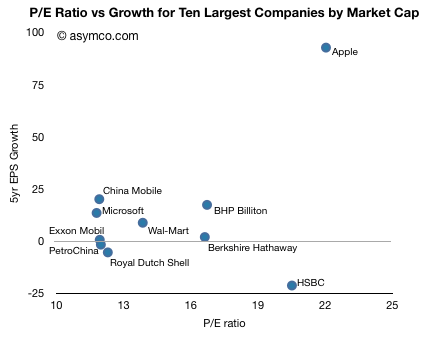
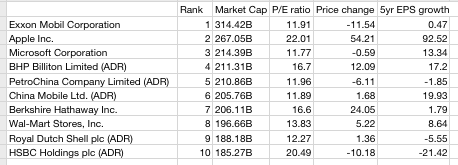
It's fairly easy to assess this: compare P/E which is a proxy for valuation with EPS growth. The following chart does this for the top ten largest market caps traded on US exchanges (as listed by finance.google.com).
One should see some correlation between the two variables, but given the 5 year time frame, many of these companies showed large volatility. There are outliers like HSBC which has a rapidly rising value even though it was badly affected by the credit crunch.
The other outlier is Apple. The company showed 93 percent EPS growth over a five year period and has a P/E of 22. The company with the next highest total value (Exxon Mobil) had 0.5% growth with a P/E of 12. The company with the next lowest total value (Microsoft) had 13.3 percent growth with a P/E of 12.
For an ultra-large cap, Apple's growth is unprecedented and extraordinary. It's in fact off the scale. The average growth of the other 9 top caps is 3.6 percent!
Apple's growth is a factor of 25x higher. The P/E is only 1.6x higher.
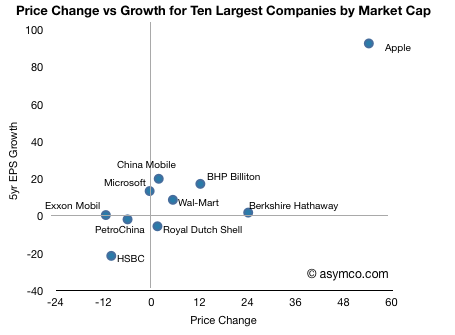
The result has been a much higher appreciation in the stock price as shown in the following chart.
So it's clear that Apple, in this peer group, is far from ordinary.
As previously described in an earlier piece on the transistor, there is a theory that underlies much of what this web diary is about. Telecommunications is undergoing wrenching change. And not for the first time. The history of the industry is filled with disruption and thus with drama that leads to fine storytelling.
One such great story is that of Western Union and the telegraph.
Western Union was formed as a company in 1851 and ten years later had completed the first transcontinental telegraph line. Following on that breakthrough, it introduced the first digital real-time data service, the stock ticker, in 1866. Business boomed and by 1870 it was the world's most powerful telecommunications company.
By any standards it was innovative: it offered remarkable and revolutionary telecom data services, a century before the Internet. But in the century that followed why didn't Western Union become the leader in voice communications, ceding that position to the Bell companies?
Alexader Graham Bell did not invent the voice telephone with the intention of toppling Western Union. In the language of today's technology entrepreneurship he hoped Western Union would be his "exit". He pitched the phone to them as an improvement to their core telegraphy business. Bell offered the patents for the telephone to Western Union for a mere $100,000, roughly $2 million in today's dollars. In other words, today the deal would be: two million dollars to own all voice IP.
Western Union passed
Now why would they do that? Imagine you are an analyst at Western Union advising management on technology acquisition and M&A. What process would you use to evaluate it? First, most obviously, you would try to get feedback from marketing and sales. They should go out and survey their customer base to find out who would be interested and how much they would be willing to pay.
The sales force would naturally seek out their best customers and ask them first. Those customers were the stock ticker users. They were extremely voracious users of the ticker tape system. It should be no surprise why we have "ticker tape parades"--there was enough of the stuff lying around offices in New York to shower down and flood Broadway end-to-end". Ticker tape was a boon to merchants and traders. Chicago would know what's happening in the New York stock exchange instantaneously. Price data was traveling at the speed of light. The sender and receiver were in lock-step sync. To suggest to these customers a voice product would sound like a step backward. Why would they want to talk to the other party? The data was coming on tape and it was also recorded for posterity. Speaking with the other person meant confusion and delay and a mess of record keeping.
The word from the customers would be a resounding negative.
Second would be the business model. How would you charge for voice? Data was subscription based, and the fees were huge. Voice would be metered and the price low. If targeting consumers, telegrams were priced by the word, but you couldn't price voice by the word. Marketing would stare back at you as if you had committed a judgement error.
Thirdly you would look at the cost side. Operations would give you more bad news. Voice technology was different enough that it needed new infrastructure. Switchboards, operators, handsets and new power and insulator requirements were all expensive and had no clear return. Voice was a loser all around.
So the decision was perfectly reasonable, smart even.
This is not to suggest that Western Union did not accept any new technology or invest in it. For decades after the phone, Western Union continued to invest in innovation: It introduced an electronic payment system (called money transfer) in 1871. In 1914 it offered the first charge card and in 1923 it introduced teletypewriters. Singing telegrams followed in 1933 and fax service in 1935. Intercity wireless microwave communications were introduced in 1943. Telex came in 1958 and the product of marketing genius, the 'Candygram' in the 1960s. By 1964 its network was all wireless using a transcontinental microwave system. Western Union became the first American telecommunications corporation to maintain its own fleet of geosynchronous communication satellites, starting in 1974. The fleet of satellites, called Westar, carried communications within the Western Union company for telegram and mailgram message data to Western Union bureaus nationwide.
And it wasn't lacking in talent either. Western Union had the best telecom managers in the business and was raking in profits to fund expansion. It attracted the best and brightest engineers for generations. Western Union probably passed on hundreds of other inventions and ideas, and rightly so.
So what happened to WU?
It's still around. However, due to declining profits and mounting debts, Western Union slowly began to divest itself of telecommunications-based assets starting in the early 1980s. Due to deregulation in the US, Western Union began sending money outside the country, re-inventing itself as "The fastest way to send money worldwide". In 1987, an individual investor acquired control of Western Union through an outside of chapter 11 process that was a complex leveraged recapitalization. After several other changes in ownerships and moves through bankruptcy, WU is now a public company with an enterprise value of about $12 billion based entirely on international money transfer business.
3G as a disruptive technology
Today we've come around full circle. Whereas voice was disruptive to a data network provider in the 20th century, data is disruptive to a voice network provider in the 21st. The mis-application of 3G network technology to sustain voice-oriented business models gives one a strong sense of déjà vu.
The telecom world moved swiftly to 1G and 2G cellular voice. Each new generation of mobile telecom was sustaining the core business model of subscriptions feeding centrally managed networks and symbiotic device vendors benefiting from handset and switching system upgrades. Standardization, international expansion, lower price points and network effects made this industry the most ubiquitous technology distributor the world had ever seen.
3G however was different. It was effectively mobile broadband data. It enabled data services to be de-coupled from the network operators. IP protocols did not require the servers to be located on operator premises or even to be managed or monitored by them. Devices could be general purpose computers not specific purpose communicators. Incumbents did not adapt to this well. They continued to build business plans according to a central-switch blueprint.
So although incumbents did not reject the smartphone as a technology, they tried to make it sustaining when plainly it isn't. They essentially tried to cram it into their business models.
The struggle to keep the service structure of telecom centered around the network operator will continue, but short of pulling the plug on 3G and LTE, there is little that the incumbents can do to stop it.
So what's the lesson?
Some technologies are embraced and some are rejected. You can't fault every rejection and you can't praise every acceptance. The most likely reason for embracing something is that it helps grow your existing business. The most likely reason for rejection is that it may harm your business. Even acceptance sometimes leads to mis-application in sustaining the core rather than planning for its demise.
The decision on how to handle something new and potentially disruptive requires a different sense of what's right and wrong about it.
--
Photo: Former headquarters of WU, located at 60 Hudson, New York.
“The N8 is certainly a step in the right direction, it’s much more multimedia,” Per Lindberg, an independent technology analyst at MF Global in London, told Marayam Nemazee on Bloomberg Television’s “Countdown.” “But whether it will move Nokia’s market share upwards is more debatable,” he said adding that Android phones are becoming an “formidable force.”
This is the same Per Lindberg who, in January of this year, reiterated his February 2009 Sell rating on Apple and the entire smartphone industry:
"There is no doubt, in my mind, that the whole sector is hugely overstretched," says the London-based physics PhD and MBA graduate who joined MF Global Ltd. in 2008 after 10 years at investment bank Dresdner Kleinwort.
"The whole sector is priced as if the average player would sustain 25 per cent margin in eternity," he adds.
"It's bordering on absurdity. This will end in tears."
He is willing to use the b-word: "Many stock bubbles are generated by sell-side analysts generating enthusiasm for the companies they cover."
To date however, it's Mr. Lindberg's call that's been the costly one for investors. He has maintained his sell rating on Apple since early February of last year, causing investors who followed his advice to miss out on a more than 110-per-cent surge in the share price.
Flush with $45 billion in cash and investments ($50 per share) and no debt, Apple sports an enterprise value of about $190 per share. Compare that to $15 of earnings this year and enough catalysts to make next year’s estimate of $18 seem easily attainable, and you have a stock that actually trades at a discount to the S&P 500.
Global markets trading in lock-step. In an apparent blindness to any local differences, markets from emerging economies to Japan and to London trade in perfect correlation.
Crude oil and other commodities are mis-priced due to HFT or algorithmic trading which ignores underlying supply and demand fundamentals.
Value investors find that there is lack of dispersion among stocks.
Component stocks' correlation to the S&P 500 is at highest level since '87 crash, reaching a high of 83% vs. average of 44% since 1980.
ETFs (exchange traded funds) maintain (or freeze) over- and under-valuations.
Structural changes such as the proliferation of exchange-traded funds and super-rapid computer-based bloc trading, activities that are totally unconcerned with valuation metrics and/or long-term trends, are still taking place and there is little or no prospect of this development coming to an early end.
Adam Smith’s invisible hand has for the time being, been handcuffed.
It means you can’t trust any valuation. I could have valued a subprime CDO better on May 6 than any equity. And it’s almost the same thing all day long. Valuations and prices have been divorced for a while. Just look at the volatility. It’s not like traditional trading. No wonder there are such increased correlations.
What this has to do with mobile computing? Interestingly, I find that Apple is not just a victim of this de-coupling of fundamentals from valuation. I hold out hope that the stark facts of its performance might actually pop this correlation bubble. The hope comes from the fact that trading strategies have finite lives. As soon as a strategy develops to a point of being widely used, it makes sense for a contrarian to "short" or bet on the reverse of that trend, taking advantage of the tendency to overshoot. I don't have a strong handle on this phenomenon, but the chances are that value/fundamental investment will be back with a vengeance and Apple might just be the leader, by sheer weight of numbers.
Apple just reached a new all-time closing high. It's remarkable that so soon after a recession the stock is enjoying new highs. The Dow would have to gain 40% to make the same claim.
So some may ask whether Apple's stock is getting ahead of itself. Perhaps it's showing signs of "irrational exuberance".
This is not the case. In fact, the stock is showing signs of irrational despondency. This is demonstrated with the following graph.
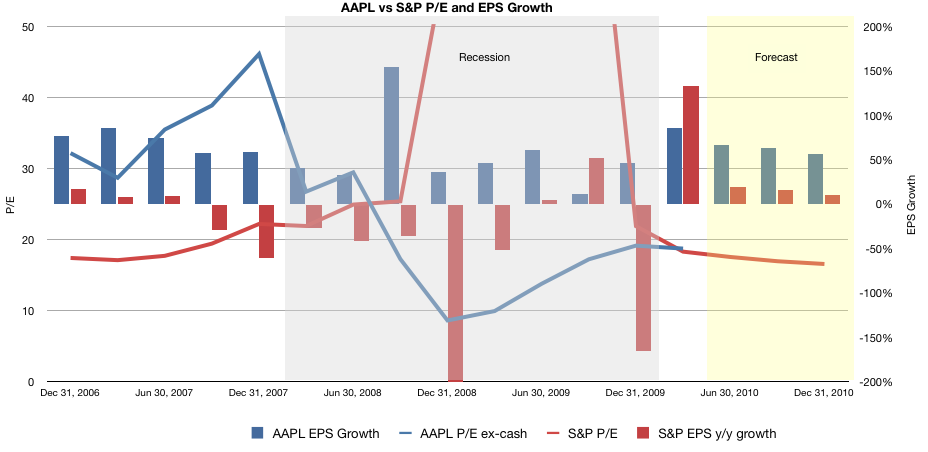
It shows AAPL Price (ex-cash) over Earnings vs. S&P P/E (blue and red lines respectively on the left scale) overlaid with AAPL and S&P EPS growth (blue and red bars respectively on the right scale). I added grey shading to represent the recession period and yellow shading for the forecast period.
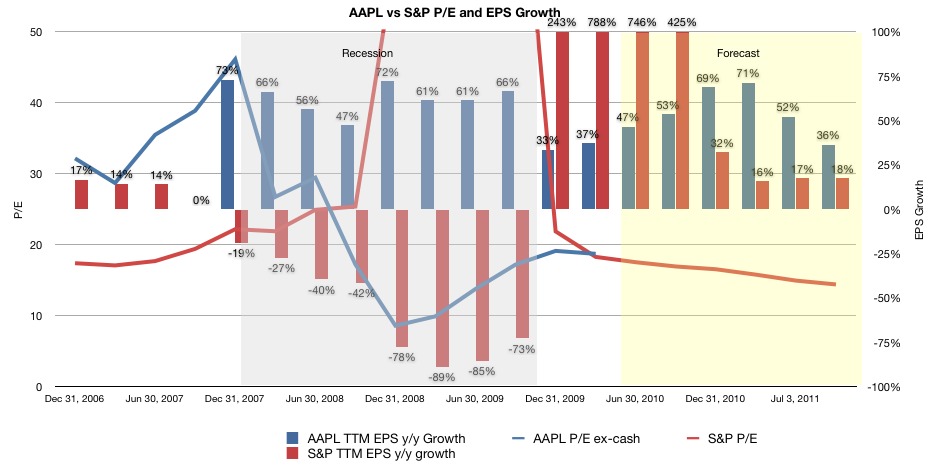
[Updated] The same data is shown in the following graph where I used a 12 month rolling window (trailing twelve months) for the year-on-year growth to smooth out quarterly anomalies as per suggestion from Deagol in comments.
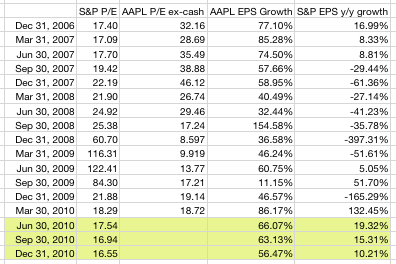
Note how S&P earnings were indeed in a state of severe decline during the recession, and how the P/E gyrated wildly as a result. (I've had to clip the actual values in the graph for clarity but I include all the data in the table at the bottom of this article). Post-recession S&P P/E began to return to normal at the beginning of this year and is forecast (by S&P) to align once again with the pre-recession growth in earnings.
Now compare with what happened to Apple's stock. Pre-recession the stock enjoyed a significant premium for growth. The blue bars are significantly higher than the red bars in the 2006/2007 period and the blue line is naturally higher than the red line in the same period.
During the recession, Apple continues to grow but the P/E drops to remarkably low levels (10). Although Apple's earnings growth does diminish, it never goes away. The anomalous growth in the third quarter of 09 is 11% due to the huge spike the year earlier with the launch of iPhone 3G. Overall, the company continues growing at a good clip.
Not so for its P/E however. Even after the recession ended and AAPL accelerated growth to above 50% again, the P/E remained around 20. I left out the forecast from the AAPL line so that readers can imagine their own.
The bottom line is that at the new all-time high, Apple's shares are trading at a discount to their growth. Not only lower than than Apple has enjoyed historically, but lower than the average of 500 of the largest companies in the US. Those companies having earnings growth in the teens have recovered their valuation. Apple with growth returning to above 50% hasn't.