Asymco

Asymmetric Intelligence

tablet

  1. Innoveracy: Misunderstanding Innovation

    Research · 166 comments

    Illiteracy is the inability to read and write. Though the percent of sufferers has halved in the last 35 years, currently 15% of the world has this affliction. Innumeracy is the inability to apply simple numerical concepts. The rate of innumeracy is unknown but chances are that it affects over 50% of us. This tragedy impedes our ability to have a discourse on matters related to quantitative judgement while policy decisions increasingly depend on this judgement.

    But there is another form of ignorance which seems to be universal: the inability to understand the concept and role of innovation. The way this is exhibited is in the misuse of the term and the inability to discern the difference between novelty, creation, invention and innovation. The result is a failure to understand the causes of success and failure in business and hence the conditions that lead to economic growth.

    My contribution to solving this problem is to coin a word: I define innoveracy as the inability to understand creativity and the role it plays in society. Hopefully identifying individual innoveracy will draw attention to the problem enough to help solve it.

    One example is in the following quote:

    "Lastly, nationally circulating tabloid Ilta-Sanomat gets a look at Nokia’s fabled tablet computer that was developed nine years before the iPad hit the market. According to the paper, Nokia had its own innovative tablet device ready in 2001, but unfortunately it never made it to the shops. A former Nokia expert Esko Yliruusi says that the project was suspended a heartbeat before the tablet hit the market because it was thought that there was insufficient demand for such a device." ((A video showing the device is here, in Finnish.))

    To explain what's wrong with this usage we need some definitions.

    The definition of innovation is easy to find but it's one thing to read the definition and another to understand its meaning. Rather than defining it again, I propose using a simple taxonomy of related activities that put it in context.

    • Novelty: Something new
    • Creation: Something new and valuable
    • Invention: Something new, having potential value through utility
    • Innovation: Something new and uniquely useful

    The taxonomy is illustrated with the following diagram. The position of the circles shows the embedding of meaning ((The size of the circles also suggests degree of effort required and potential reward. Note that this is not a Venn diagram.))
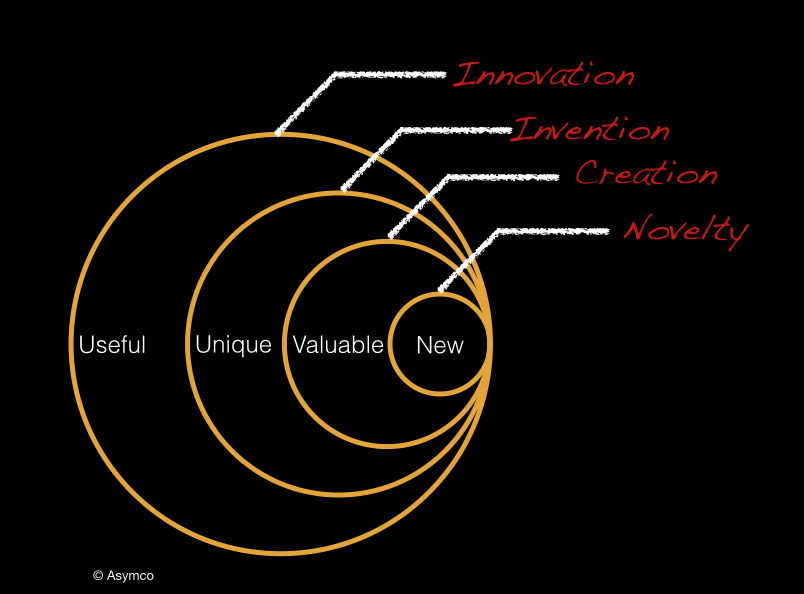
    Screen Shot 2014-04-18 at 7.54.26 AM

    To illustrate further, here are some examples of the concepts.

    • Novelties: The choice of Gold as a color for the iPhone; the naming of a version of Android as "Kit Kat"; coining a new word.
    • Creations: The fall collection of a fashion designer; a new movie; a blog post.
    • Inventions: Anything described by a patent; The secret formula for Coca Cola.
    • Innovations: The iPhone pricing model; Google's revenue model; The Ford production system; Wal-Mart's store design; Amazon's logistics.

    The differences are also evident in the mechanisms that exist to protect the works:

    • Novelties are usually not protectable but since their value is very limited the copying is not seen to cause harm.
    • Creations are protected by copyright or trademark but are not patentable since they lack utility.
    • Inventions can be protected for a limited time through patents but can also be protected indefinitely by being kept secret. Their uniqueness may also be the means by which they can be kept a secret.
    • Innovations can be protected through market competition but are not defensible through legal means.

    Note that the taxonomy has a hierarchy. Creations are novel, inventions are creations and innovations are usually based on some invention. However inventions are not innovations and neither are creations or novelties. Innovations are therefore the most demanding works because they require all the conditions in the hierarchy. Innovations implicitly require defensibility through a unique "operating model". Put another way, they remain unique because few others can copy them.

    To be innovative is very difficult, but because of the difficulty, being innovative is usually well rewarded. Indeed, it might be easier to identify innovations simply by their rewards. It's almost a certainty that any great business is predicated on an innovation and that the lack of a reward in business means that some aspect of the conditions of innovation were not met.

    The causal, if-and-only-if connection with reward is what should be the innovation litmus test. If something fails to change the world (and hence is unrewarded) you can be pretty sure it was not innovative enough.

    Which brings us to the quote above. The fact that the Nokia tablet of 2001 not only did not succeed in the market but was not even released implies that it could not have been innovative. The product was only at the stage of perhaps being an invention (if it can be shown to be unique) or merely a creation (if it isn't.) Furthermore, if the product is so poorly designed that it is literally unusable then it is just a novelty. A design, sketch or verbal description might be novel but it does not qualify as an innovation or an invention or even a creation. How far the depiction went toward making a dent in the universe defines its innovativeness.

    Why does this matter?

    Understanding that innovation requires passing a market test and that passing that test is immensely rewarding both for the creator and for society at large means that we can focus on how to make it happen. Obsessing over the mere novelties or inventions means we allocate resources which markets won't reward. Misusing the term and confusing it with activities that don't create value takes our eye off the causes and moves us away from finding ways of repeatably succeeding.

    Recognizing that innoveracy is a problem allows us to address it. Addressing it would mean we could speak a language of value creation that everyone understands.

    Wouldn't that be novel?

  2. Airshow 2014 World Tour: Coming to a City Near You

    Conference · 3 comments

    Screen Shot 2013-12-19 at 12-19-3.48.45 PM

    In a world where everyone needs to present, few know the power that lies under their fingertips.

    Whether one-on-one or in front of millions on TV, presentations are the primary means of persuasion in business.

    Have you ever cringed at text-only slides or puzzled over graphs that made no sense? Steve Jobs saw "PowerPoints" as "rambling and nonsensical" and had them banned internally. But he used visuals for all his keynotes. What made them tolerable, even persuasive?

    The problem is that most people receive no training in how to compose the most crucial images they project to an audience and the tools available do not take advantage of motion, touch, processing power, mobility and high resolutions.

    • Airshow teaches principles of visual persuasion using techniques of cinematography and visual storytelling.
    • Airshow shows how tablets create a new stage for your performance.
    • Airshow applies Aristotelian rhetoric, Cinematographic theory and Cinematic storytelling as well as Tufte design principles into a new medium.

    You’ll learn how to:

    • Persuade with logic, empathy and credibility.
    • Present rich data as compelling and emotionally engaging
    • Get hands-on experience with modern tools of persuasion including tablets and interactive, touch-based interfaces.

    You have the data. You have the audience. All you need is a story and a screenplay. How do you build them?

    There are techniques which are proven to work. They’ve been used by writers, performers and playwrights for centuries. Professional presentation coaches will teach you far less and at greater expense.

    • Airshow is better and less expensive, especially in terms of time.
    • Airshow is an intimate experience. Audience size is limited.
    • All the tools and techniques needed in one day of intense, inspirational and engaging training.

    Airshow could be coming to a town near you but to make it happen you need to act now.

    Here's how it works: For every month in 2014 an Airshow event will be hosted. The location for that month will be locked-in when the first 20 registrations for that city will be recorded. Any registrations that take place before the location is locked-in will be half-price.

    In other words, early registration means you get half off! ((If your registration is not part of a quorum (fewer than 20 total) then it's automatically re-issued for the following month. You may also request a refund.))

    Now is the time to learn presentation skills for the post-PC era. Just like there is no writing which does a movie justice, I can't write here how it's done, you have to see it live.

    Register now.

    HERE'S WHAT PEOPLE SAY ABOUT AIRSHOW

    “Airshow was amazing. Business stories with cinematic impact made easy with perspective”
    — Paul Brody, Global Business Leader, IBM

    “Airshow has fundamentally changed how I give client and industry presentations. It is an important tool in my toolbox which allows me to showcase my data and my story in ways that help audiences gain deeper insight and perspective.”
    — Ben Bajarin, TIME, TabTimes, Techpinions

    “Nobody brings numbers to life like Horace Dediu does.”
    —Philip Elmer-DeWitt, Fortune/CNN

    “The unhurried nature of Airshow is just terrific and in contrast to many other events. Anyone who goes will gain their own purposes.”
    —Steve Crandall

    “Airshow is a treat [...] showing how to make the audience wonder.”
    —Bertram Gugel

    “Airshow is surpassing my expectations. Very interesting deep content.”
    —Ryan Singer, 37signals.

  3. When will the migration from PCs be complete?

    Research · 129 comments

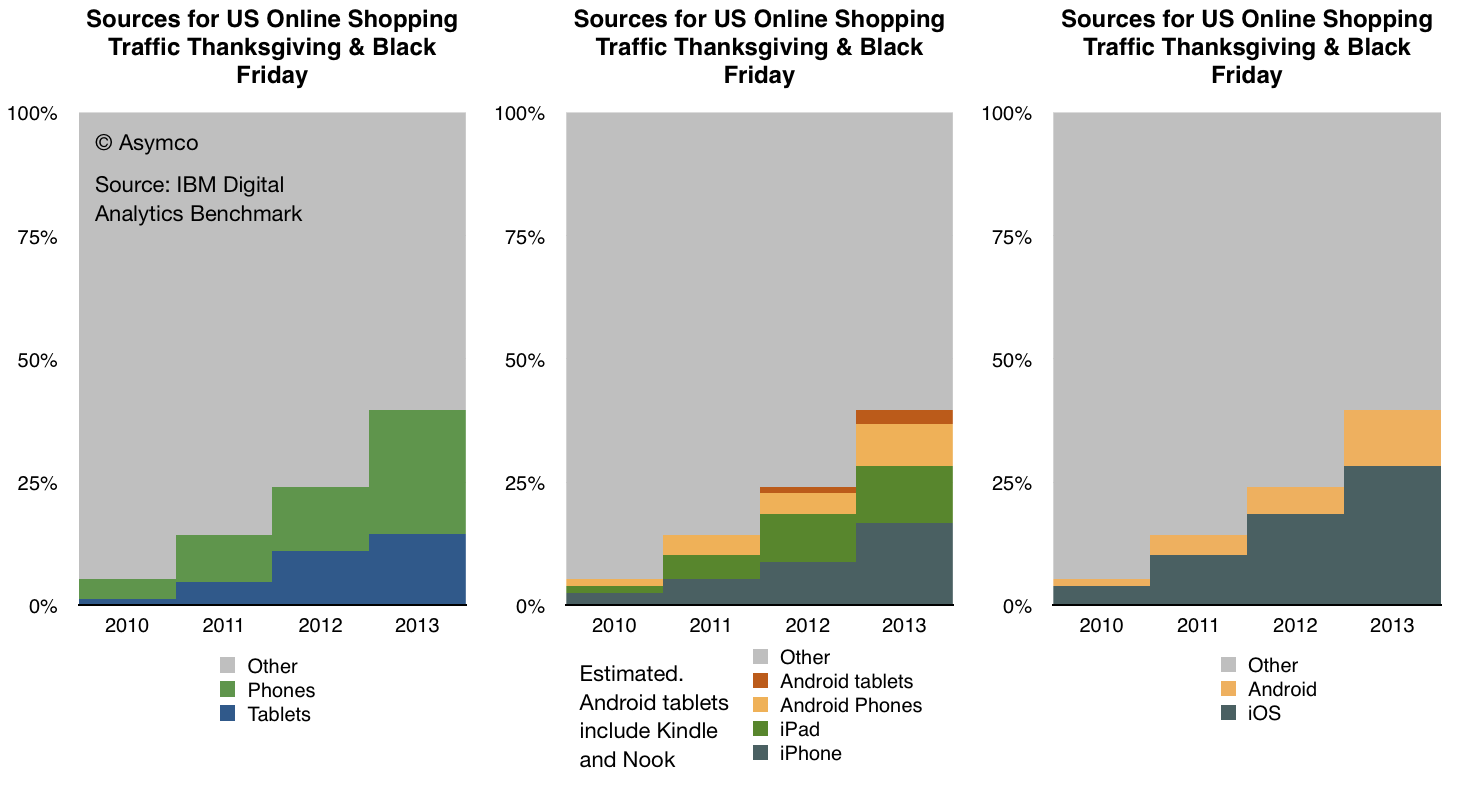
    IBM Digital Analytics Benchmark (report is here) has published, for the fourth year in a row, US online shopping traffic data with a split between mobile and fixed online traffic. It reveals a pattern of consumer behavior which is quite startling: people seem to prefer to shop using mobile devices.

    The data is shown below:

    Screen Shot 2013-12-02 at 12-2-6.45.34 AM

    In terms of sources of traffic, mobile devices (including tablets) have increased from about 5% of all online traffic to 40% in four years. Last year the volume was 24% implying that 16 points of share were gained in one year. If that is extrapolated to next year then more than half of holiday shopping traffic in 2014 will be on mobile devices.

    Put another way, next year less than half of users will hire a PC for the job of online shopping.

    If this conversion from PC-based shopping to device-based shopping follows a logistic substitution curve then the conversion to devices will probably be 90% complete in another 5 years or by 2018 or 2019. I see no reason why this particular job to be done (shopping) should not be considered a proxy for other jobs as well. Therefore it's not a stretch to imagine that the transition to post-PC consumption will also be practically completed by 2020.

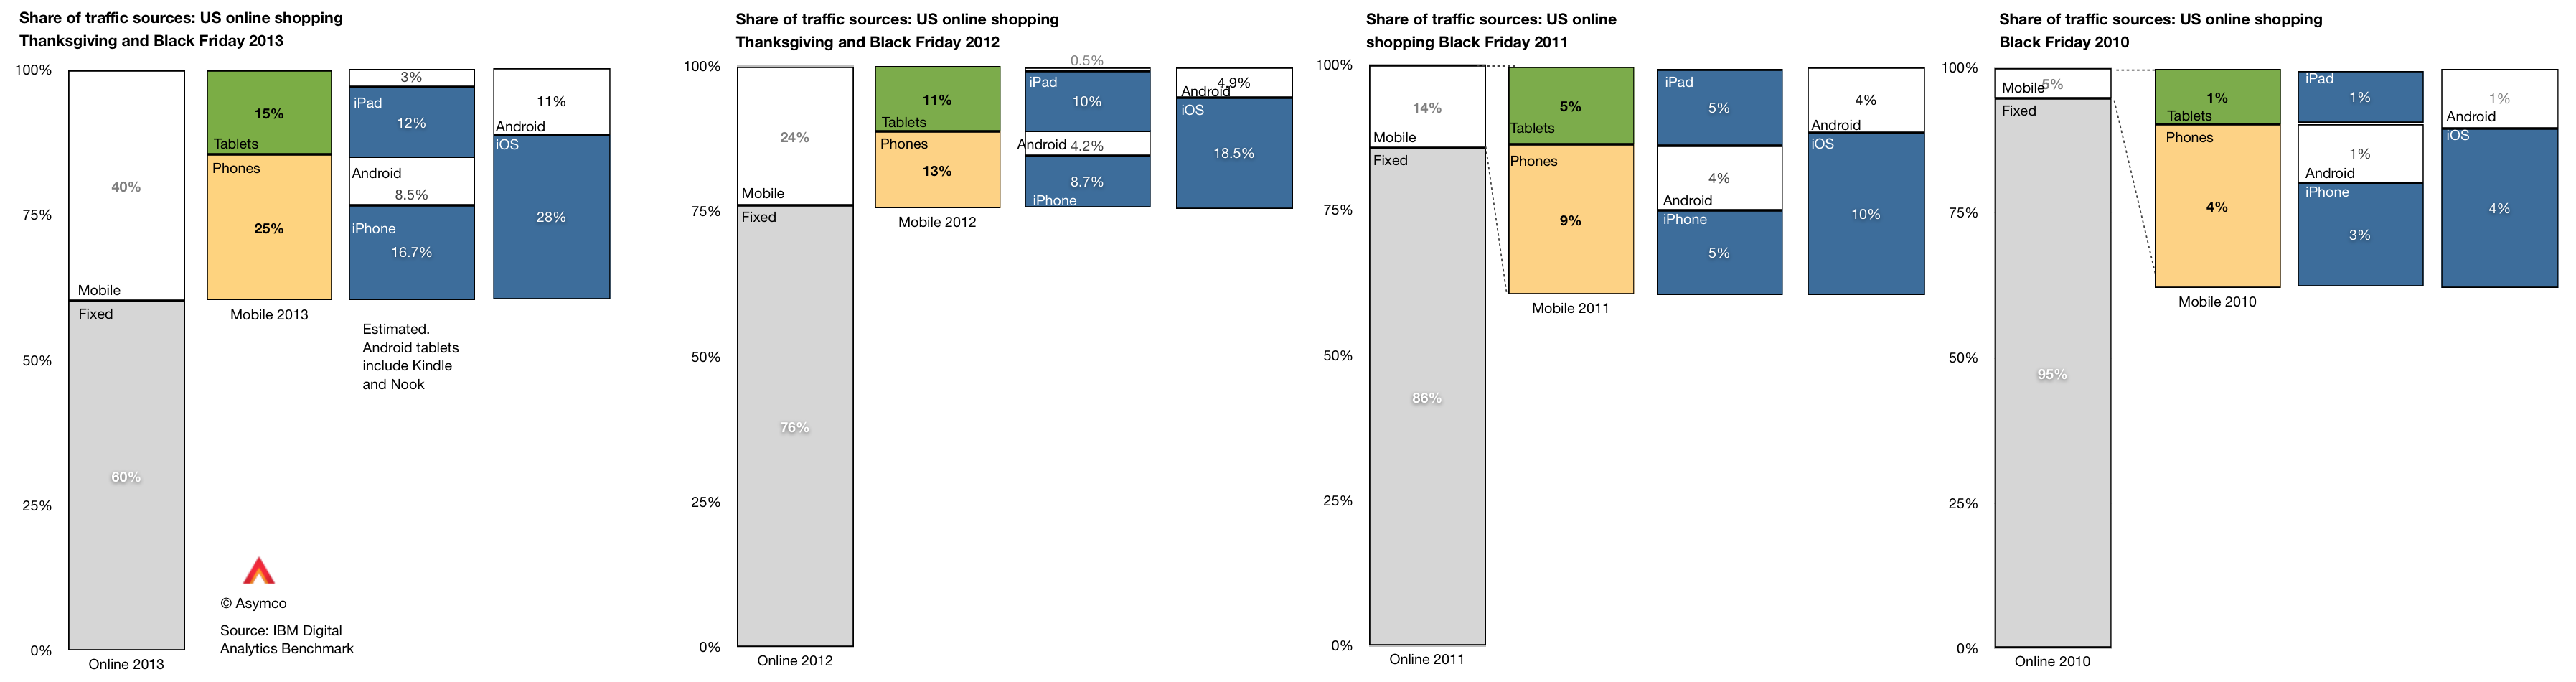
    Within the data there is also a significant amount of detail beyond the mobile/non-mobile split in behavior. There is a distinction drawn between tablet and phone traffic and a further distinction between Android and iOS devices. ((The split between Android and iOS for tablets and phones was not published for 2013 but I extrapolated from previous years and assumed that 80% of tablet traffic was sourced from iPads vs 88% in 2012 and 99% in 2011. Note also that non-iPad traffic is assumed to be Android but that includes the Kindle and Nook products which are using partial and unsanctioned versions of Google's Android.))

    This more detailed view of the traffic is shown in the following diagram:

    Screen Shot 2013-12-02 at 12-2-7.00.20 AM

    A few observations:

    • The pattern of slowing tablet growth is likely due to the slowing growth in iPad sales. This itself is due to the lull in product launches as the shift to fall only iPad releases took place in 2012.
    • The consequence is that iPad traffic contribution only increased by 2 percentage points, from 10% in 2012 to 12% in 2013. Compare this with the doubling the previous year (from 5% to 10%).
    • Among phone users, both Android and iOS grew their contributions to traffic by roughly 100%. Android phone traffic increased from 4.2% of all traffic to 8.5% and iPhone traffic increased from 8.7% to 16.7%.

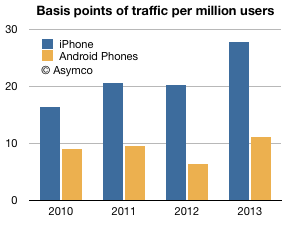
    As we also know the approximate number of phone users for each platform (via comScore) then we can also determine the per user contribution of traffic of each platform. ((Note that this is phones only.))

    The measure is "basis points of traffic per million users" and it is the result of taking the traffic data (in percent of total online traffic) and dividing by the population of users of a particular platform. The result is shown below:

    Screen Shot 2013-12-02 at 12-2-3.05.53 PM

    The way to read it would be that each million iPhone users generated about 28 basis points of traffic while each million Android users generated about 11 basis points of traffic.

    A way to compare these audiences would be to define the ratio between traffic usage by platform user. That ratio was

    • 1.83 (iOS:Android) in 2010
    • 2.16 in 2011
    • 3.15 in 2012
    • 2.51 in 2013

    So, as far as phones are concerned, US iPhone users are about 2.5 times more likely to shop online than US Android phone users. The data is reliable: with the US population now over 65% penetrated with smartphones, these populations of users (totaling over 130 million) are vast and representative. As the technology is reaching deep into the late adopter segments the difference in behavior between iOS and Android usage is becoming easier to explain. We have to eliminate quirks of demographics or income or other possible causes.

    The platforms themselves are becoming the last remaining suspects as causes for differences in the behavior of their users.

    It may seem preposterous to suggest that a platform can affect shopping behavior but let's remember that the PC, the subject of this article, is a platform in itself. The migration of usage away from the PC to alternatives can only be explained by the alternatives being superior at the particular job that needs doing. The argument is naturally extendable to each alternative individually.

  4. Dark Matter

    Research · 84 comments

    Benedict Evans explains well the problem with measuring Android tablets. There are no reliable data collected because many of the devices are invisible through the regular, measurable channels:

    • There are no firms which report their shipments
    • They are not sold through retail chains which normally are sampled in the US and Europe (NPD and GfK respectively.)
    • They don't show up in browsing or ad transaction data
    • Google Play statistics are missing most of the activations since they are not sold as bona fide Google-sanctioned Android.

    The only measured statistic happens to be component shipments. Items such as screens, CPUs or perhaps memory might be visible to market analysts. It's therefore tempting to add up tires manufactured to determine what's getting sold in auto dealerships.

    But it's also hugely problematic.

    Before we go into that rat's hole, I want to re-visit my original criticism for market analysis based on device attributes. When the iPad was new it was famously labeled a "media tablet" by Gartner and excluded from being counted (and hence compared) with PCs. This created an implicit signal to the analyst's clients to ignore the entrant as irrelevant.

    That actually accelerated their demise (and the revenue prospects for the analyst).

    In contrast to that exclusion--of a clear and present danger based on an arbitrary definition of form factor--the analyst who defines categories of products purely on the definition of their components is guilty of the same sin.

    Snowing the audience with irrelevant comparisons is just as bad as withholding relevant comparisons. This is explicitly asked of witnesses: to tell the truth, the whole truth and nothing but the truth. The "nothing but the truth" means the exclusion of irrelevance.

    The correct approach is to identify which devices are comparable (and thus in the same category) based on the jobs they're hired to do. If a tablet overlaps considerably in the work it does with a PC (e.g. browsing, email, media play, and other applications) then they should be considered comparable. If a tablet does nothing that a PC does or nothing that an iPad does (e.g. no browsing, email, apps or ecosystem activity other than piracy) then they should not be considered comparable.

    Which brings me back to the question of what these dark matter "Android tablets" actually do.

    To answer I want to recall another "dark matter" technology that seems to have gone largely unnoticed but was exceptionally popular. This was the VCD or Video CD. It was an alternative to the DVD without the licensing and DRM overhead it entailed. It was extremely popular in Asia as a way of not only buying but also sharing video content. The cost of content was a fraction of sanctioned versions, essentially taking the role that mass-copied VHS had in previous years.

    The "job to be done" was to enjoy video content cheaply and conveniently for the equivalent of pennies a day. A job very similar to what we think of as cable TV today.

    These devices and discs were largely invisible mainly because they did not exist in economies which adopted protected DVDs and because the content consumed did not hit against any databases that tracked consumption. Nevertheless there might have been hundreds of millions of these devices sold and billions of discs viewed.

    Now we are in a situation where devices whose primary purpose is to watch video content (cheaply and conveniently) are being counted. By their counting, their implicit competitiveness is asserted. But it means nothing if they are not hired for the same jobs. In fact it misdirects attention.

    Sometimes these "low end" devices do grow up to swamp the higher-powered alternatives with good enough functionality. That is the innovator's dilemma for low end disruption. But in some cases they don't because other factors are at work. Because ecosystems have complex multi-sided markets and because regulations and channels and consumer behavior conflict with the technical specification.

    For this reason the VCD did not "disrupt" DVD or grow up into a Blu-Ray equivalent that caused Hollywood to crumble. It faded away as an anomaly.

    Whether the dark matter Video-only Android device will come to swamp the iPad will depend not on just volume shipments in select geographies. It will depend largely on the ecosystems built around it. The ecosystems of VCD were largely unsustainable because there was no value placed on the content itself. The value chain did not strive to sustain the technology. When something better came along, it got dropped.

    In contrast, content-based value chains sustain technologies which keep the revenues coming. And we can measure this revenue.

    You don't need to look too hard for that in tablets. Apple states it quite frequently: total payments to developers.

  5. The Five Year Plan

    Research · 248 comments

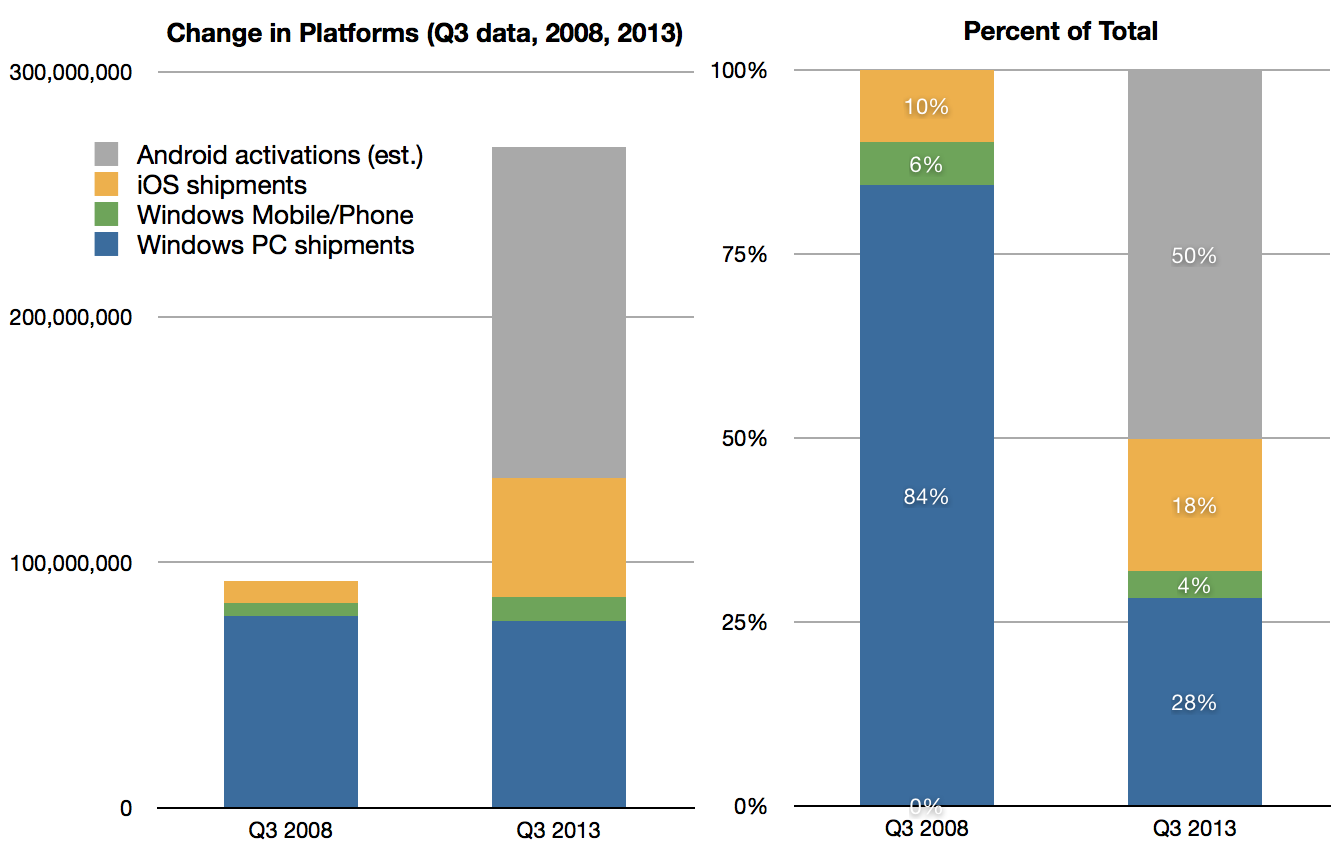
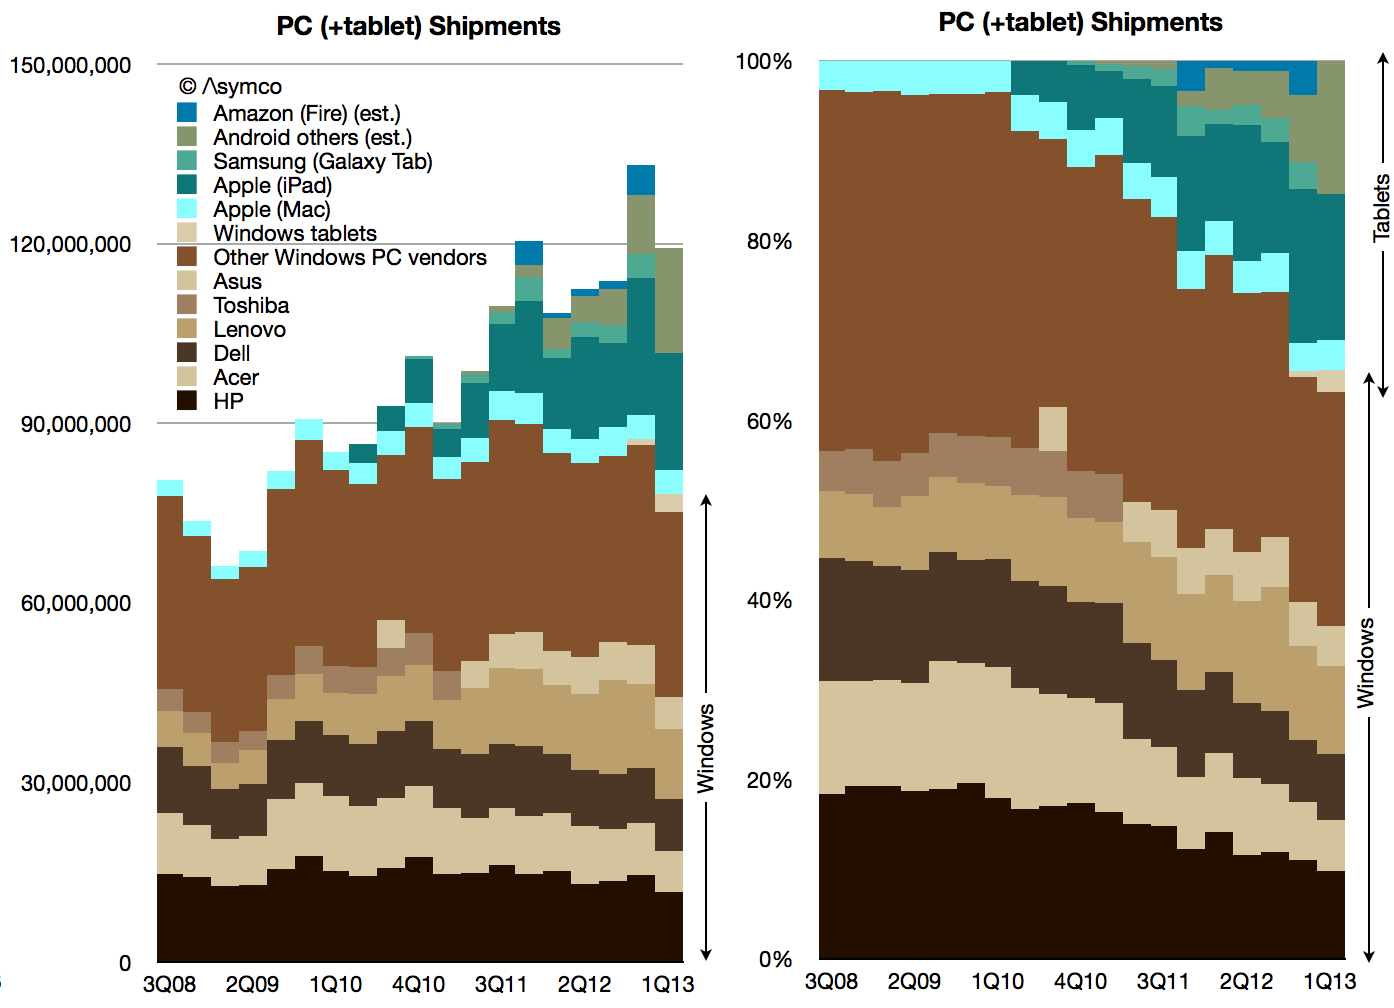
    Gartner reported that PC shipments totaled 80.3 million units in Q3. Subtracting an estimated 4.4 million Macs yields an estimated 75.9 million Windows PCs. ((The total will be less than this as some PCs will not ship with Windows))

    This total is lower than the total shipped in the same period of 2008.


    Screen Shot 2013-10-10 at 10-10-11.12.11 AM


    The graphs above show the Gartner data and the split between tablets and PCs. ((Tablet and Mac data for Q3 is not yet available))

    If we include all iOS and Android devices the "computing" market in Q3 2008 was 92 million units of which Windows ((Windows including Windows Mobile or Windows Phone)) was 90% whereas in Q3 2013 it was 269 million units of which Windows was 32%.

    Screen Shot 2013-10-10 at 10-10-11.33.22 AM


    Any guesses on what this market will look like in 2018?

  6. Switcher

    Research · 91 comments

    Nokia's Windows (Smart)Phone performance was drowned out last week by Microsoft's big announcement of the Surface inventory write-off. They are pieces of the same puzzle however.

    First, a look at Nokia.

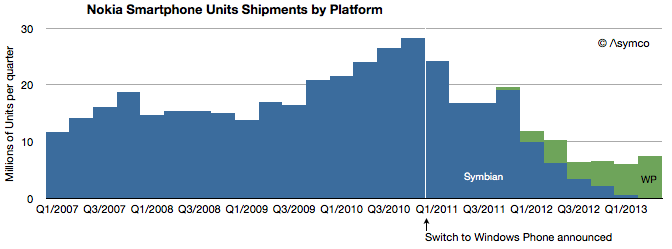
    There were 7.4 million Lumia phones sold in Q2 with 0.5 million sold in the US. Although Windows Phones grew sequentially from 5.6 million the previous quarter, and up from 4.0 million in the same quarter last year, total smartphones are down y/y and nearly flat over the last four quarters. This is of course because Symbian phones have finally disappeared from volume shipments. The following graph shows the history of Nokia's smartphone shipments.

    Although it's tempting to compare Lumia to iPhone (given the premium positioning in the US) the average price of €157 or $206 shows that Lumia is more adequately compared to Android. This is about a third of what Apple gets for its iPhones.

    That's not necessarily a bad thing. Nokia's always had a knack for mass-market phones and certainly that was one reason Microsoft was attracted to them. Presumably, the promise of the relationship was to insert Windows Phone into the Nokia development and distribution pipeline, squeezing out costs and filling up channels.

    Screen Shot 2013-07-22 at 7-22-3.24.21 PM

    The problem for the brand has been that although priced at Android levels, volumes are nowhere near and the gap is widening. At current activation rates, Android is selling 16.5x faster than Windows Phone (assuming 90% of Windows Phones are Lumia).

    So Nokia's problems become Microsoft's problems. As bad as Nokia seems to be doing with Lumia, it's doing a lot better than Microsoft with hardware. Here the story of the great Surface write-off should give pause. Microsoft announced that it would write off $900 million of Surface.  In terms of write-offs this is pretty significant. Compare it with the debacle of the PlayBook write-off when BlackBerry (then known as RIM) wrote off $485 million for tablets it could not sell. Or with Microsoft's own write-off for the Kin which took $240 million out of its shareholder's pockets. The only charge for hardware that I found higher was Microsoft's own Xbox 360 which cost it $1 billion for the "red ring of death".

    But this is not an unusual situation at Microsoft. Besides Xbox, Kin and Surface, Microsoft also declared victory in (read: shut down) SPOT watches, the Smart Display, Tablet PCs and the Zune. This is why when I heard about the Surface I asked who would be Microsoft's Tim Cook.

    By the way, $900 million write-off could amount to over 3 million devices, more if Microsoft is assuming some residual value in the inventory. Misjudging demand to such a degree that more units are disposed of than sold implies a basic failure of understanding of hardware businesses.

    Which brings up the question of what Microsoft will do. They are likely to double down on hardware (also signaled by their re-org) simply because in a device world (read: post-PC) the economics of licensing Windows and Office are evaporating. The price points of EULAs simply don't hold and there are good enough alternatives in use by the hundreds of millions of iOS and Android devices out there already. By withholding Office from iOS and Android, Microsoft has shown a billion people that they can live without it and they already knew they could live without Windows.

    So rather than fight, Microsoft chose to switch. Switching from software to hardware, however, is proving very hard. I'm sure quite a bit harder than management  thought.

  7. Forecasting Windows market share

    Research · 80 comments

    Last week Frank X. Shaw, VP of corporate communications at Microsoft stated:

     ... most of the people around me were using their iPads exactly as they would a laptop – physical keyboard attached, typing away, connected to a network of some kind, creating a document or tweet or blog or article. In that context, it’s hard to distinguish between a tablet and a notebook or laptop. The form factors are different, but let’s be clear, each is a PC.

    Actually this "admission" that iPads are PCs is not something new. Steve Ballmer made the same assertion in 2010 pre-iPad (though calling them slates). Arguably, the notion that tablets are PCs has been dogma at Microsoft for over a decade and Windows running on all form factors has been a strategic guiding principle.

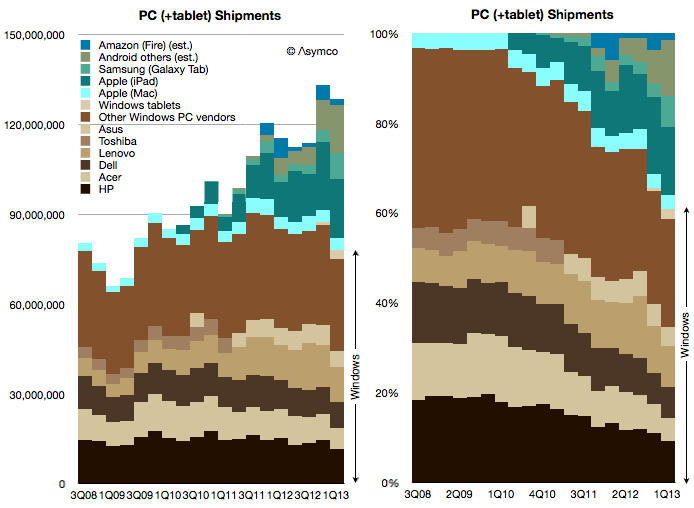
    Which is why I've always added the tablet data to the PC data to create a picture of the "personal computing" market. And this is what that picture looks like today:

    Screen Shot 2013-06-03 at 6-3-5.31.21 PM

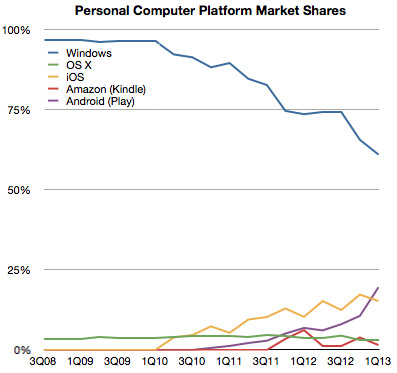
    Note how the share of various platforms has evolved over this brief time span:

    Screen Shot 2013-06-03 at 6-3-5.32.43 PM

    Seen this way, Windows has now reached 60% market share and it's likely to dip below 50% during this year. What happens beyond then is harder to imagine. If Windows tablets start growing as fast as the tablet market overall then Windows could stabilize in share. But if Android and iOS tablets follow their phone brethren in growth then it will be far harder for Microsoft to maintain share. But is that cause for concern?

    Not necessarily.

    The total computing market[1] is likely to expand to over 4 billion users with 1.5 devices per user in the next five years. That expansion implies that 20% share equals more than one billion devices, making such an ecosystem "good enough" for the average developer. It certainly has been good enough for Windows developers to date and they have kept hiring it throughout the new mobile app revolution.

    So even if Windows dips to only 20% of the world's computing market it will still be perfectly "viable" for some time to come.

    --

    1. I define the computing market as the total number of devices which have (a) a CPU (b) a broadband connection (c) a native application execution environment which is open to third party apps. This definition implies the presence of an "ecosystem" which is bound specifically to a platform.
  8. Surface Tension: The effect of Surface on Windows revenues

    Research · 34 comments

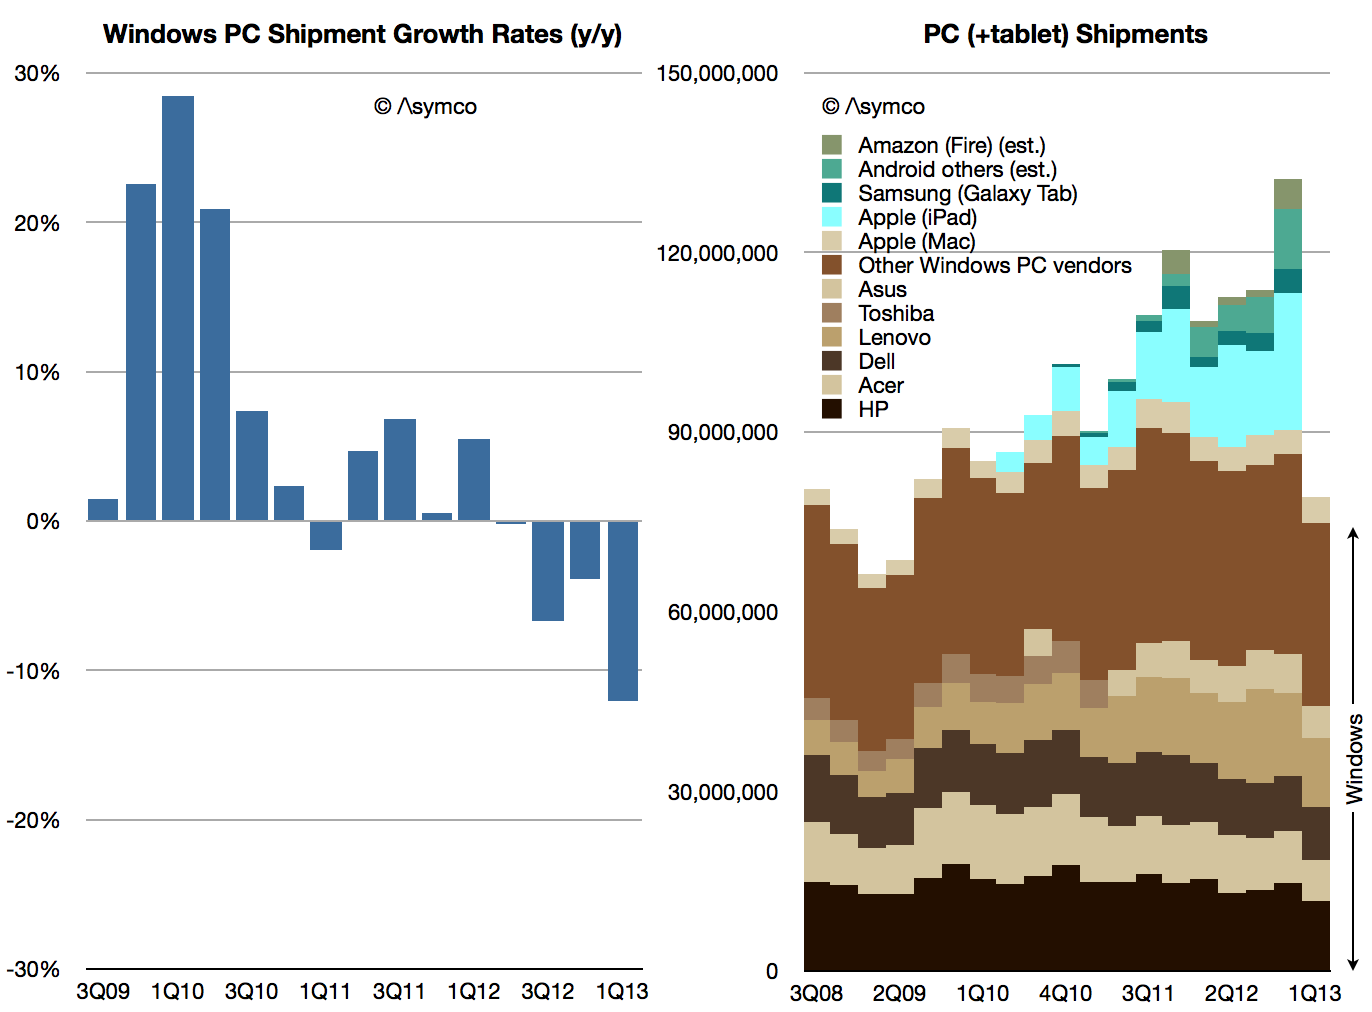
    According to Strategy Analytics 3 million Windows-based tablets shipped in Q1. That is not inconsequential. It would add 4% to the total Windows-based computers and reduce the decline in Windows PC growth to -8% (from -11%). You can see the effect of those units on share in the following graphs.

    Screen Shot 2013-05-02 at 5-2-2.06.21 AM

    Note the "boundary layer" of pale blue Macs between the brown-hued Windows and the green-hued tablets.

    Including tablets of all kinds, here is the market share growth in Windows PCs.

    Screen Shot 2013-05-02 at 5-2-2.06.30 AM

    As the post-PC disruption evolves, Microsoft has made an effort to shift its business model. I discussed this some time ago and there remain quite a few questions about the sustainability of the strategy.

    However, there might already be evidence that it's working. The clue is in the growth in Windows revenues at a time when PC shipments (at least traditional ones) are declining rapidly. Some of that might be due to deferrals and software assurance revenues which are insensitive to shipments. However some have to be due to the Surface.

    Remember that Surface launched with an RT version priced starting at $499 (which did not sell well) but received a boost in Q1 with the Pro version priced at $899 to $999. If we assume a 80:20 mix of Pro to RT and an average price of $950 for the Pro and $550 for RT, 3 million units would generate at least $2.5 billion in gross revenues. Accounting for retail margins of 20%, Microsoft could still be recognizing $2 billion in revenues. That's a significant portion of $5.7 billion in Windows revenue.

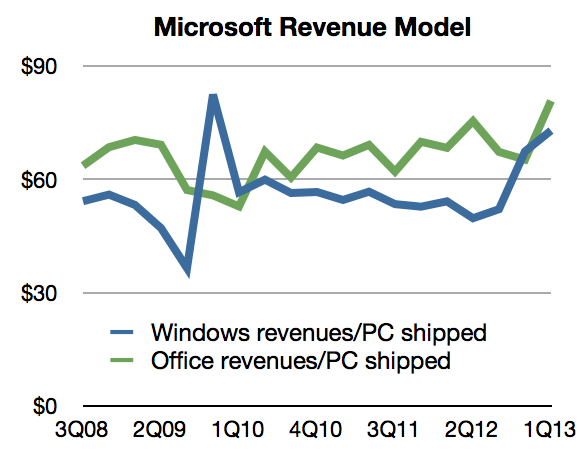
    We can back into this figure from another direction: Prior to Surface launch, the Windows revenue per PC shipped (combining Microsoft's revenues and Gartner's estimates) was about $50. After the Surface Pro shipped the revenue climbed to $73/PC.

    Screen Shot 2013-05-02 at 5-2-2.06.38 AM

    Assuming the same pre-Surface revenue/PC and given the shipment figures for Q1 we would get about $3.7 billion for Windows. The difference to actual revenues is about $2 billion.

    So the extrapolation of Windows royalties approach yields $2 billion in Surface sales and the Price x Units estimate also yields $ 2billion. It would suggest that Surface has had a significant impact already: More than a third of Windows revenues depend on it.

    [UPDATE: I've been informed that not all the Windows tablet sales reported by Strategy Analytics are Surface products. As many as 1 million might not be. That would reduce the revenues as calculated to about $1.4 billion. In addition, not all Windows revenues are current with much of that deferred. Actual revenues were $4.6 billion. With both of these adjustments considered, the impact of Surface might be only 30%.)

  9. Happy Birthday iPad

    Research · 34 comments

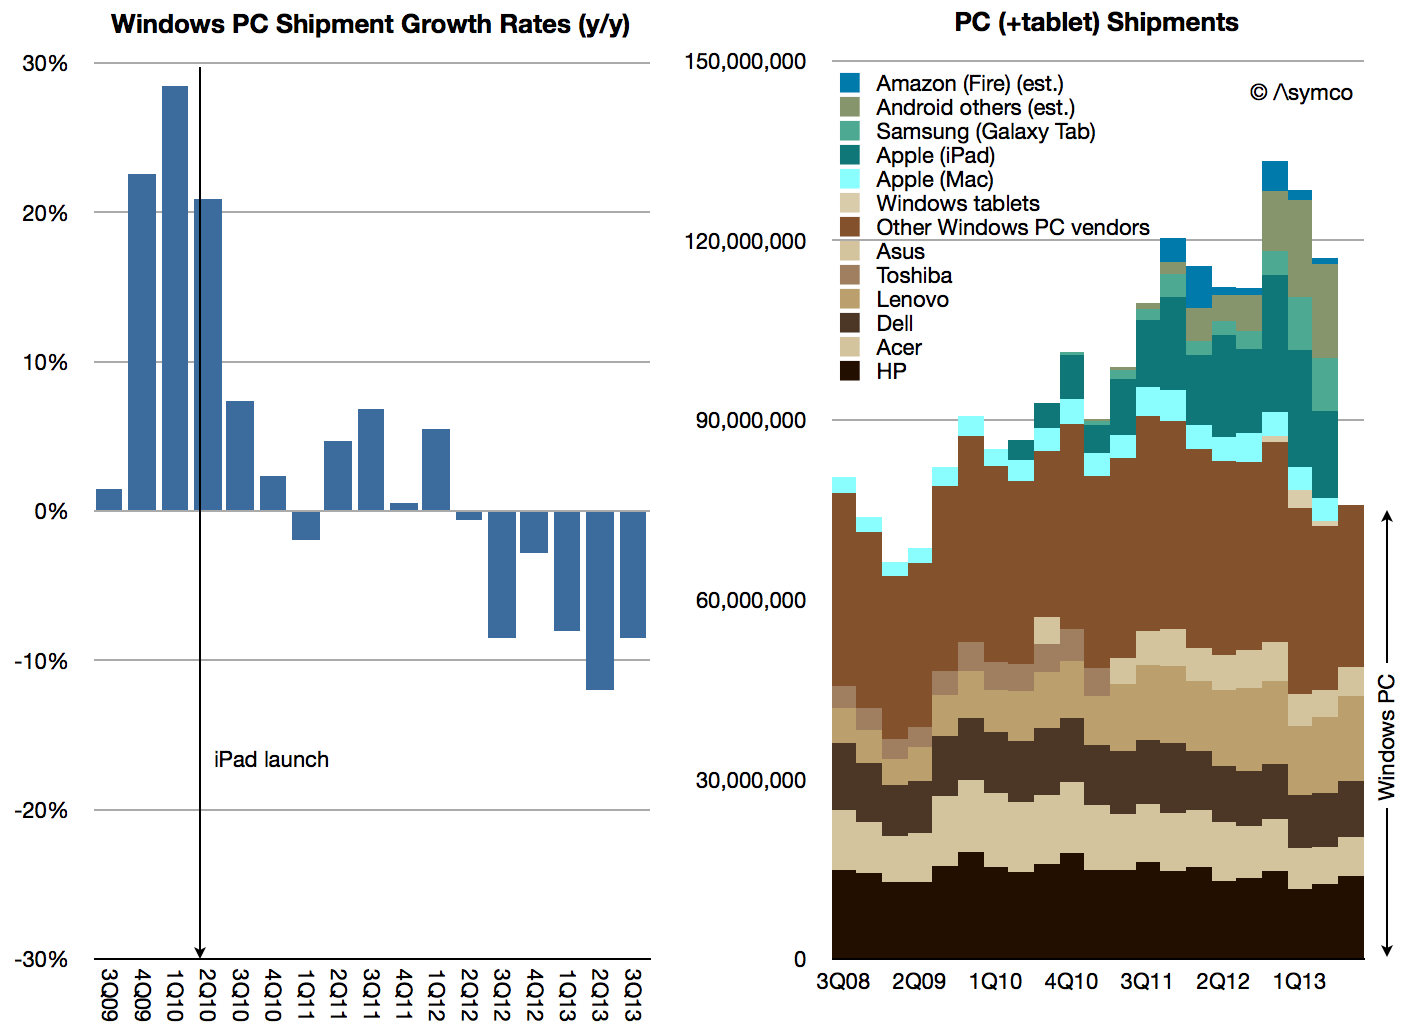
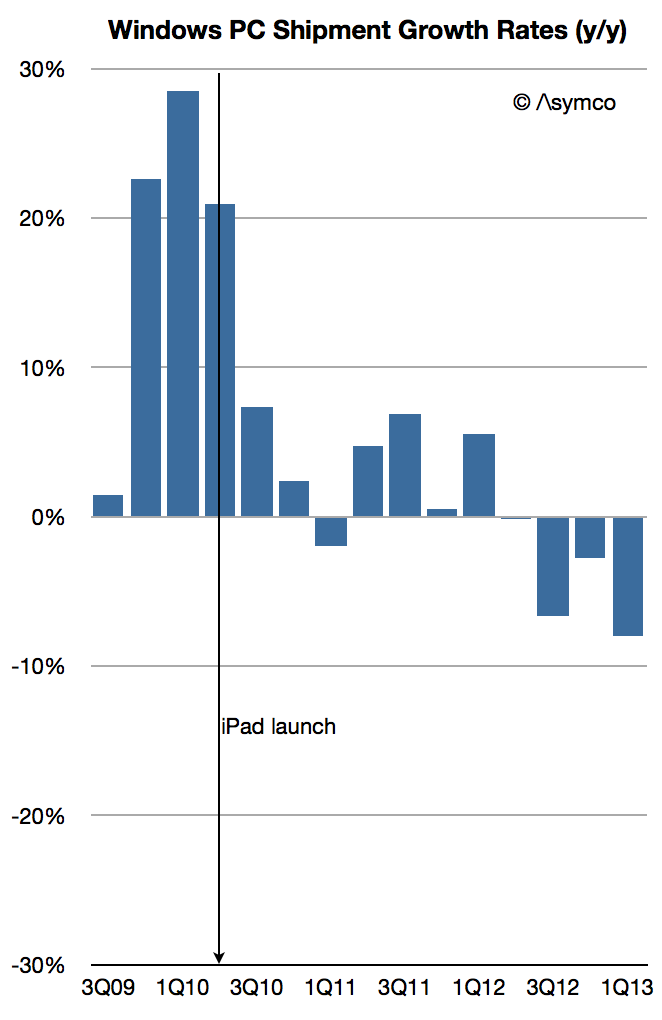
    The latest data on PC shipments from Gartner showed a decline of  11.1% from the first quarter of 2012. As we don't yet have the final data on Apple's Mac shipments, I used my estimate of 4.38 million units (14% growth as per NPD estimate for the US) to obtain an estimate of Windows PC shipments.

    That number is 74.8 million units. In the first quarter of 2012 the corresponding calculation yields 85.1 million units. That makes Windows PC rate of decline -12%.

    The historic shipment data and growth rates are shown below:

    Screen Shot 2013-04-11 at 4-11-6.07.30 AM


    Note that tablet data is not yet included in the shipments summary. Windows shipments are shown in shades of Brown and tablets in shades of Blue/Green.

    The decline in PC shipments is persisting and even accelerating.

    Coming only a week after the iPad's launch birthday, it's perhaps a fitting testament to its impact.

  10. Where are the Android users?

    Research · 172 comments

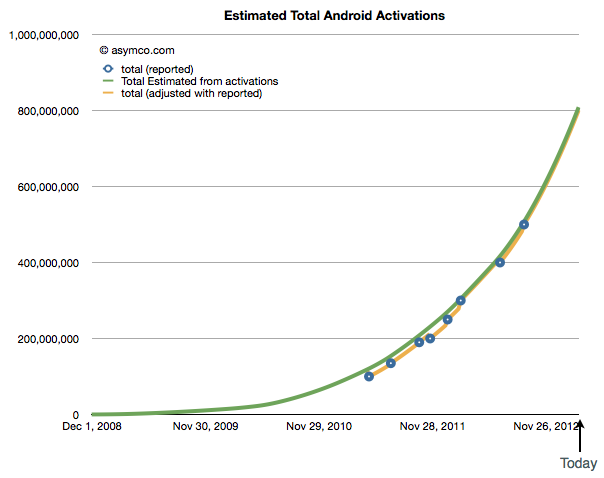
    Google occasionally reports data regarding Android. Very occasionally. The last time we had some data was in September 2012 when we learned that activations were running at 1.3 million per day and that a total of 500 million total activations had taken place.

    As of today, being March 2013, the time between updates has reached five months. It's the longest gap so far. Benedict Evans also notes that it's been five months since the data regarding screen size stats has been updated on the Android developer site.

    But we have to live with what we get and, in the absence of an update, the pattern of growth in Android, if sustained, looks like this:

    Screen Shot 2013-03-10 at 3-10-11.05.14 PM

    It implies that 800 million Android activations have taken place to date and the rate is about 2 million per day. One billion activations could thus happen by June.

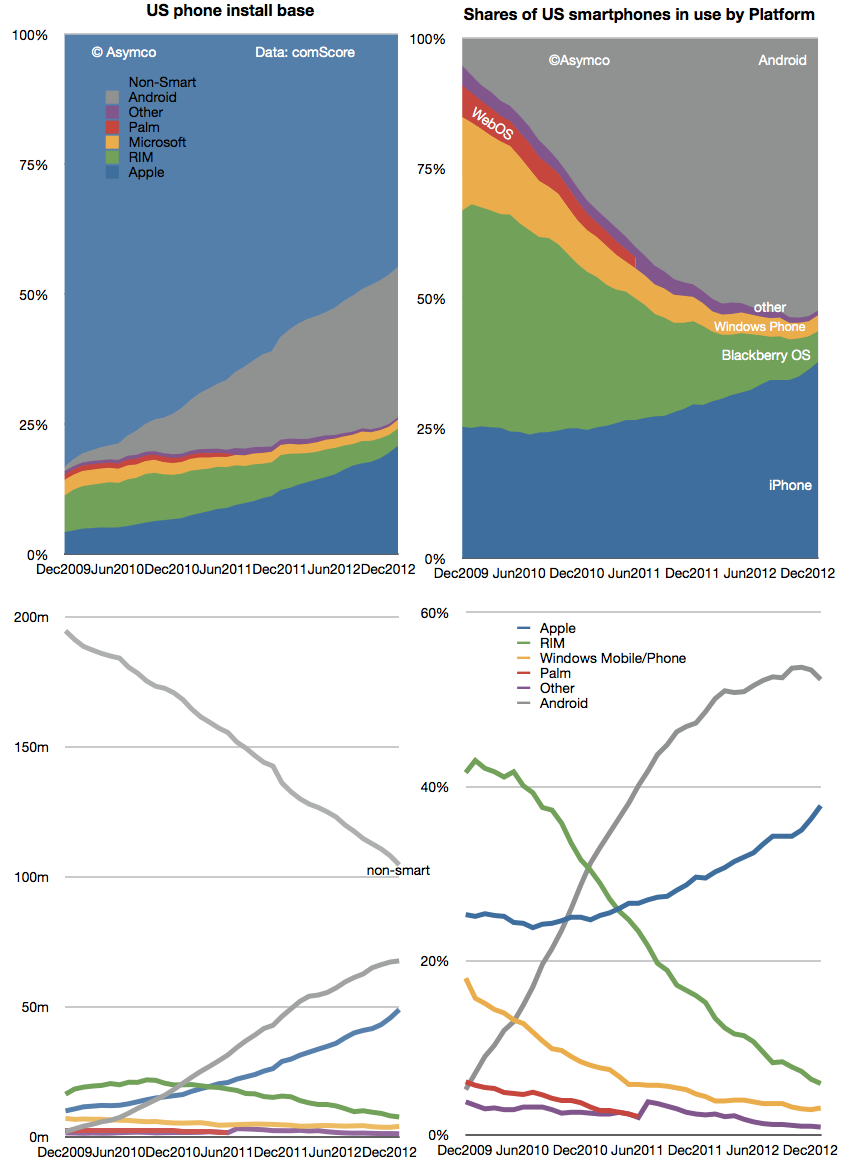
    There is however another set of data regarding Android which is updated more frequently. The comScore mobiLens survey covers the US and provides updates on a monthly basis. That data shows that Android users in the US reached about 68 million as of the end of January. See the updated data below:

    Screen Shot 2013-03-11 at 3-11-10.26.01 AM

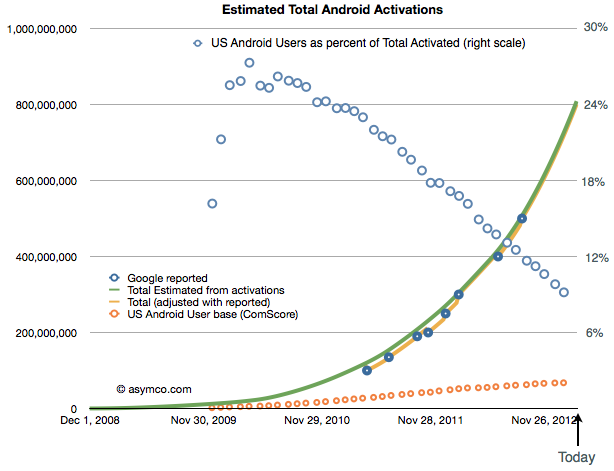
    I included the install base and share of total users as reported. Combining the comScore data with Google's activations gives the following picture of US as a percent of global Android (orange circles represent US base and blue circles the precent of total activations that the US might represent)[1].

    Screen Shot 2013-03-10 at 3-10-11.44.34 PM

    The data implies about 9% of Android usage is in the US. The more startling thing is the difference in growth: it implies that with a US growth rate of only about 13.3k/day, global growth is 150 times faster than US growth. In other words, that 0.6% of new users are in the US and that 99.4% of Android growth is outside the US.

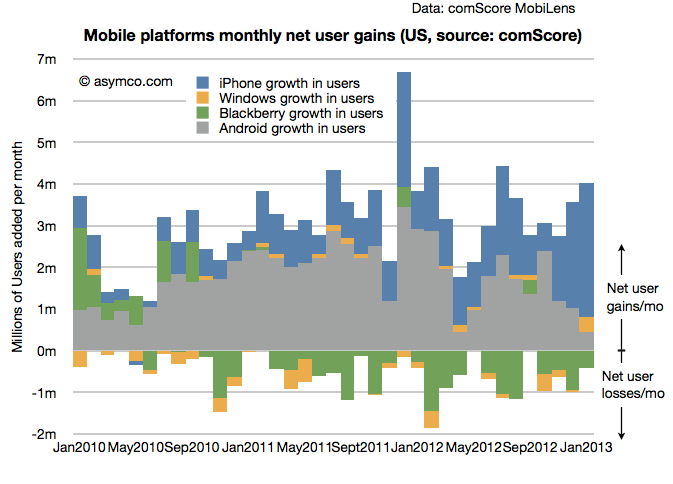
    That's an interesting story. But it's even more interesting that this is not the case with the iPhone. The iPhone is growing considerably faster in the US than Android. One can see this more easily with a graph of the US mobile platform net user gain rate as shown below:

    Screen Shot 2013-03-11 at 3-11-10.32.23 AM


    Looking at the the same contrast between global and US, from Apple's financial reports, in the fourth quarter the global "activation rate" (i.e. sales rate) for iPhone was 525k/day (nearly one quarter of the extrapolated Android rate). The comScore data suggests the US gains are running at 106k/day. Therefore we can calculate that about 20% of iPhone growth is in the US and 80% is outside the US.

    Even accounting for some potential error in the Android estimates, the contrast is quite stunning: 1% vs. 20% share of growth suggests something is very different about the US with respect to the two platforms.

    My suspicion is that it has something to do with the fact that the US is one of the few (but largest) market where the iPhone is available as a "low end" offering. At a minimum price of $0 (with a contract) many consumers are finding the iPhone attractive relative to a $0 (with a contract) Android phone. This price parity (illusory as it may be) allows iPhone to grow even faster than Android in this particular market.

    One wonders what would happen if such price parity were present globally.

    ---

    Notes:

    1. Android activation data as reported by Google includes tablets but excludes many unofficial Android builds e.g. Amazon Kindle and many Chinese phones and tablets that don't register with Google services. comScore data includes only primary devices used by consumers and excludes corporate purchases and devices whose primary users are younger than 13 years.