Asymco

Asymmetric Intelligence

valuation

  1. Movies and the Internet

    Research

    Almost a year ago, on March 1st, 2021, I tweeted a snapshot of the "FAANG" P/E ratios. They were:

    • Netflix: 88.63
    • Amazon: 73.94
    • Microsoft: 34.65
    • Google: 34.75
    • Apple: 32.89
    • Facebook: 25.53

    Today same companies have the following ratios:

    • Netflix: 19.34
    • Amazon: 46.08
    • Microsoft: 30.17
    • Google: 22.35
    • Apple: 27.79
    • Facebook: 13.67

    What a difference 13 months makes. Microsoft and Apple saw modest falls 13% to 16%. Amazon, Google and Facebook saw large falls in their ratios: 38%, 36% and 48%. Facebook (now renamed pitifully as "Meta") in particular saw its valuation collapse by half! This is largely because in February the company forecasted lower than expected revenue growth in the next quarter, blaming privacy changes in iOS, macroeconomic challenges, and the market finally realizing that it's an evil and despicable company.

    Microsoft and Apple grew their businesses nicely and have been resilient post-Covid. They are now revenue-reliable "blue chip" tech companies with large user bases that encompass high value, loyal customers. Google and Amazon are a bit more precarious given exposure to macro conditions and unclear new market opportunities but Amazon is still sporting a very healthy 46 ratio which is largely due to its investment-heavy approach to cash flow.

    But the star of the show, the real blockbuster, is Netflix. It fell from P/E of 88 to P/E of 19. Even six months ago the P/E was close to 70. What happened?

    Remember that P/E is an indication of growth potential. A P/E of 19 implies that the equity should be priced at 19 times last year's earnings, which are roughly indicative of profit in a year and thus P/E is a time horizon: how many years would I wait before I got my investment capital back (and thus break-even).

    Well, one could say that a P/E of 13 or 19 (FB or NFLX) is pretty reasonable. It's reasonable to pay that many years' profit for a company. The large ratios only make sense if a company is growing rapidly. 20% to 30% growth can justify P/E of above 20. But what would justify a P/E of 88?

    The market has always given Netflix high valuation because it was growing and when the growth stopped the P/E fell to a more reasonable level. Unfortunately that means the share price had to fall over 70% from its peak. More than 40% in two days. Tragic.

    The stock peaked at $700 in October and is $221 now. Why were investors betting on high growth, just a few months ago?

    I think it was because investors like movies. And the Internet. Investors like movies and the Internet.

    Netflix was never a great business. The logic evolved from sending movies as DVDs by email, ordered through an online catalog, to having the same selection available for download (streaming). Everything was subscription-based so bundling gave movies a "binging" consumption option.

    But this depended on the having access to good titles. The access was easy at first since Netflix was a new channel and it was a bonus for the movie publisher. Pure margin. But over time the movie publishers saw the new channel eating into existing distribution and they thought they could deliver it themselves, increasing margins. The catalogs were suddenly cut off.

    Netflix responded bravely: they would make their own movies. Out came the checkbooks and the distributor became the producer.

    Amazing.

    But is that really a good business? You have to make movies which are very expensive. Some will be hits, some won't. You thus have to make a lot of them. And then you have diverse demand. People want to have all kinds of genres. So you have to make them all. And what's more you can't really market them as events because they are so numerous. It sounds really hit-and-miss with a huge risk.

    At this point you have to raise pricing. And then came the competition who, like Disney, said "we have better, more targeted family content". Or Apple TV+ which simply said "we have better quality." Many other streamers offered alternatives like Amazon Prime with a smorgasbord approach. Sure, households could subscribe to all these services, but the bill would start to be painful. Not much savings over the cable bundle. Netflix increasing price sends many for the exits.

    The company then drops a bomb: they feel they can't grow subscribers because they are "near saturation" and the families which are not yet paying are probably using "shared" passwords. It can only grow if it converts the non-payers.

    That all happened rather quickly. The market loves movies and the internet and who doesn't. It's just that movies and the internet don't make a great business.

    Movies look to be more of a feature of an internet service bundle. That's Apple's approach. They don't see video as a business but as hygiene: must-have something to put in a bundle.

    So Netflix, who first unbundled the neighborhood video store, then bundled production and distribution was itself not much more than a substitutable piece of a bigger bundle.

    For this reason I always wondered why there was an "N" in FAANG. Netflix always seemed more a transient idea: yes people like movies, as they like music and books and magazines. And producing and distributing media has undergone dramatic change with computing and internet. But a business that only produces and distributes a single media type may be an ok business but should it be put on the same level as platform companies with billions of users?

    Netflix has 200 million subs but that is not a big number. Apple distributes 785 million subscriptions to over 1 billion customers. Google has at least 2 billion users, Microsoft about 1.5 billion and Meta is over 3 billion. Netflix says it can't get many more and indeed they forecast losing 2 million next quarter.

    It's a bit sad, but reminiscent of the games industry: it has its limits and the limits mean that it can't be seen as a ubiquitous and hence maximally valuable asset.
  2. The Car Bundle Paradox

    Research

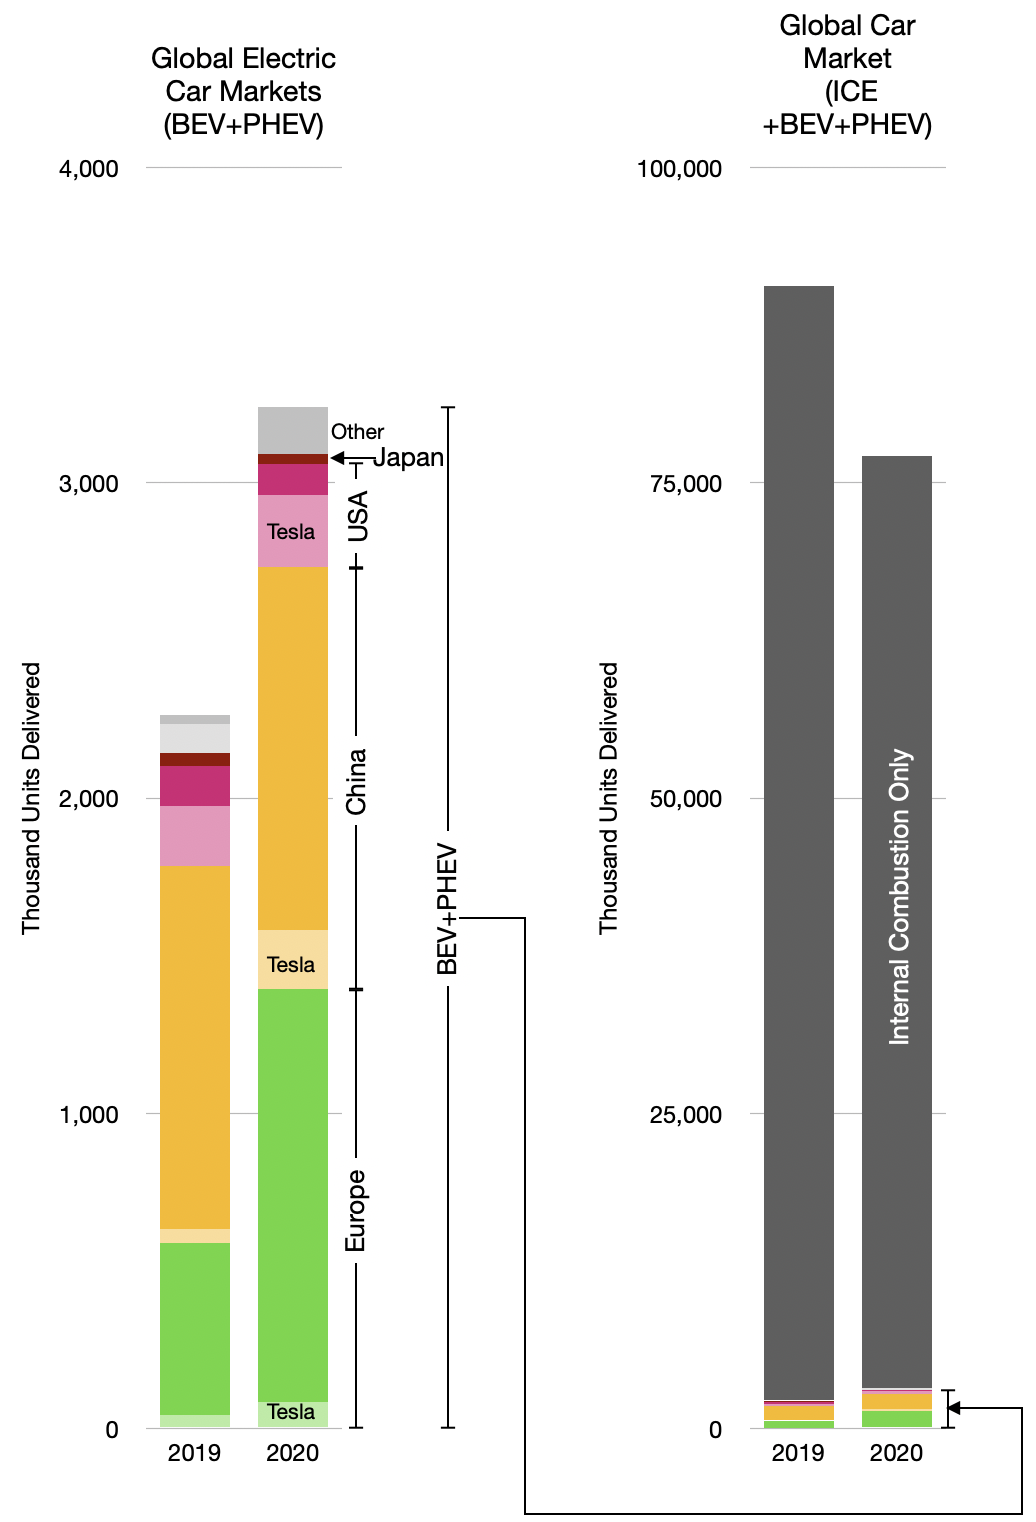
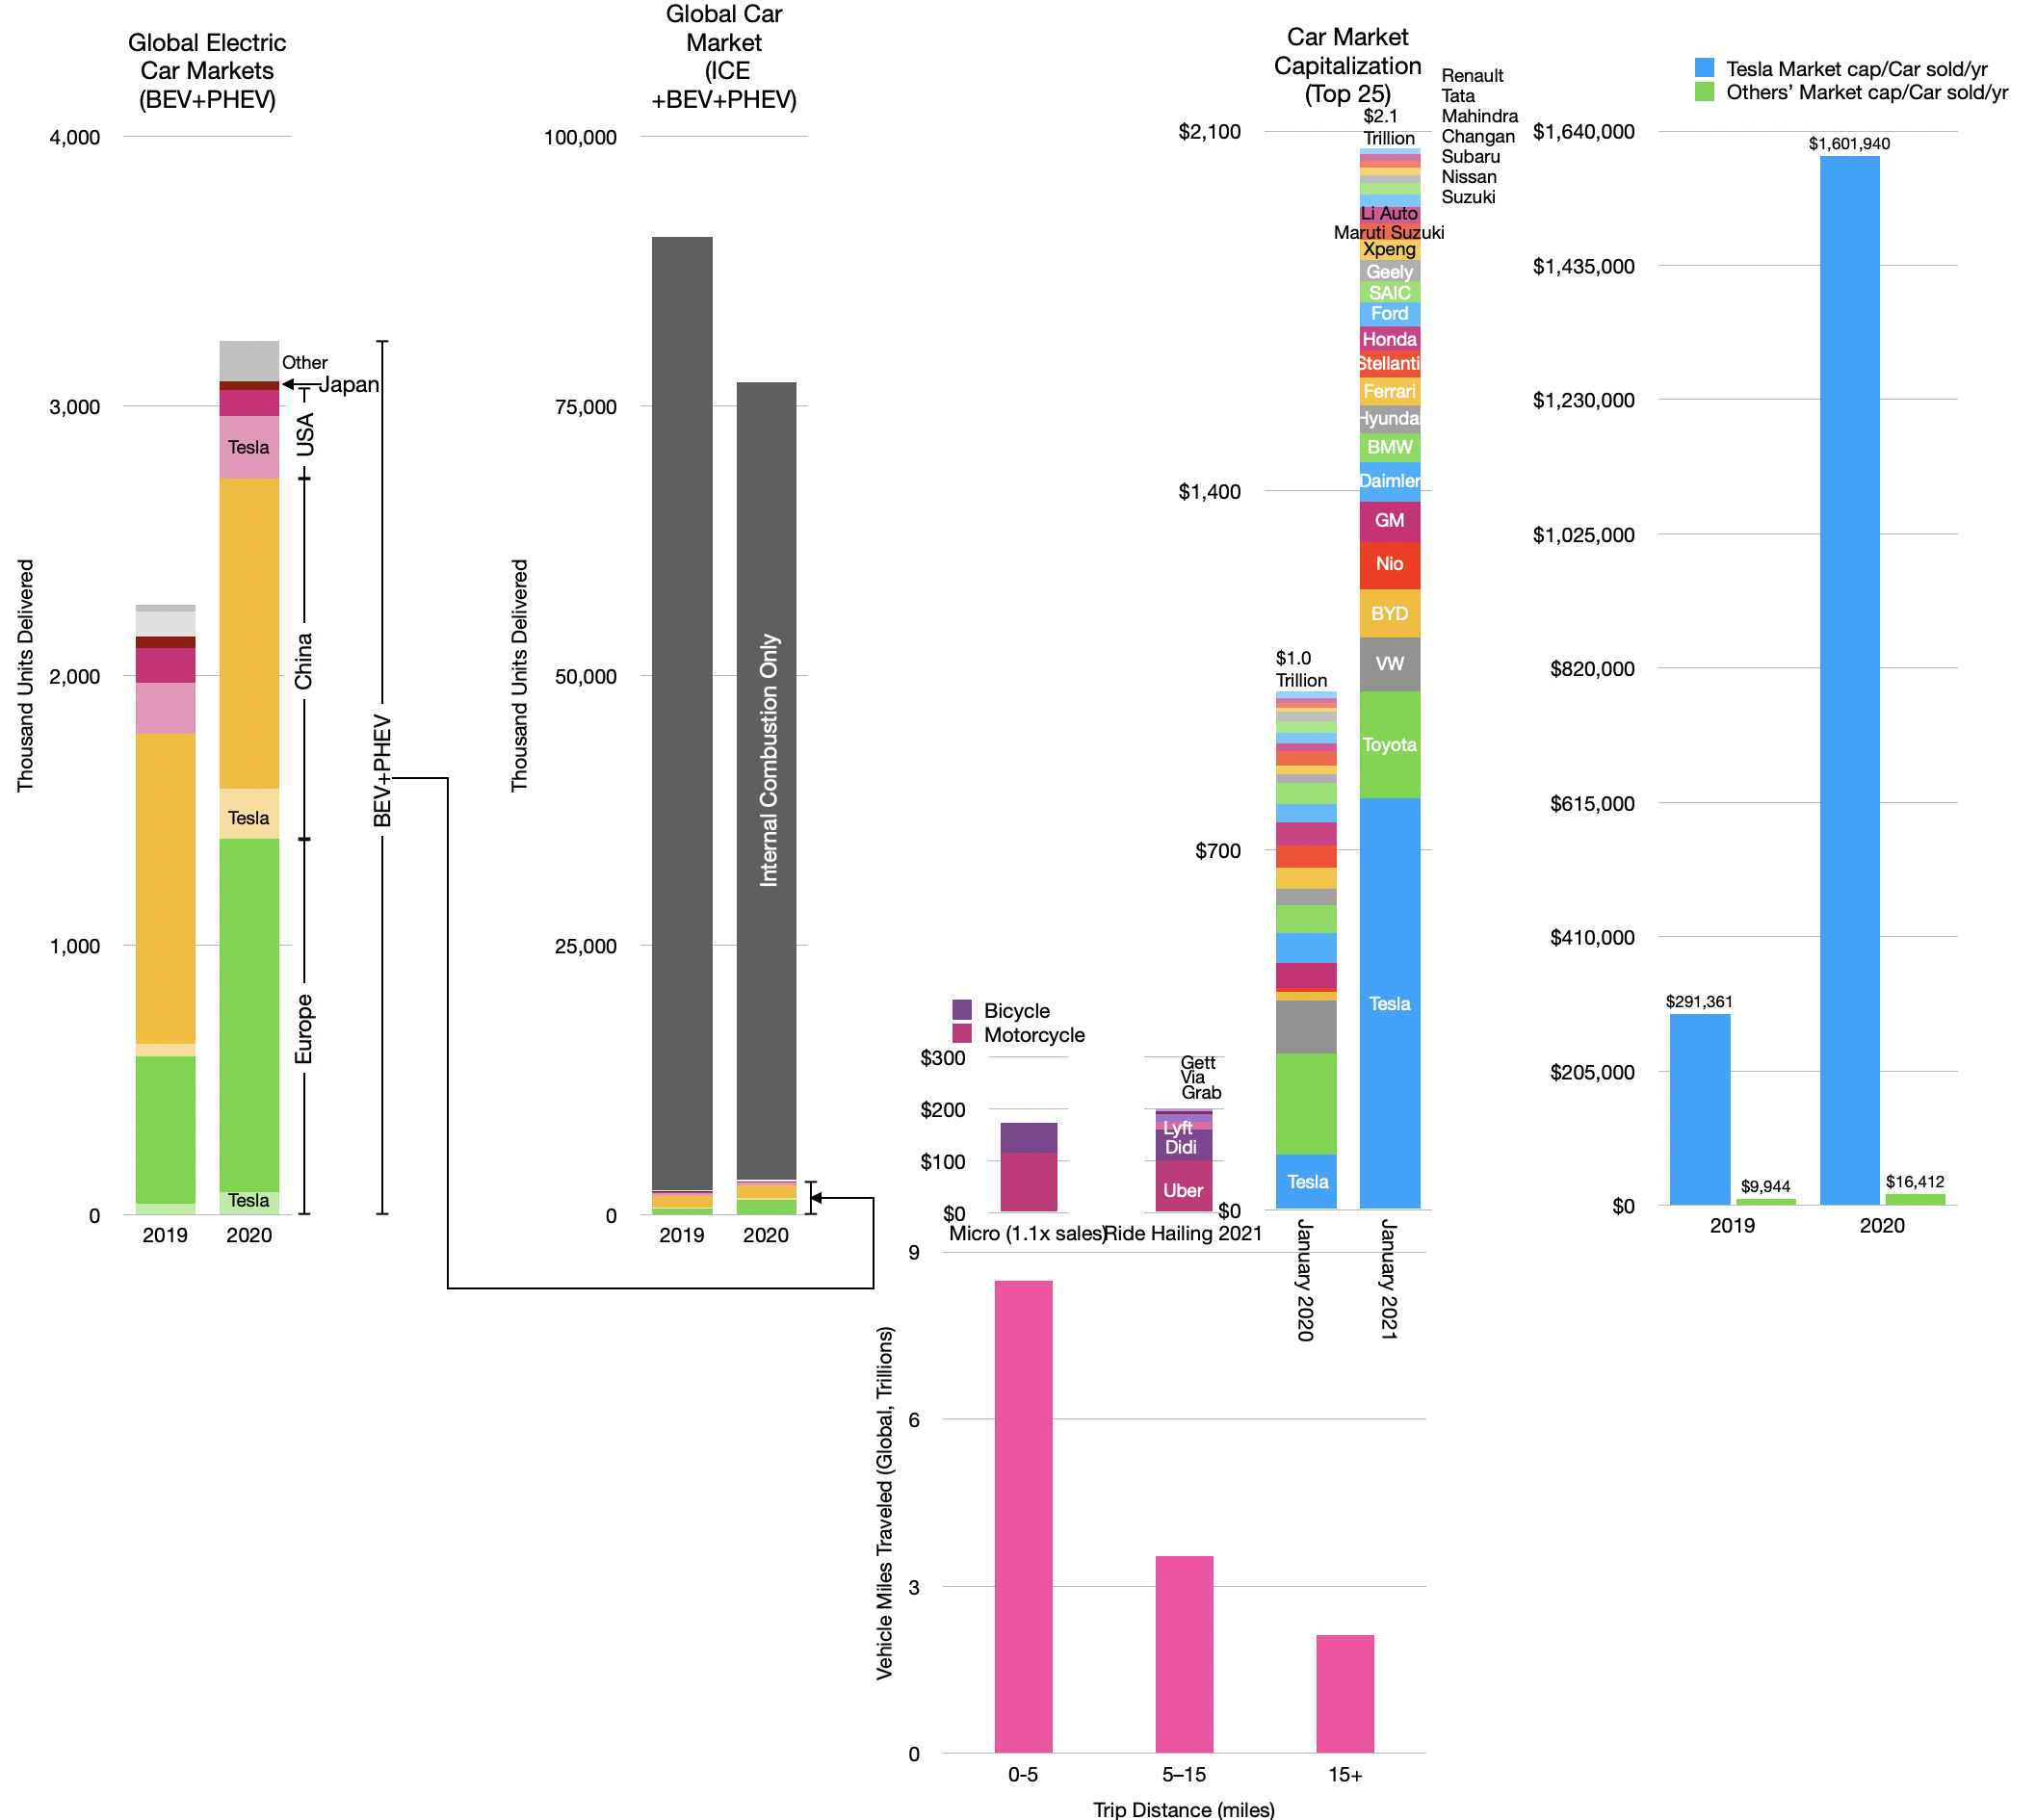
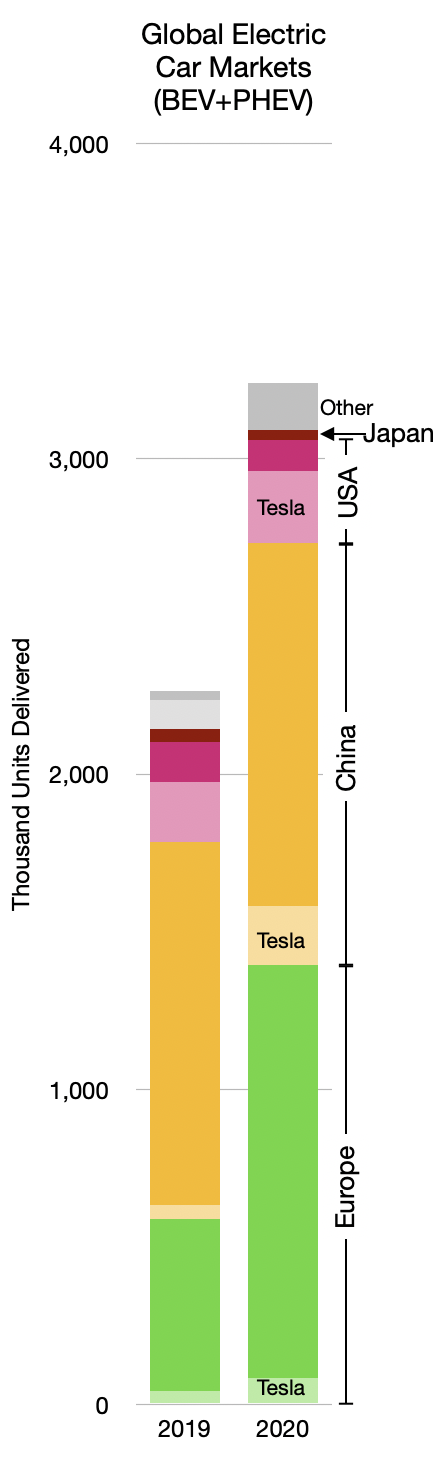
    The EV car market is booming. The graph below shows the global market for plug-in electric cars (plug-in hybrid (PHEV) and battery (BEV)--BEV are about 70% of total). The data is split between 2019 and 2020 with further distinction between the main regions.

    EV (PHEV+BEV) units sold 2019, 2020 by region.

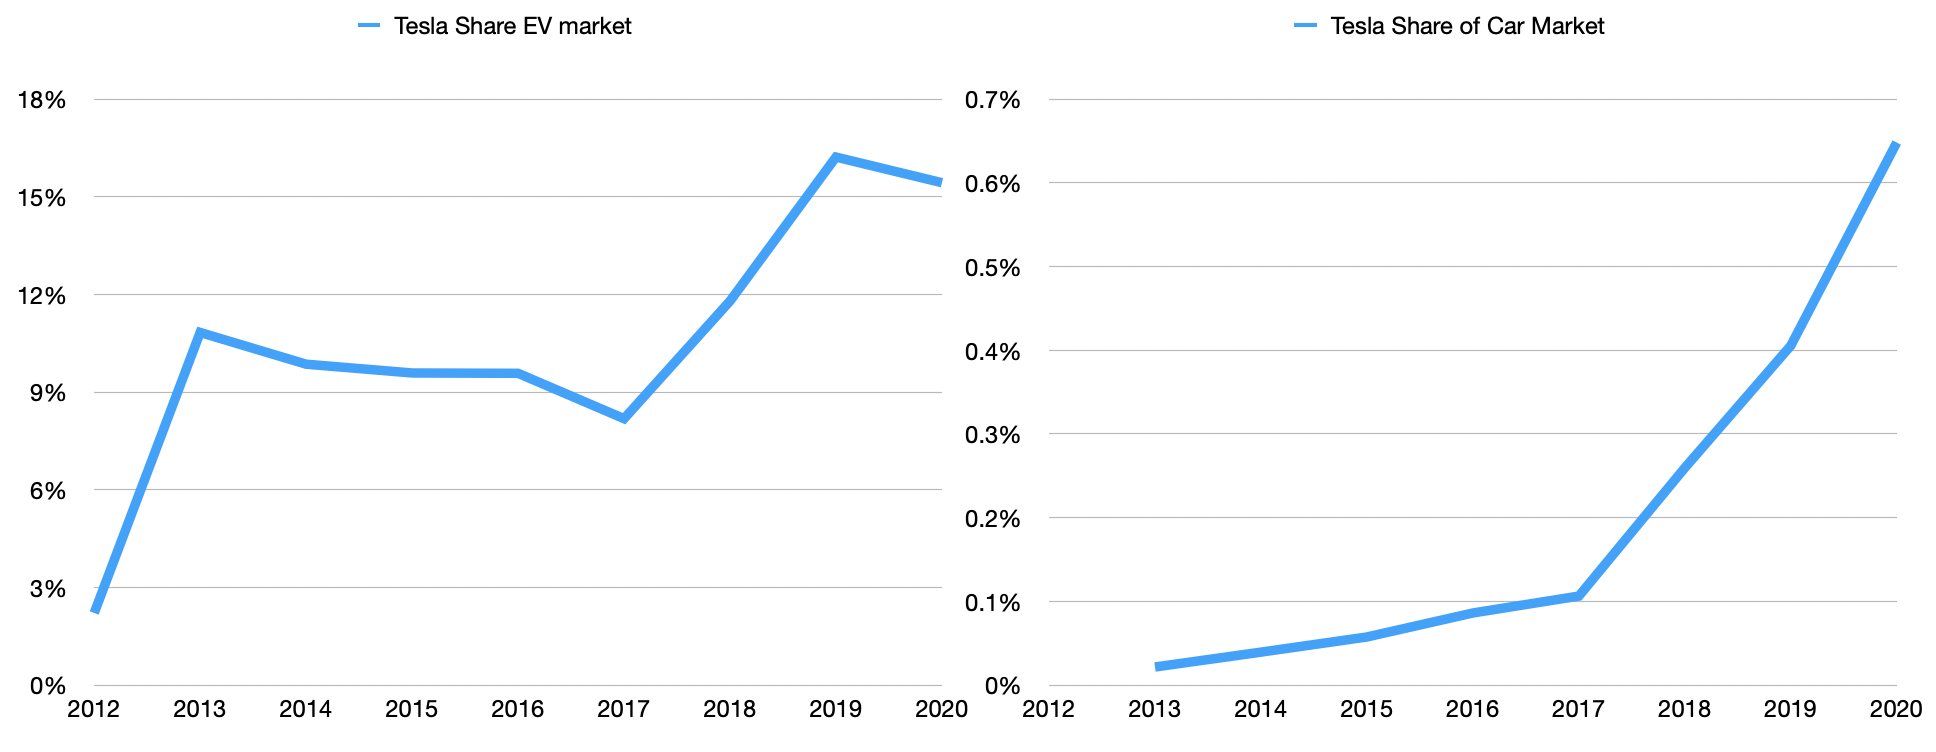
    There is an additional detail in the delineation of Tesla's shipments into these regional markets. To that point Tesla's market share of all EV cars has remained roughly equal from 2019 to 2020.

    Tesla share of EV car market and share of all cars.

    The big story of 2020 was the growth of European EV shipments. Those who follow the market know that new EU penalties for CO2 emissions have come into effect, causing much of this increase. Indeed, previous surges in the US and China have also been driven by new incentives and/or disincentives.

    As an aside, it should be noted the absence of Japan from this EV story. It's quite a shock, really. Japan is responsible for a large percent of all cars sold through its national heroes Toyota, Nissan, Honda, Mitsubishi (and Subaru, Suzuki, Mazda, Isuzu) and has been a driving force for innovation. The absence of a local market for EVs is a glaring indicator of lack of industrial policy. Unlike the US, Japan does not even have an oil industry, importing all its supply (while the US is a net exporter.) Yet the US produces and consumes far more EVs than Japan. This should give pause. One wonders what would happen if Japan followed Europe in providing incentives for EVs in the "JDM" market.

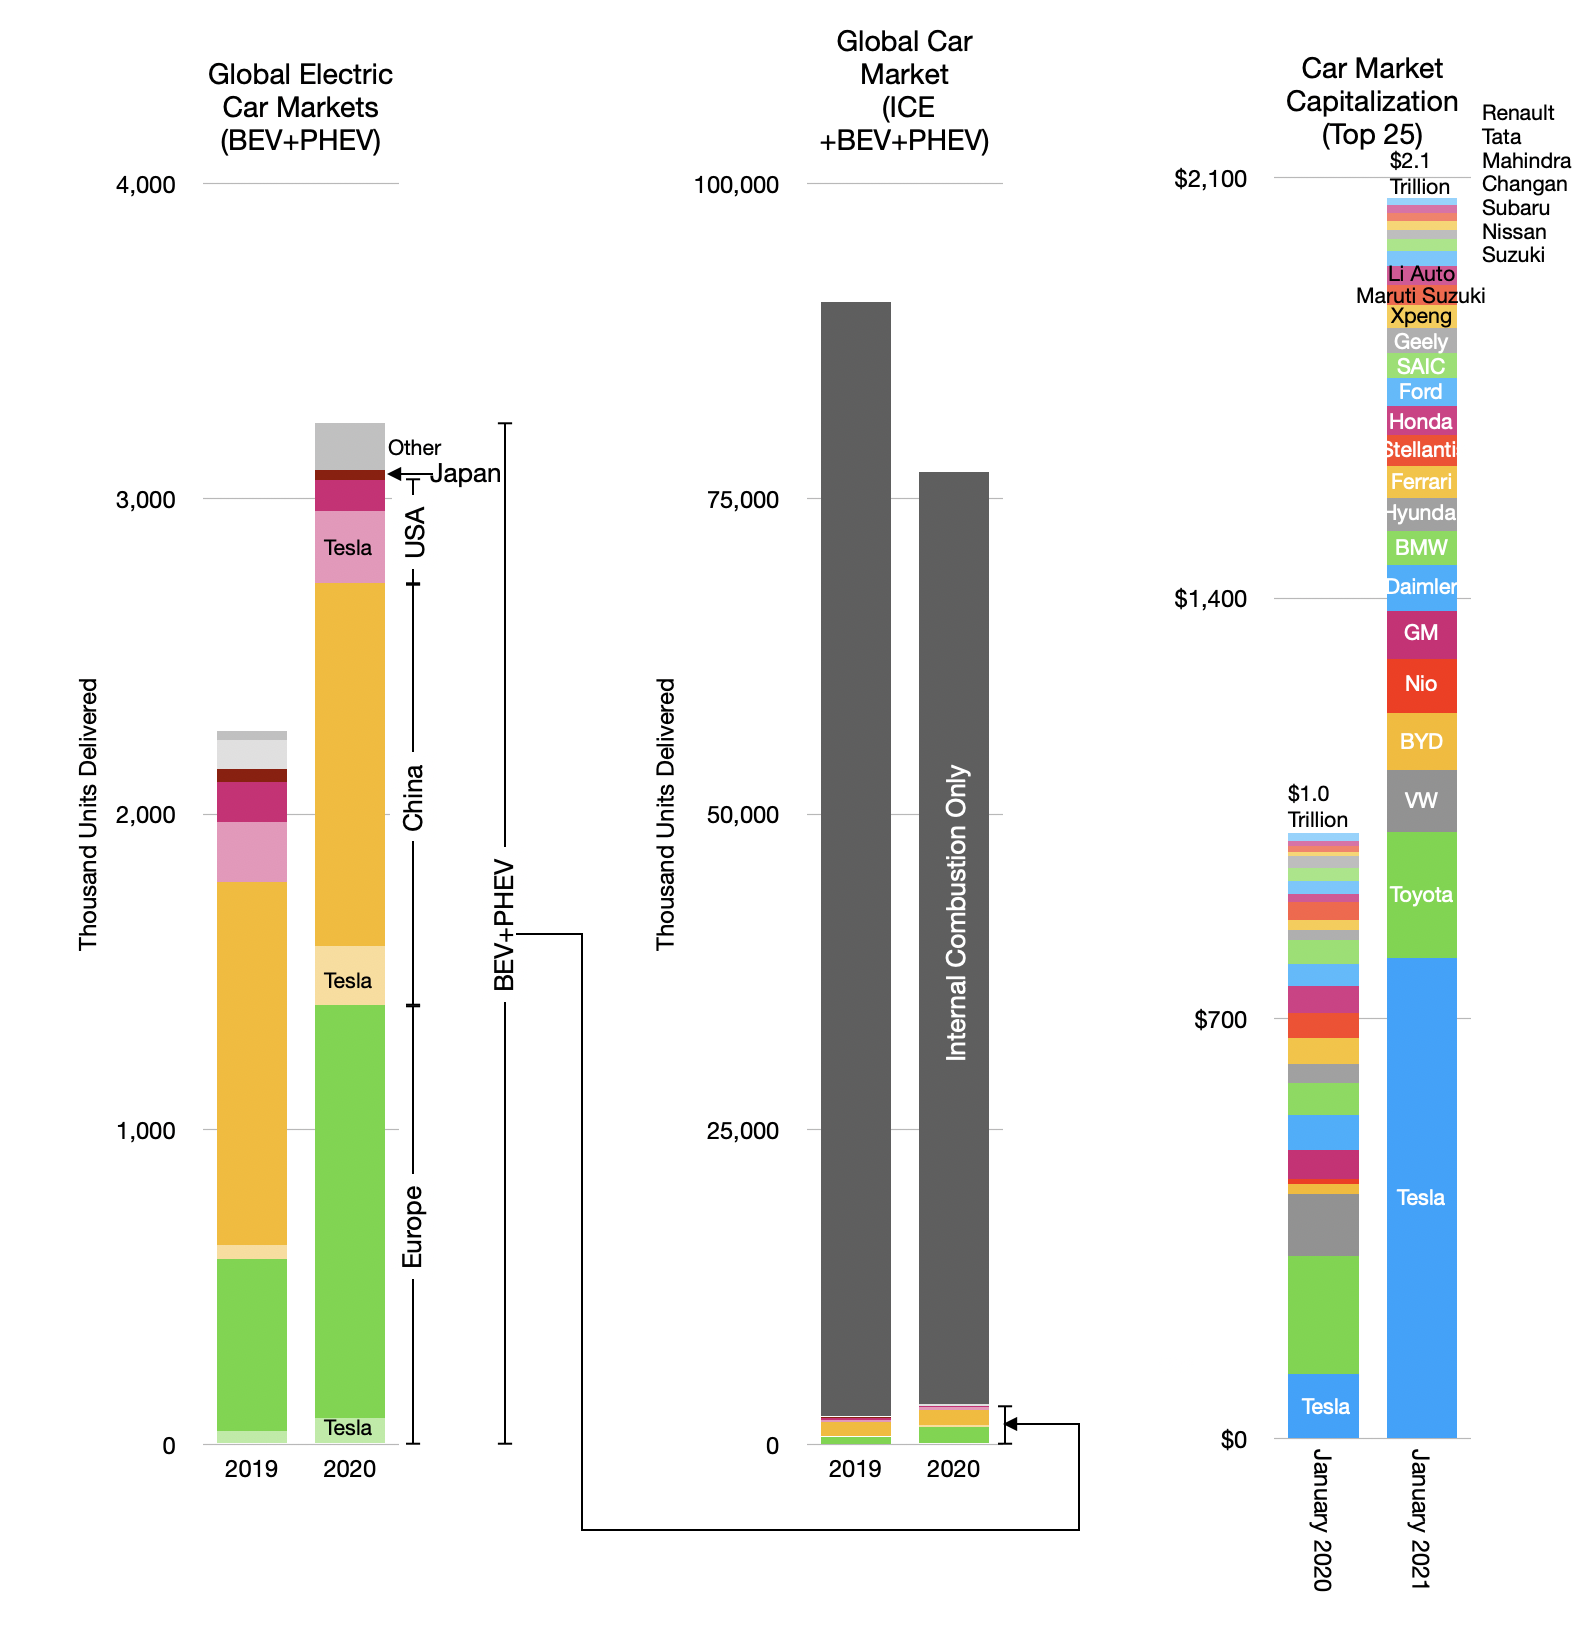
    Japan and "Other" countries aside, there was growth. But much remains to be done. The overall industry is far larger, as shown in the following graph.

    EV growth and global light vehicles 2019, 2020.

    Nevertheless, optimism abounds. With an increase in market capitalization of about 648%, Tesla is now the most valuable automaker in the world.

    Tesla, the champion EV maker has taken 17 years to reach 0.65% market share.

    Market capitalization of the auto industry (top 25 firms) and the market size (in units delivered).

    Actually, as the graph shows above, Tesla is now almost as valuable as the entire auto industry was a year earlier. But the rest of the industry did not collapse. The top 24 companies (i.e. apart from Tesla) increased their market capitalization from $901 billion to $1266 billion during 2020. That's a 40% increase during a year when sales fell by 15%. Quite an achievement.

    Overall the market capitalization of the top 25 automakers more than doubled from $1.0 to $2.1 trillion. This begs many questions, mainly, how would such profits ever be generated.

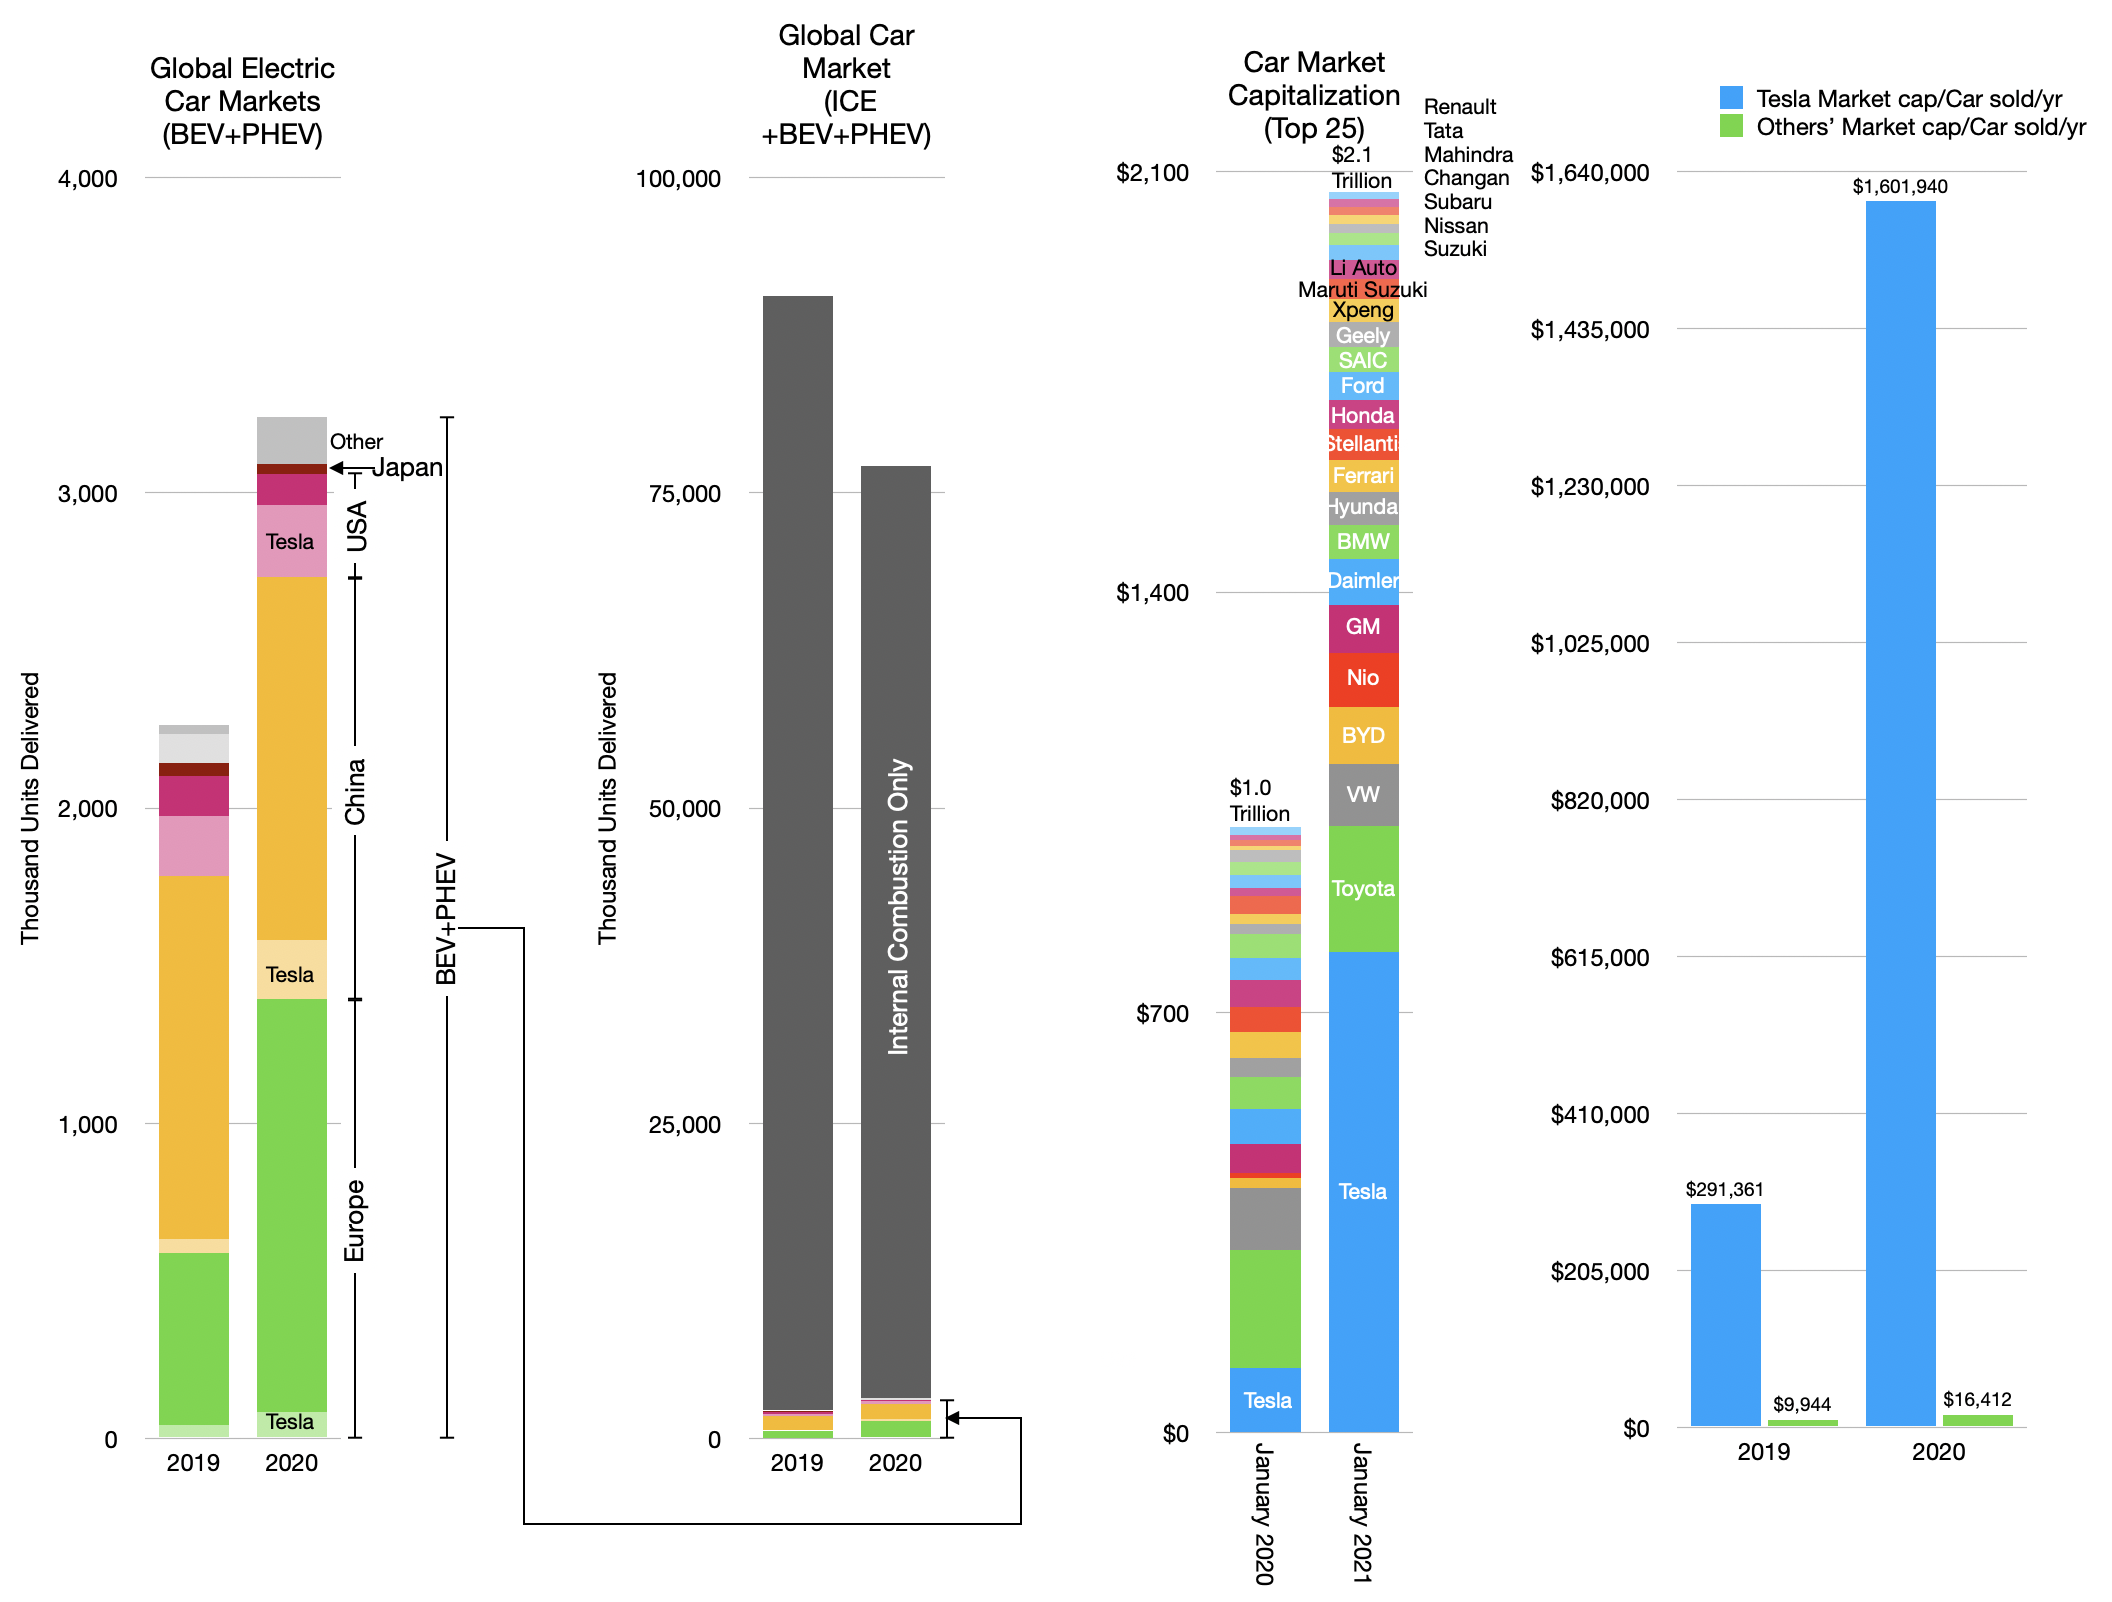
    To put a finer point on it, if we divide the market capitalization by units produced we get a figure of value that allows a historic perspective.

    A measure of valuation by units of production.

    Historically car companies were valued at $8,000/yr. 2019's value was about $10,000 which makes sense given some inflation. But the drop in volumes coupled to increase in valuation brought the ex-Tesla cap/unit to an eye-watering $16,400, a 64% increase in one year.

    Tesla's valuation is on a different level. It went from $291,361 to over $1.6 million/car sold. Roughly this is 100x rest of industry.

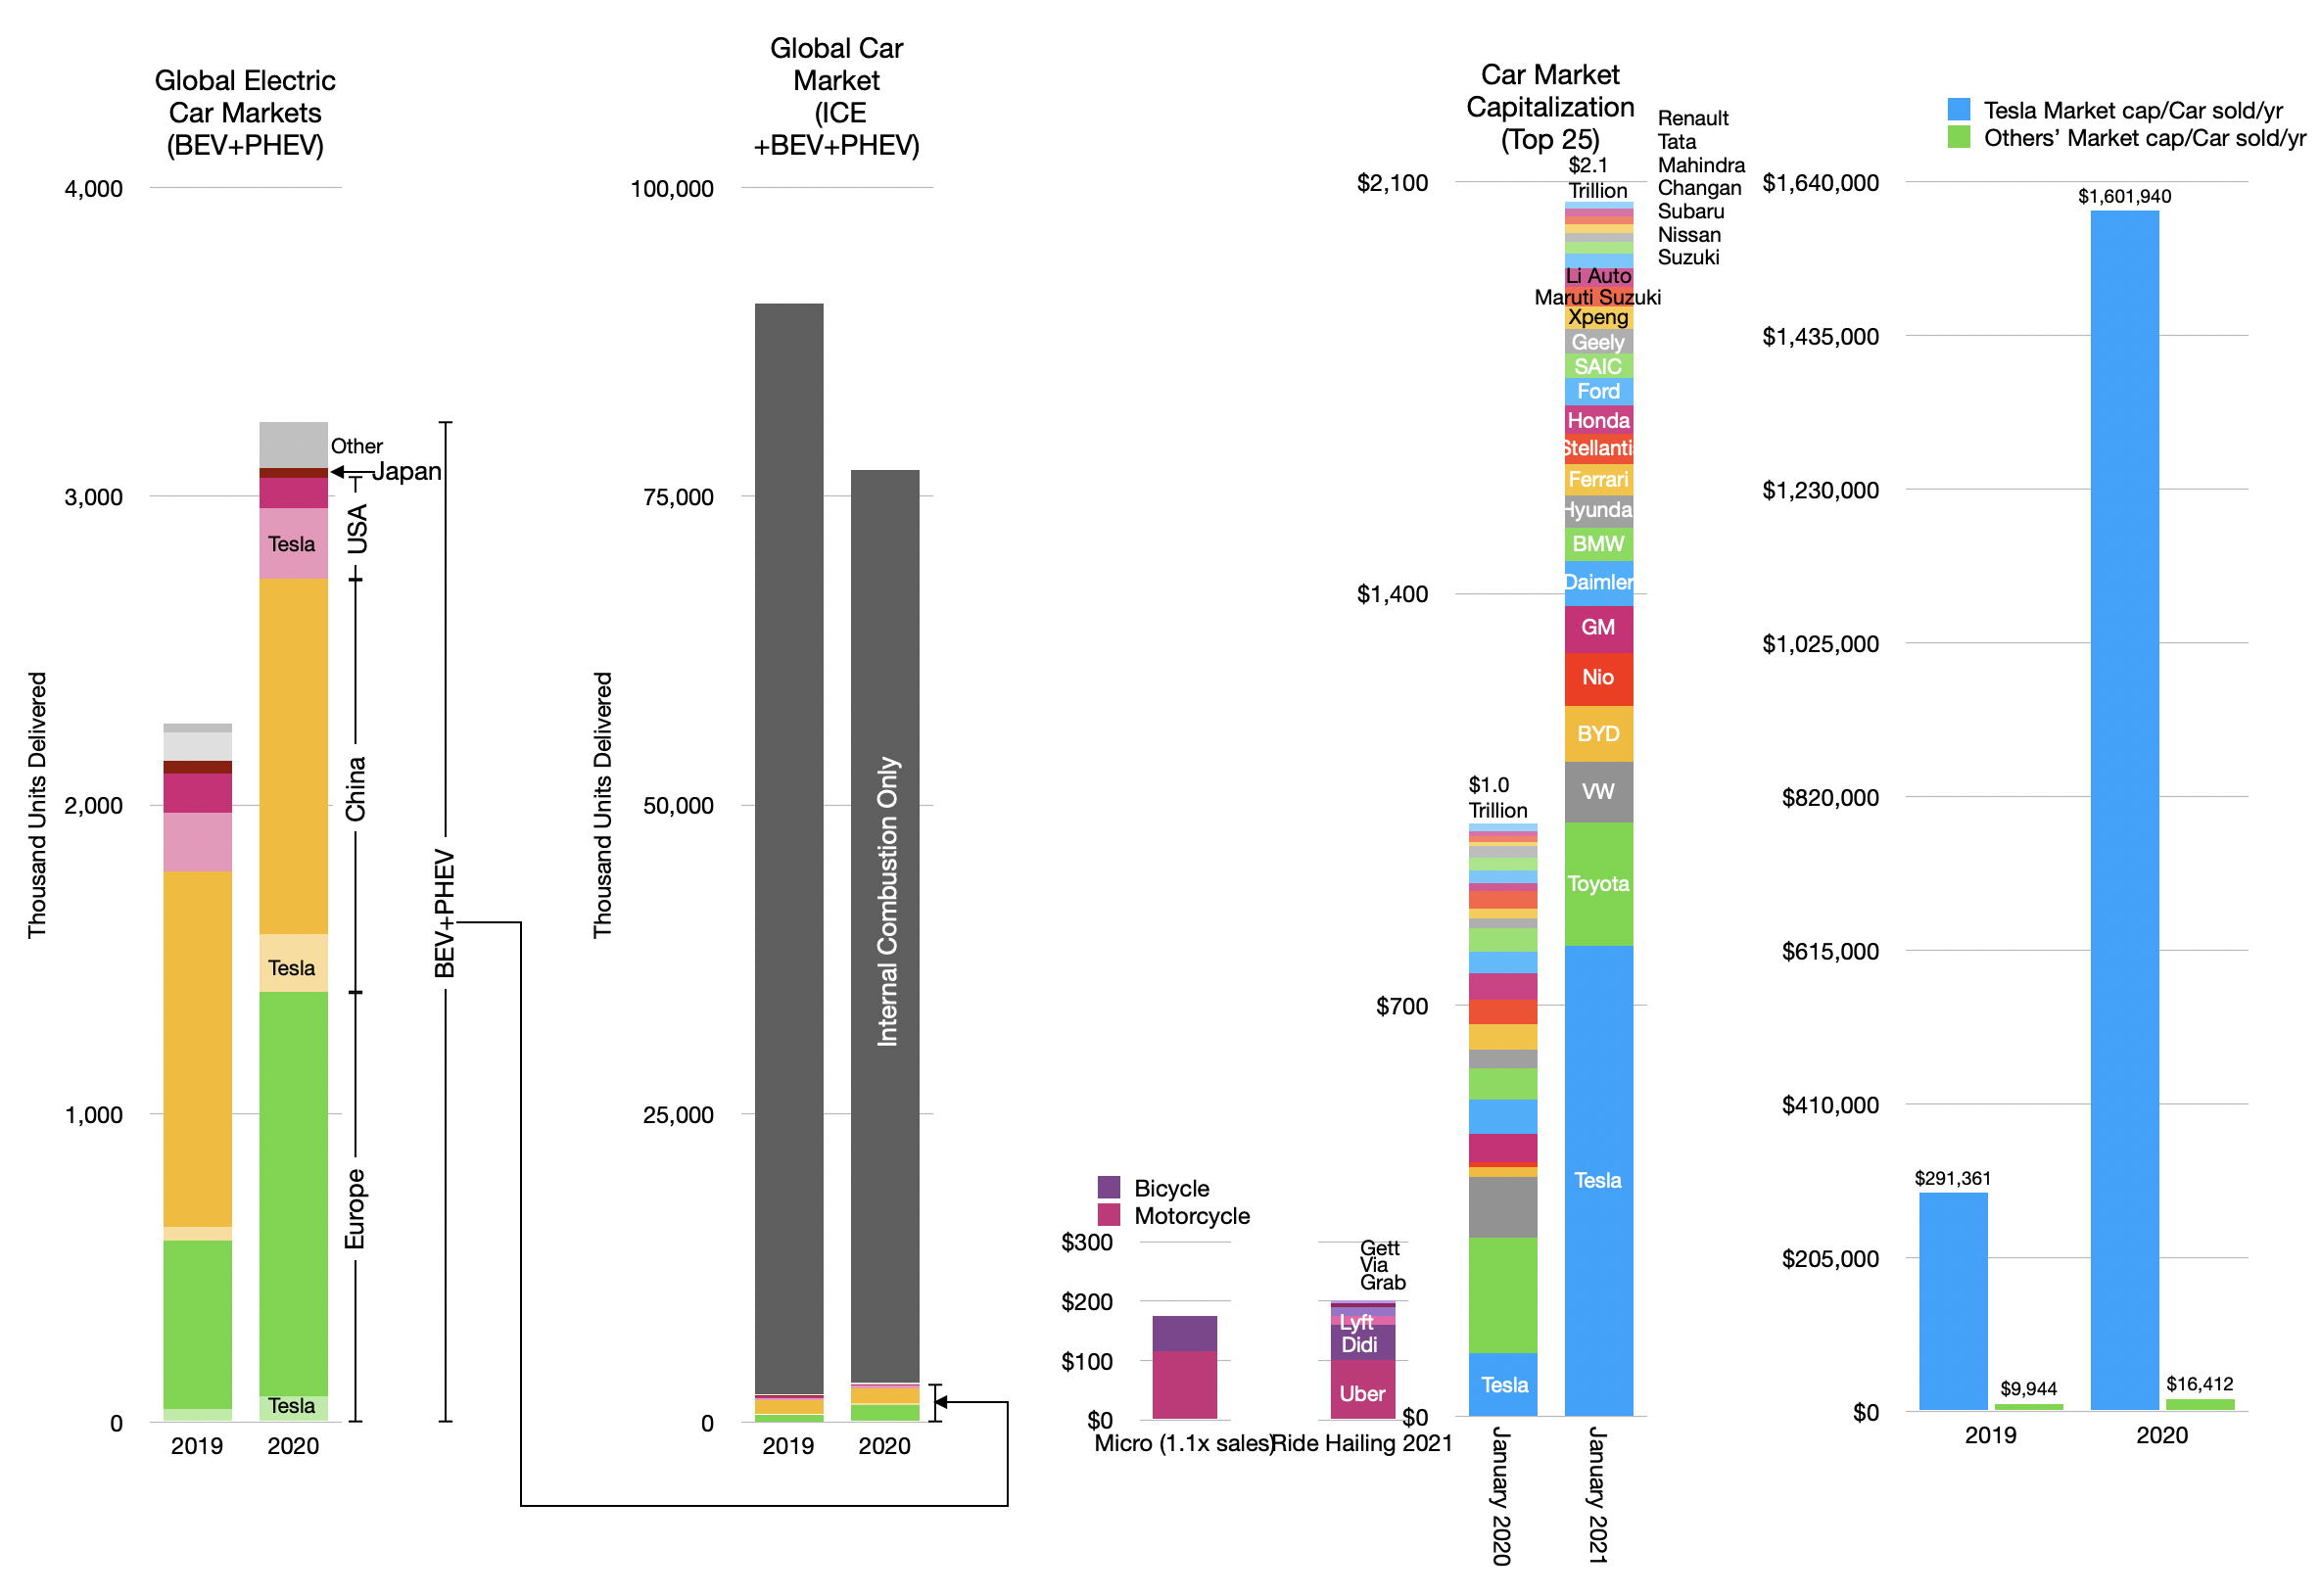
    But if we continue to pull the thread there's yet another story to consider. The car industry (i.e. making and selling and servicing cars) is not the only way to deliver "miles" to citizens. There are multiple "modes" and services that deliver transportation.

    There are also the ride hailing and micromobility which are positioned on different "jobs-to-be-done" than cars. The market capitalizations of ride hailing and micromobility are shown below

    Adding the value of ride hailing and motorcycles and bicycles.

    Note that micromobility is only measured by the value of motorcycles and bicycles whose markets are measurable and applying a 1.1 multiple to those sales yield a rough estimate of market cap.

    It's hard to get a measure on these jobs but I've taken to heart the idea that what you measure is most important in seeing what's next and have been dividing the "market for miles" into short, medium and long distance trips.

    The "Car Bundle Paradox": The demand for travel vs. value of modes for travel by trip distances.

    In the view above we get a sense of the scale of perceived value for businesses serving various trips. The inverted nature of valuation positioned on trips is, I believe, worthy of further analysis.

    As the car today is a bundle, the design and engineering efforts are directed at serving the longest of long trips (with the largest payloads.) But the demand is for short trips.

    If the car is to be unbundled (as the Personal Computer was into laptop, tablet, phone, wearables) then one can imagine that devices designed for short trips would accrue the value of those trips (and their popularity).

    The absence of value in short trips is a paradox. Or perhaps it's just an opportunity.

  3. On knowing the value of everything and the price of nothing

    Research · 52 comments

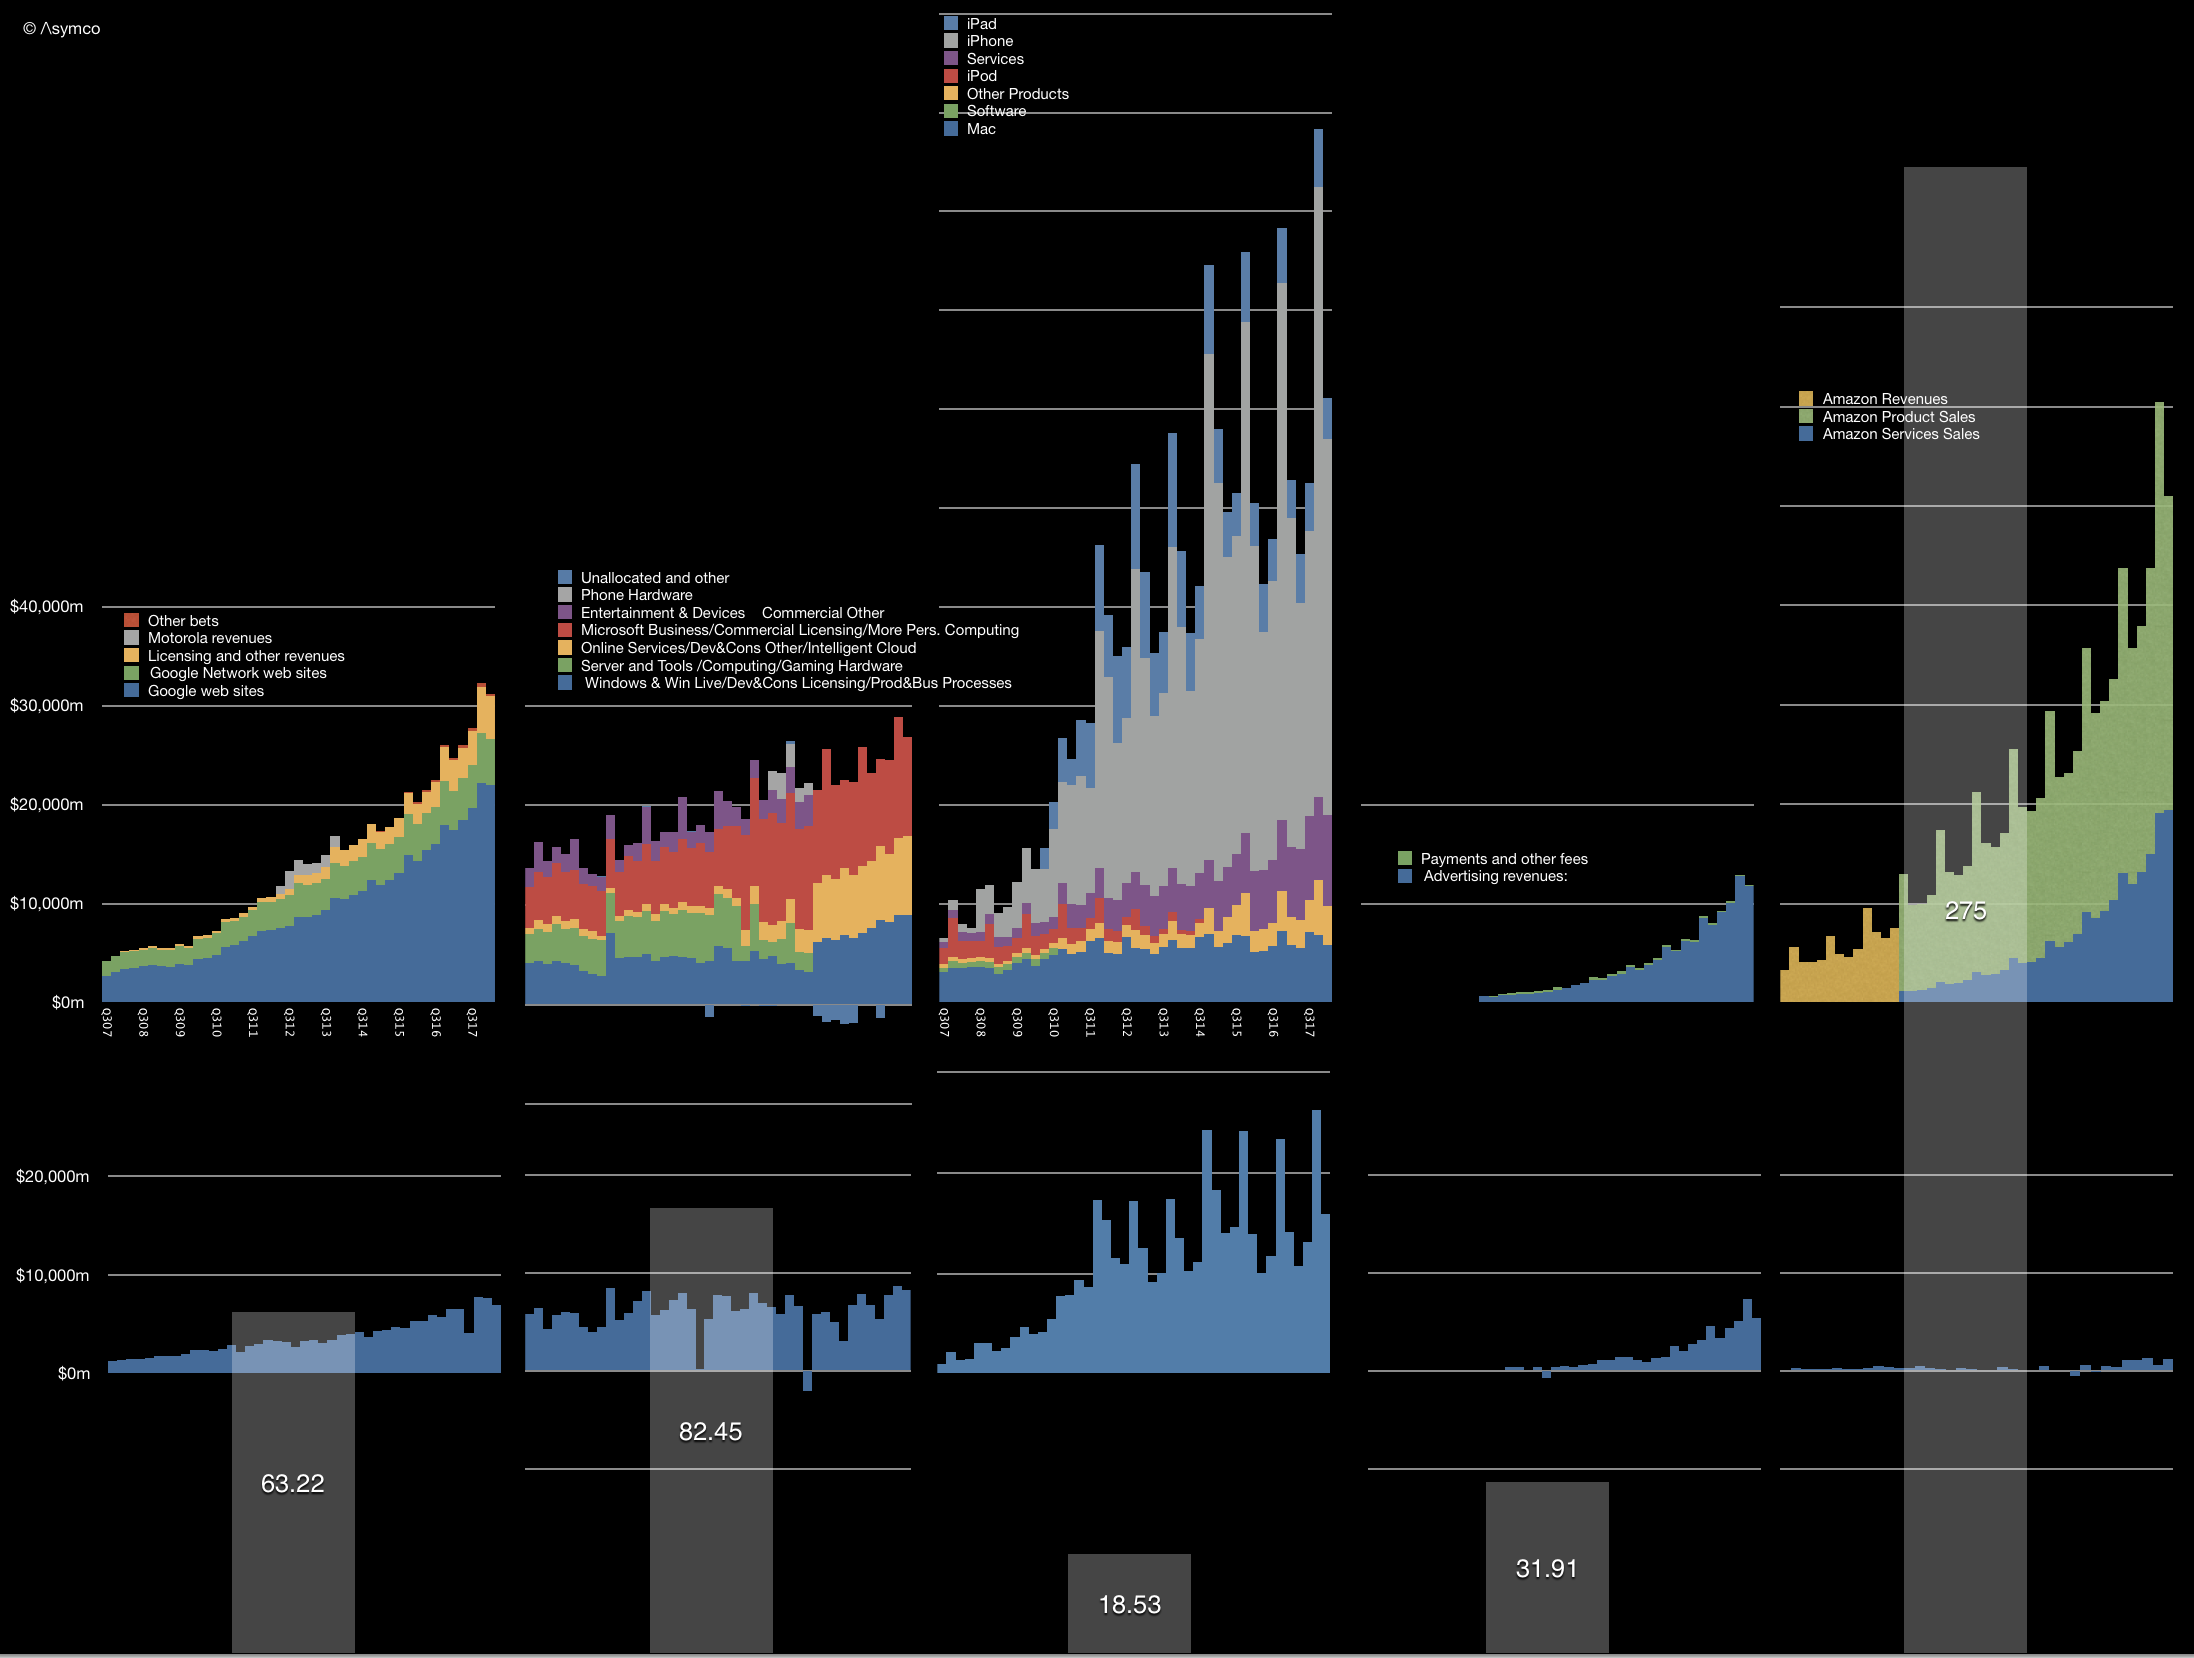
    At the latest Apple Summit in Los Angeles the question of Apple's valuation was foremost on many minds. The illustration I used there to discuss valuation is shown below.

    It shows the history of revenues (by reported segments) and gross margin for the five largest companies in the world by market capitalization. I have been publishing this illustration for five years ((initially with Samsung rather than Facebook because it was originally a set of "challengers" to Apple. The fact that with only one substitution the illustration turned into a view of the five largest companies in the world was a welcome surprise.)) in order to contrast the growth and perception of value between companies that might be considered comparable with Apple. Thus the graphs show the top and (near) bottom lines of the companies over an epoch of about a decade. ((This being the iPhone epoch))

    In contrast with the histories above, there is a price set on the equities today. These prices are captured by the market capitalizations as follows:

    Current market cap (billion) Peak market capitalization (Billion)
    Apple$918$955
    Amazon$844$856
    Alphabet$810$825
    Microsoft$780$789
    Facebook$584$589


    Market capitalizations are interesting because they show perceptions of value. The traders in the equity are negotiating with each other on what the shares are worth and, as a voting system in a liquid public asset, share pricing is very representative of the perceptions about that asset. Representative because there are literally millions of decisions being made on a daily basis which determine this price.

    The sales and profit data in the illustration above is about the past. In contrast the market engine is voting about the future. Any student of finance knows: the value of a company is the net present value of all future discounted cash flows (plus any current assets.)

    So what would history have to do with it? What use is the trajectory?

    This goes to a deeper question: How does history inform the future? What is the value in knowing previous performance when thinking about future performance? The common caveat in mutual fund prospectuses is "Past performance is no guarantee of future results". We are repeatedly warned of this because it is within our nature to look at history and recognize patterns. But beware! At least beware those whom you might entrust with your fortune.

    But consider that it's conventional wisdom to also say that culture and preparation are the best ways to ensure a prosperous future. Ask athletes or coaches and they will say that practice and dedication lead to success.  Sports fans know that a team or player with a record of success is more likely to succeed in the future. In this way sport is, in many ways, a simulation of reality. Which is why it's so popular: a metaphor of life teaches as well as entertains.

    Knowing how to read ability as well as conscientiousness are keys to scouting talent. Again, it's not a guarantee, but in various fields of human endeavor the past does predict, with high accuracy, the future.

    This relationship between past and future is what education is based on. We spend our lives preparing and training ourselves and our children and their children with the implicit hope that this leads to better outcomes for everyone. We establish a pattern of success because it is the best predictor of future success. Practice, learn, commit, defer satisfaction, trade time for knowledge, fight, lose and try again. These are the qualities we look for in the past of individuals when assessing their potential for the future. Culture is everything, we are told. Build a track record, we tell the young.

    So what does this have to do with valuation?

    We can't easily measure the cultures of persistence and perseverance in companies. Grit, guts, stoicism, fortitude, courage, the Finnish "sisu". These are not measurable in financial reports. Yet our language is as filled with words to describe character and our financial reports are empty of them.

    It's left to investors to work it out. The exercise of relating the future to the past is the calculation of the ratio between Price (future) and Earnings (past). A high P/E ratio suggests repeated success from past success. A low P/E is a disbelief in a future repeating the past.

    The P/E ratio thus allows us to say to what degree recent past performance is repeatable. I.e. how many `last years' can we expect in the future. A P/E of 1 means a company is worth what it earned last year. A P/E of 10 means it is worth ten years' proceeds. ((We could easily calculate P/E for more than one year but the default is one year.))

    This P/E ratio is shown for the five companies above as the overlaid bars in the graph above.

    Sure, you say, but it depends on the industry and circumstances. A future divorced of the past is more likely in an environment where there is rapid, chaotic change. The more volatility in fundamentals, the more uncertainty. Technology is changing rapidly and therefore it's quite possible that Apple's low P/E reflects this disconnect.

    If so then what about its peers? Why would Apple be subject to different technological risk than other technology companies? All of the top five companies are considered "tech". Indeed, Apple is perhaps the least technologically oriented as it has a brand and consumer orientation. It operates hundreds of stores, and sells design as much as it sells algorithms. It fundamentally tries to deconstruct human needs and package those needs in products.

    Alphabet, Microsoft and Facebook primarily don't "sell" to end-users. The revenues come from businesses in the form of advertising or licensing. They don't have support staff, interacting with people who buy what they use. They need to understand needs but they trade other things. And Amazon offers AWS to enterprises as its own unique product. Other than AWS it operates a marketplace, acting as an intermediary.

    Apple is a consumer company depending on consumer tastes as a brand. This is more typical of a non-tech company in a boring business of consumer brands.

    But it's not valued as either a tech company or a consumer company. Both have typically higher P/E ratios. In fact, Apple's P/E ratio is lower than the S&P 500 and has been below that level for almost the entire history of the iPhone, regardless of growth rate.

    A track record of hit products and the stability of a brand seem to be of no value. Perseverance, consistency and stability are not valued. If it were an athlete with a track record of world-record performance and a spectacular reputation with the public, it would not be granted an above-average pay for its performance.

    In the past I've argued anti-fragility as a cause. In the context of the other companies, Apple is at the center of perceived vulnerabilities and is thus perceived as vulnerable . The other four are at the center of no competition and perceived as invulnerable. And yet Apple, so far, has survived. So have the others, but apart from Microsoft, they are much younger. I argued that Apple exhibits anti-fragility and has unrecognized robustness. Perhaps Warren Buffet now agrees and this is encouraging to the thesis.

    Yet, at an even deeper level, in Apple's valuation we see how culture is not valued. How the idea of character assessment is not applied to businesses. How ethos is unquantifiable and thus discounted. How markets, accustomed to weighing things, reflective of collective human judgement, demonstrate that we are woefully incapable of valuing that which matters most.

    Oscar Wilde famously said that the cynic knows the price of everything and the value of nothing. Here's to the sentimentalist, because at the end of the day those who change the world know the value of everything and the price of nothing.

  4. Other Products

    Research · 6 comments

    From the way Apple reports its revenues you might think that the company has several operating segments. There are the iPhone, the Mac, the iPad for which units and revenues are reported. Then there are Services and Other Products for which we have revenues only.

    Services is a collection of all non-hardware revenues and is (finally) being recognized as a non-trivial business. With reported revenues of $26.6 billion in the last twelve months, it's big enough to be a Fortune 100 company and set to double in four years. ((Although a non-zero business, the valuation of Services continues to confound observers who cannot separate it from the hardware businesses it attaches to--which themselves are considered near commodity value--thus paradoxically valuing the overlying asset of Services near or precisely at zero. Incidentally, Facebook is Fortune 98 at $27.3 billion and it is also one of the top 5 largest business by market capitalization.))

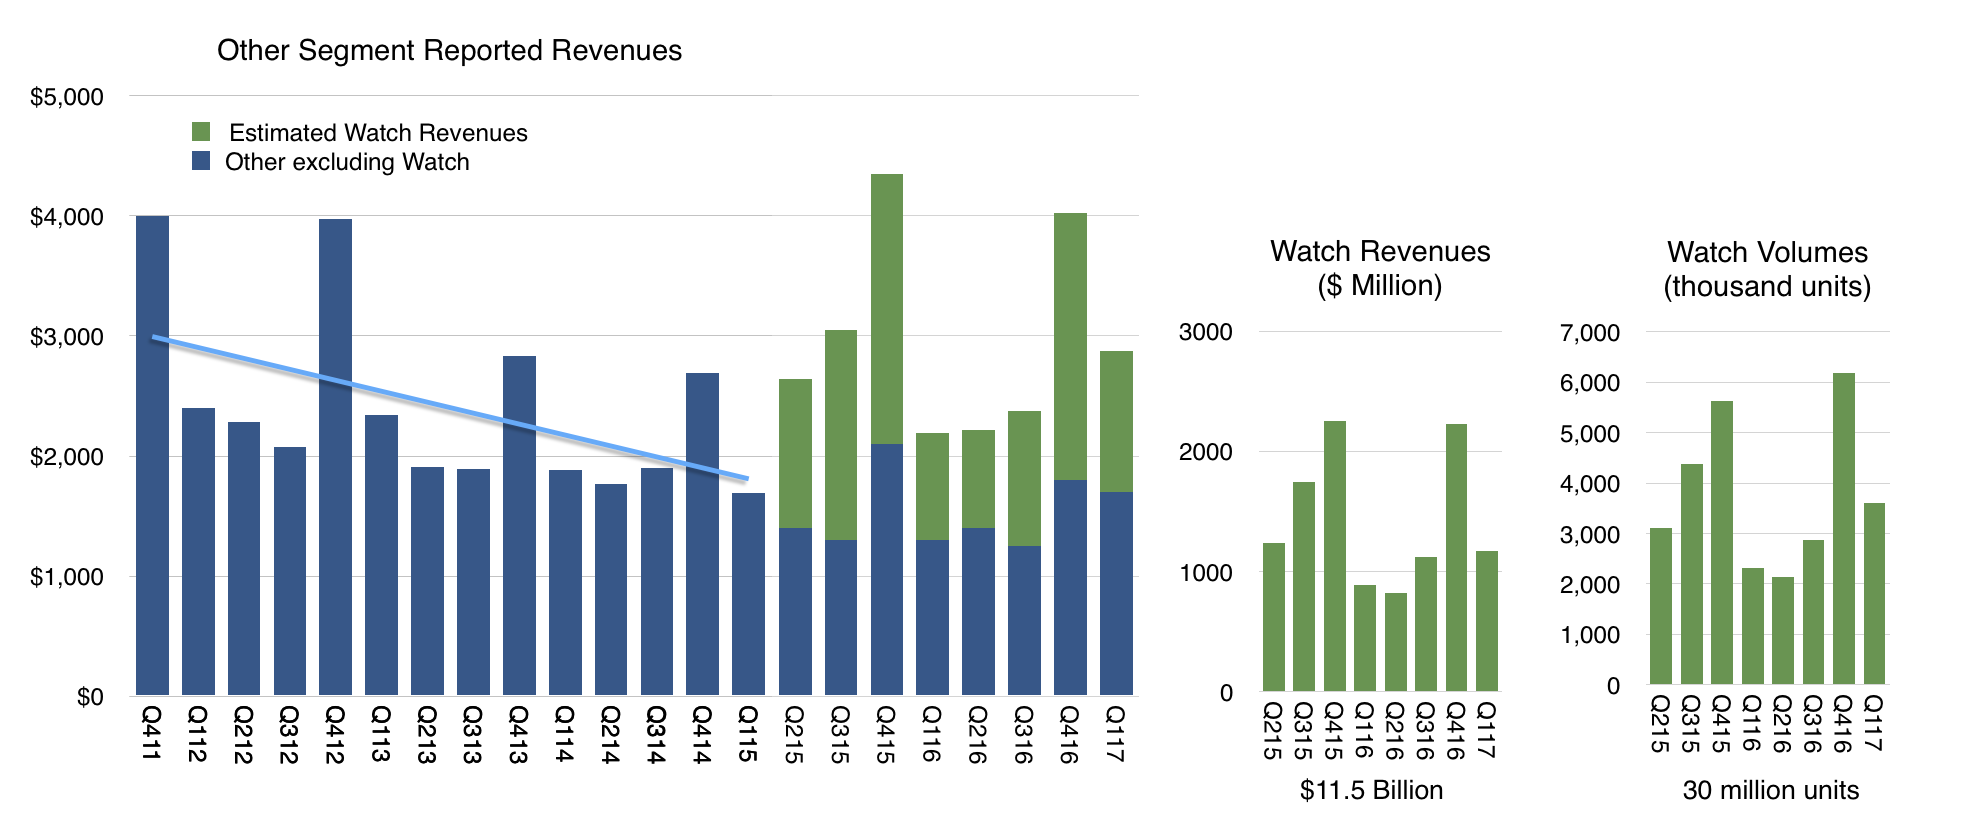
    That leaves "Other Products" which now becomes the revenue segment that is  "most likely to be ignored." This segment had revenues of only about $11.5 billion in the last 12 months which would place it at only a Fortune 245 ranking, equivalent to a Toys "R" Us or Biogen. How should we value Other Products?

    Other includes many hardware products including iPod, Apple TV, Beats, Apple Watch, AirPods and, soon, HomePod. Each is a significant product, with Watch probably the largest single contributor. But since we don't have specific unit numbers, we are left guessing at the contribution of each.

    The Watch itself has been a point of scrutiny as it could be initially teased out of the mix through an observation of the before-and-after launch vs. trend-line as shown below:

    This separation of Watch became harder to discern after the launch of AirPods. Though they are still very hard to obtain, they might be "moving the needle" by now with a contribution that would muddy the Other category further. Same with updated Beats headphones.

    This separation will be harder still with the launch of HomePod later this year. This product is priced at a point similar to the Watch and the quantities sold will be very hard to estimate without Apple's revealing of actuals.

    Fundamentally however, all the "Other products" will have a common relationship to the iOS and MacOS hardware: attachment to and integration with a "parent" platform. Apple TV might be stand-alone but I strongly doubt there are many sold into offices or households which don't have iOS usage.

    This means that "Other Products" are very similar to "Services" in that there is a dependency on a primary platform and, as it has been argued, they are therefore fragile. If the core platform declines then the Services and Other Products decline as well.

    Given this dependency it makes little sense to carve these categories out as separate businesses. They cannot stand alone. They are very much the "children" of the parent platforms.

    This is why it's assumed that Services, (a Fortune 100 company) and Other Products (a Fortune 250 company) can be discounted to zero. By focusing attention on the iPhone one can capture all the essential value of Apple. This is in contrast to the "sum-of-parts" valuation that could be applied to a set of independent business units in other companies.

    And yet I started this discussion with the point that you might be tempted to look at Apple on the basis of these reported revenue segments. The choice of what Apple reports is arbitrary. It could report no segment revenues at all and publish just one revenue number. This is roughly what Google Amazon and Facebook do. Or it could report segments in some other way. For instance, app store revenues and AirPods could be reported as part of "The iPhone Division". Or maybe it could bundle all iOS devices and services and accessories into another segment called "The iOS Group". Or it could create a "Devices group" and a "Personal Computing" group. Microsoft famously shuffles its revenues into creative segments based on various organizational structures or choice of what it wants to project as its focus.

    There is no limit to the ways Apple could slice revenues into segments. The reason Apple does it the way they do is mostly due to historical reasons. The company used to report the iPod separately as a segment but it no longer does. It also used to report Software separately, because, presumably,  it charged for it but now it no longer does. It also separated laptops or portables from desktops.

    The current reporting system is tempting us to draw certain "business unit" conclusions. These boundaries are illusions because Apple does not have business units. It has only one Profit and Loss statement (P/L) and is organized functionally. There is no "head of iPhone" or "head of Mac" responsible for each siloed revenue and cost structure. Instead, the entire business should be seen as a whole because it is managed as a whole.

    This is easily evident in how the products are designed and marketed and how they are engineered. The iPhone may spawn AirPods and AirPods may have no value outside the iPhone but the iPhone is valuable precisely because it has AirPods and Apps and Music and iCloud. And Apple TV, and HomePod and whatever comes next. The reason the iPhone can be sold at three times the price of competitor products is because of the Services and Other Products and iPad and Mac symbiosis. This integration drives the satisfaction, loyalty, price and brand value. There there are the Apple Stores and the launch events and the countless details that make up the ownership experience.

    The fact is that you can't slice and dice Apple.

    There is one Apple and it must be analyzed as a unitary entity. That analysis is therefore difficult. It is easy to pick up the numbers given and study them in isolation. The iPhone, the iPad, the Mac. We all do that.. However we miss a great deal in doing that.

    The lesson is that data we obtain leads us to see something but it also blinds us by taking attention away from what we cannot see. All data lies by omission. That which is left unmeasured may be where all the truth lies.

  5. Apple Assurance

    Research · 42 comments

    Apple is categorized as a vendor of consumer electronics. More specifically, a member of the "Electronic Equipment" industry in the "Consumer Goods" sector. If indeed this is what it's thought to be selling, there is a problem because it isn't  what its customers are buying.

    Apple's customers buy a mix of hardware, software and services under a brand that assures a certain quality of experience. This bundling and integration of otherwise disparate things is why the brand is such a success.

    This anomaly between what Apple is thought to sell and what buyers actually buy can leave the casual observer confused. As a result the company's categorization as vendor of hardware deeply discounts its shares. It is, in other words a less valuable business. This is because a seller of consumer electronics does not benefit from "system valuation" since there is minimal loyalty to the product after the sale.

    The consumer electronics vendor has no network to leverage, no ecosystem adding value after the sale, no platform and works through multiple levels of distribution to reach the customer. In contrast, a system vendor can expect benefits from network effects, ecosystems, and a coveted relationship with the end user.

    The result is that the valuation of a consumer electronics vendor is based on the momentum of individual products. Apple has always been valued this way. Each hit product is considered to be a stroke of luck/genius and the chances of recurring are discounted to about zero. Regardless of the fact that it has a track record of "home runs", Apple's hit rate is not considered sustainable. ((The P/E ratio is the primary indicator in this analysis)). Certainly Apple is not valued as being able to generate reliably recurring revenues.

    But what if we were to value Apple on the basis of what people are buying rather than what it's thought to be selling?

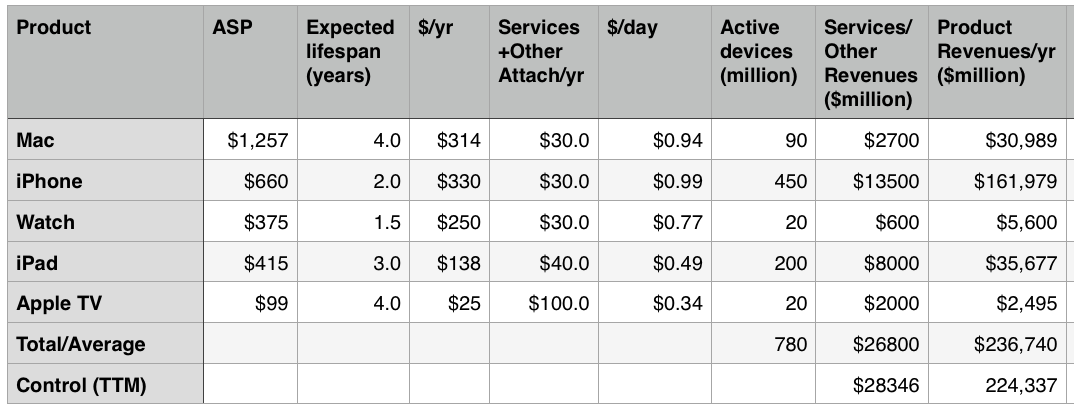
    The model is simple enough: determine the number of users, estimate the lifespan of the products, and figure out the services attached to the products; then, given the price, obtain a price per product per day. You then can get a recurring revenue figure.

    I did just that and the results are in the following table:

    Screen Shot 2015-09-15 at 5.13.27 AM

    The first column is the product, the second is the Average Selling Price (ASP), the third is the expected lifespan of the product, and the fourth column is a calculation of the end user’s “spending per year” on the product.

    The fifth column is an estimate of the revenues from Apple's Services and "Other" groups from post-sale revenues attached to the product. This Services revenue includes AppleCare, iCloud, Music, App Store, other stores, Beats, accessories, iAd, and Made for i (MFI) licensing. It also includes Google traffic acquisition revenues and other licensing.

    The sixth column is an estimate of the consumer "spend per day" on Apple's product lines taking into consideration Services.

    The seventh column is an estimate of the number of active devices in the hands of users. Note that these are expected to change over time.

    The eighth column is a calculation of Services/Other income on a per-product allocation. This is a test of the Services+Other estimate and is meant to sum to nearly what Apple currently reports as Services+Other revenues.

    The ninth column is a test of overall revenues on a per-product allocation. This should add up to total revenues (estimated for next year.) ((Naturally, the active devices estimate is the most sensitive but it should be tweaked to create a reasonable forecast for next year.))

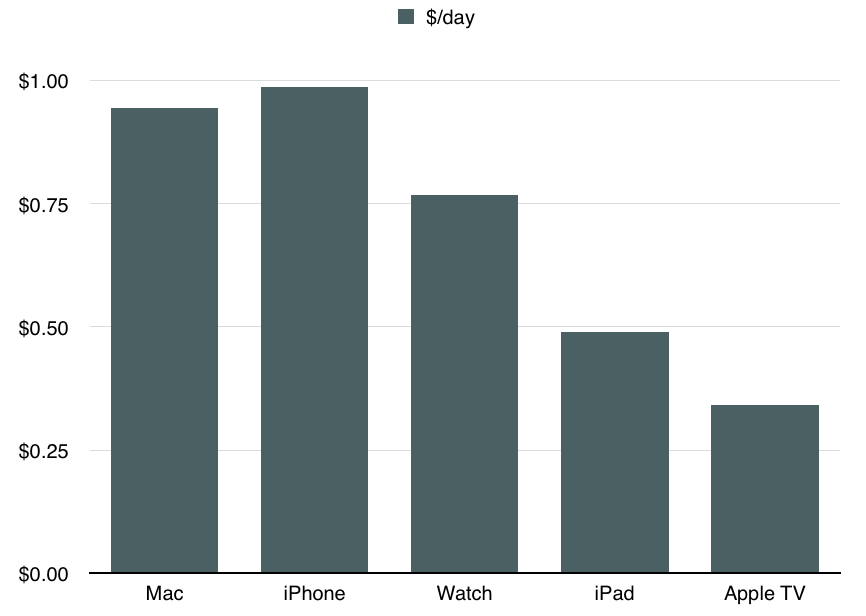
    The bottom line is the following graph which shows the revenue per device per day inclusive of Services and Other income (The sixth column).

    Screen Shot 2015-09-15 at 5.22.23 AM

    This is, in my opinion, a reasonable way to approach valuation of Apple as a business. It's also a way to inspect its strategy.

    As a valuation we can easily obtain the net present value. The model gives us sales and by estimating a net margin (which is remarkably steady around 22%) we can get the free cash flow.Iterate into perpetuity with a discount rate, and you can get the net present value of the company. With a modest growth rate leading to a billion active devices in use and a normalized revenue per device of $0.92 you can easily see cash flows equivalent to $1 trillion in present value.

    But much more interesting than this value is the notion that Apple is in business to deliver a product/service mix to loyal customers and to preserve their loyalty through constant improvement and innovation. You can see strategic intent in increasing the attach rate of services per device. You can see a strategic intent in building loyalty and the right customer base which is likely to be loyal. You can see strategic intent in the iteration of the product in a way that extends loyalty and expands the solid base but also increases the $/day rate. This analysis correctly informs almost all decisions the company makes.

    What we just saw in the launch of a new Apple TV and a new iPad is consistent with this strategy. Apple TV will have a higher service attach rate with apps while keeping pricing well below consoles thus expanding the user base. The iPad is increasing in price and getting more accessories. The developers are encouraged to build richer and more valuable apps that are uniquely enabled by the new device.

    The fact that Apple has just launched a subscription service for the iPhone  makes what was clearly their strategy all along plain to see however it has been a strategy in effect for decades.

    It isn't a difficult idea to embrace. It always surprises me that it's not more commonly held. The reason may be that Apple is mis-categorized.

    Or perhaps the entire categorization of industries and sectors is obsolete in what is a new post-industrial age. Some have figured this out already. Others will take longer.


  6. Unicornia

    Research · 14 comments

    Unicorns typically are valued on the basis of number of users. While they are not yet monetizing those users, their growth and engagement metrics are expected to be off the charts. As there are no revenues (or profits) the $billion valuation hinges on a nominal value of $/user. That figure is based on comparable companies (e.g. Facebook) which do monetize their users.

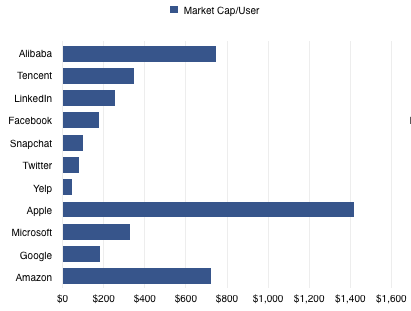
    Since the unicorn's capitalization/user defines its valuation, which company should be considered comparable? Unfortunately they range widely. There are many alternatives. The graph below shows a few Market Cap/Mobile User rates ranging from $45 for Yelp to $747 for Alibaba.

    Screen Shot 2015-05-15 at 5-15-2.47.16 PM


    Note that I've also added companies which may not be considered as unicorn comparables because they are not usually valued on a per-user basis. Apple, Microsoft, Google and Amazon are priced by product sales, typically. However, most of them operate and self-define as service organizations. Microsoft has been "monetizing users" for decades using a recurring revenue model. It has a "SaaS" business logic for most of its revenues. Google ((Google users are estimated at 2 billion active Android/GMS devices)) likewise. Amazon reports its active users every quarter and obviously is measuring itself by that metric.

    Apple ((The assumption here is that Apple has 520 million active users which is based on iOS devices in use estimates)) is the least likely to be seen as a company whose value is a function of user base. Nonetheless it behaves entirely on that basis. The company's entire strategy depends on satisfying its customers and building its brand which can only have one outcome: loyalty and repeat purchases. The services and software they offer can be seen as supporting that brand loyalty which is converted to profit through an above-average selling price.

    Being mature of business model therefore does not exclude a company from being valued like all the kids are these days.

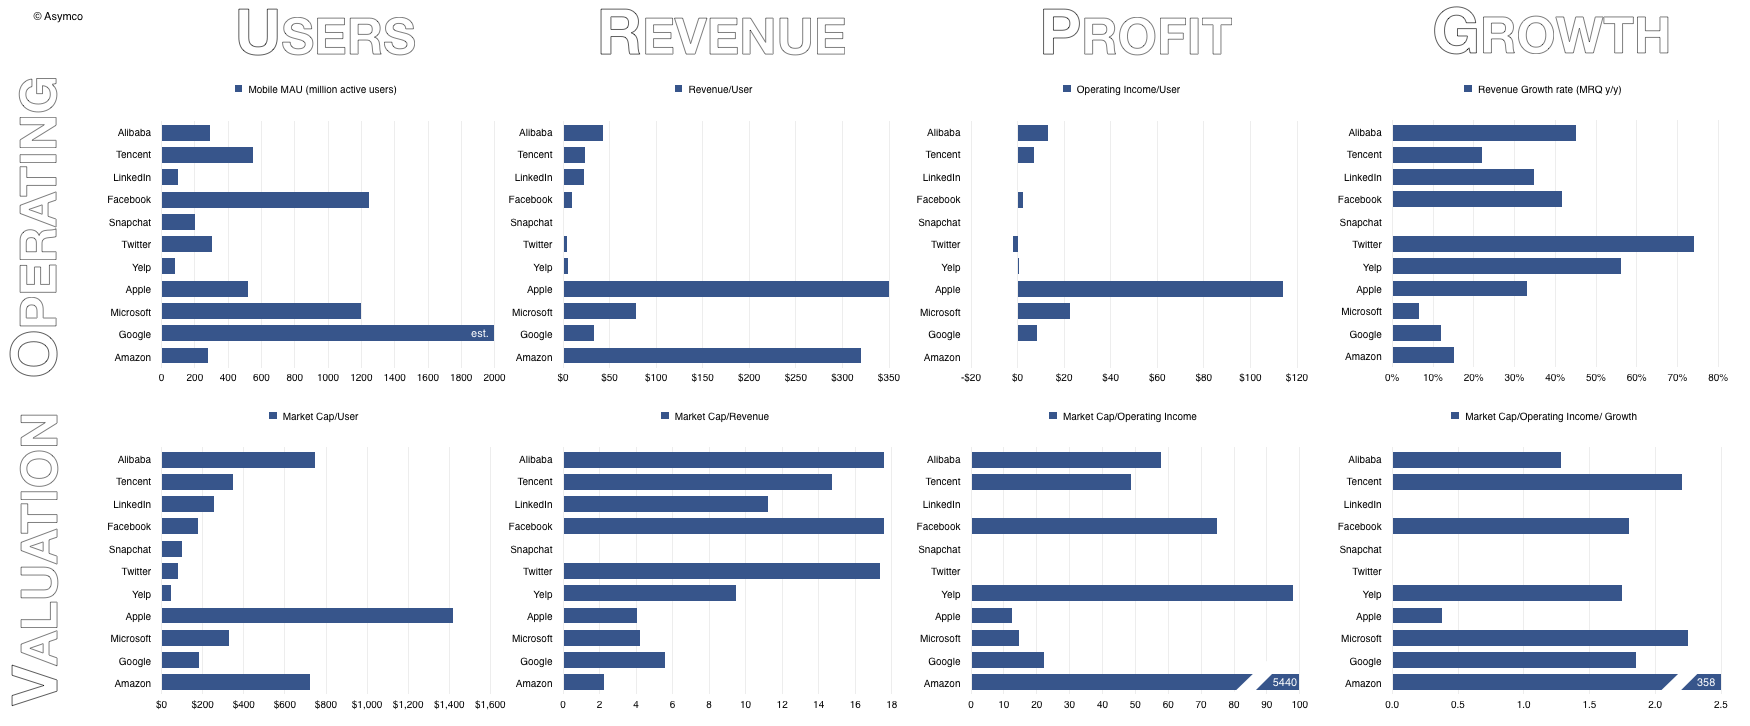
    So, if we do look at the value/user metric we might as well look at the revenues, operating profit and growth data.

    Screen Shot 2015-05-15 at 5-15-3.09.43 PM

    Unicorns are therefore characterized as having negligible revenue or profit but significant growth. The growth of Alibaba, Tencent, LinkedIn, Facebook, Twitter, Snapchat and Yelp should be seen in the 50% y/y range. The growth of mature companies is more modest: Microsoft (<10%), Google (12%), Amazon (15%).

    Apple is an exception with recent growth in the 30% to 40% range.

    Markets therefore value internet services at multiples of 10 to 20x revenues and 50x at least in terms of operating income. These multiples don't yet apply to Unicorns, since they typically don't have revenues, but the expectations are typically in this range once they do.

    Mature product companies are valued more cheaply with 2x revenues for Amazon (a retailer with zero margins) up to Google with near 6x. Apple and Microsoft are in the middle at 4x revenues.

    Mature company value as a function of income is also much lower ranking from about 12 for Apple to 22 for Google. Amazon's multiple is astronomical only because it has almost zero income.

    Finally, when considering growth and income together ((When seen into the future this is the PEG ratio or Share Price/Earnings/Growth. When seen into the past, this is the PETG or Share Price/Earnings/Trailing Growth)) both emerging services and product companies are priced between 1.3 and 2.5. The outliers are Amazon due to its lack of income (PETG of 358) and Apple with its enormous income (PETG of 0.4).

    This last ratio has had a "rule of thumb" of 1.0 being the "fair value" with <1 being seen as under-valued for growth and >1 being over-valued. Alternatively it can be seen as either pessimism about sustainability or optimism, respectively.

    Clearly Unicorn Mania (or Unicornia) is a reflection of an optimism around new market disruptions in many industries where software has suddenly become ingestible.  Old-school software companies are seen as less exciting in this context. If only they could take part in these new market creating opportunities then maybe they too could benefit from this optimism.

    Now that would be crazy talk.

  7. Apple at $600. Who knew?

    Research · 91 comments

    Apple's share price has increased rapidly in the last few weeks. The rise to $600 was swift and broke the pattern of slow growth the the stock was able to obtain over the past few years. The level, however, shouldn't have been a complete surprise.

    I think Apple is going to $600...It's really not that complicated. Apple has a number of key drivers in its business model which have yet to be properly priced into the stock because I think it's very cheap at this level.

    -Stephen Coleman, chief investment officer at Daedalus Capital

    This prediction was made October 26, 2007. On that date Apple's share price closed at $184.7. It may have seemed like a bold bet, but as Coleman noted, the reason why it would reach $600 was easy to spot.

    The real story on how I get to that valuation doesn't even involve the sale of (the Leopard operating system) or the growth in the Mac business. How I get there is through the iPhone itself.

    What was not easy to tell was when it would reach $600. Back in October 2007 the stock had a P/E ratio of 48. It's PEG(trailing) was 0.65, and cash per share was $17. Sales were $6.6 billion for the quarter and earnings were 98c/share. If an analyst were to take those ratios and apply a forecast of sales five years hence, the $600 price would have been reached much sooner: Sales had tripled by 2010 and earnings had tripled by 2009. In contrast, the stock took until 2012 to triple.

    The delay of one or two years is perhaps reflecting the risk involved in investing. Namely, you can predict outcomes but not their timing.

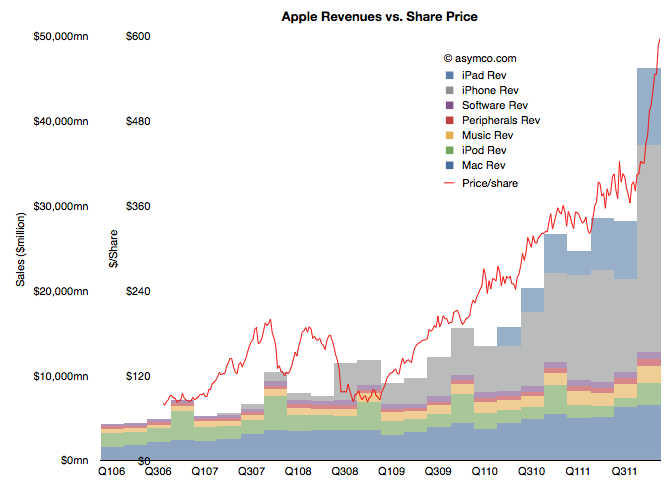
    But still, we have to return to the question of why the stock has rallied in the past few weeks. There has been no new information about the company since it reported earnings and any product launches (e.g. new iPad) or increased distribution (China) are completely predictable.  Curiously, the market did not react until late in the quarter. The following chart shows the phenomenon.

    (Note the two scales on the left: inner is share price, outer is net sales)

    It shows the share price as a line superimposed on the sales chart with stacked product revenues. The recent rise can be attributed to the rise in revenues/earnings from the fourth quarter. But why would a stock react in March to data from six months earlier (and published two months earlier).

    Classical market theory suggests that markets anticipate and "discount" the future. Efficient markets supposedly react to all available information and do so instantly. If that was the case, the chart above would show the red line shifted significantly to the left.

    What we are observing is market inefficiency.

    Inefficiency implies that perception of reality is not the same as reality. It happens when people are reluctant to believe the truth. It's also implies that with $15 billion being "bet" on the share price every day, each one of those bets is misinformed!

    The cause of this divergence between reality and perception is that disruptions are divergent from perceptions. A disruptive company always "leads" its valuation. There is cognitive delay for the vast bulk of observers. You can then argue that for those, like Mr. Coleman, that don't suffer this delay, there will be profit.

  8. Pricing Paradox

    Research · 148 comments

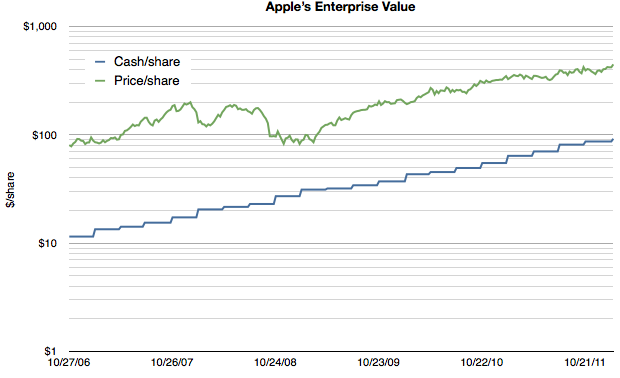
    As Apple's extraordinarily low valuation is being more widely noted, explanatory hypotheses are proliferating. Everyone seems to have an opinion. Some explanations come in and out of fashion. Others are reliable old clichés. We've seen liquidity issues with large funds forced to sell, "too much cash", management transitions, an impending loss of mojo, share price too high to afford, "law of large numbers", and that old chestnut, competition. None of these satisfy. They don't explain why reliable growth is not valuable. And reliability is indeed what Apple offers in spades. Consider the following chart:

    Note that the scale is logarithmic so that the growth patterns can be seen clearly.

    It shows Apple's cash/share vs its price per share. First, it should be noted that the company's cash has been growing reliably on a log scale, increasing by a factor of 10 in five years. As a proxy for retained earnings, the cash trajectory shows exceptionally predictable earnings.

    Second, although the share price has grown it has not grown either as reliably or as quickly. It's as if the reward for reliable earnings is a significant dissent.

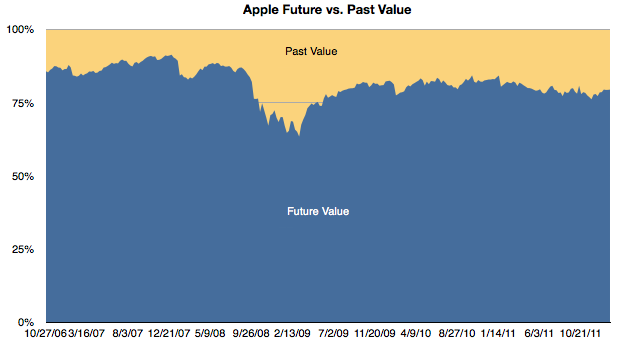
    Third, if we subtract the cash/share from the price/share we obtain the enterprise value (EV) per share. The EV reflects the future value built into the price. It reflects the expectation of more earnings. In the chart above one can see the shrinking of the gap as a multiple of the cash value. To bring that gap into focus, I prepared this chart showing the percent of the share price allocated to past value (cash) and future value (EV).

    One can see the gradual erosion of emphasis of future value. With the exception of the credit crisis induced equities crash, future value as a percent of total value is at a new low. In late 2006 the future was was about 86% of the share price. At the end of last week it had dropped to 79%.

    Another way to interpret this is that in 2007 when the iPhone was born nearly 90% of the business value was thought to be in its future. Today only 80% is future value.

    To clarify further, if a company reaches a price where 100% of its value is cash then it's seen as having no future value. Having any significant portion of the price attached to the past is extremely rare for a growing company and I would say unheard of in a company growing as rapidly as Apple is.

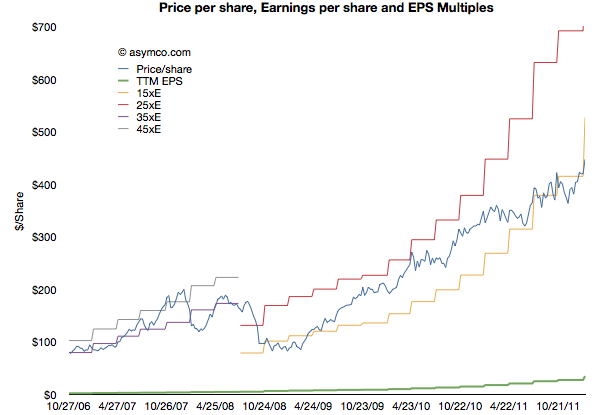
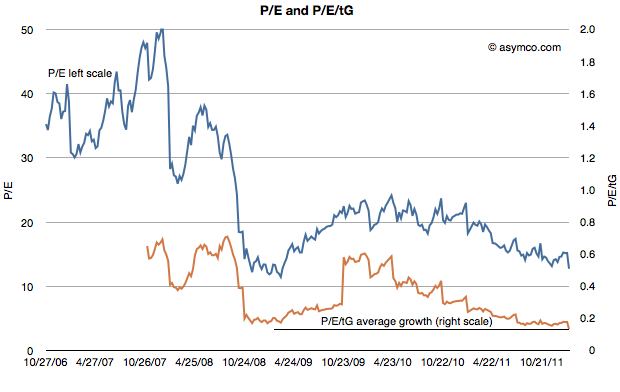
    This preoccupation with the past and discomfort with the future is, I believe, the key to understanding the valuation paradox for Apple. I have gone over the conventional metrics of P/E and P/E/G(trailing) that illustrate absurd pricing (updated below). But they don't help explain the mis-pricing.

    A disruptive company is inherently unpredictable. Success and growth are unrewarded because there no understanding of the underlying causes of these phenomena and therefore there is no expectation of repetition.

    In other words, a five year dead-straight line of logarithmic growth is not a sign of anything resembling reliability if the underlying causes are not understood. Today Apple is still a mystery wrapped in an enigma and without a causal understanding of its suceess its pricing will remain paradoxical.

  9. Apple's commoditization discount

    Research · 81 comments

    When asked where Apple's growth will come from, most analysts or observers will cite new products. As long as there are new products, then there is growth. Conversely, if there are no new products, then there will be no growth. This is such a commonly held belief that it's axiomatic: Apple is being valued based on short-term foreseeable growth.

    To be more precise, analysts value the wave of growth of every new product and heavily discount the post-growth phase assuming commoditization. There is no value assigned to Apple for extending market reach to the mass market.

    Consider: Analysts currently forecast an operating income (or EBIT) of $43.3bn for 2012 and $49.7bn for 2013. That implies growth of 28% in 2012 and 15% in 2013. These growth rates are modest in light of Apple's recent historic growth and especially 84% in 2011 on EBIT level. Much of this growth has been due to iPhone which quickly captured 4% market share in four years. To suggest 15% growth in 2013 is to suggest that Apple will not increase its phone market share by an appreciable amount. The implicit assumption in that growth figure alone is that Apple will remain a niche player.

    Bear in mind that 15% growth is so low as to be half the the growth in the Mac business and below the likely growth in the overall phone market. Considering the risk premium on equities, this growth forecast assumes essentially a no growth scenario. But even with no growth, Apple's cash flows are huge and thus they should add up to some significant present value. Since we know the value as reflected in the current price, we can work backwards to determine the discount rate being applied to those future flows. In other words, we can calculate how risky Apple's existing product cash flows are seen to be.

    Based on  assumptions originating from analysts' consensus, we can construct a simple model that will approximate the discount the stock market puts on Apple's future cash flows. Let's have a look at an adjusted Gordon or dividend discount valuation model on EBIT basis:

    Shares are valued based on the projected future cash flows of a company. Discounting EBIT with Weighted Average Cost of Capital and subtracting growth will yield enterprise value (= market capitalization - cash).

    Applying analysts’ assumption of close to zero growth to Apple's post 2012 EBIT means EBIT stays constant for 2013 and beyond. Let’s solve for the implied capital costs. Right away we can eliminate growth (g) as it equals zero. EBIT reflects operating cash flow since in a zero growth scenario CapEx will equal deprecation and there are no changes in net working capital. As Apple has no debt but a cash surplus, WACC will be equal to cost of equity[1].

    Solving for capital cost (WACC) with available analysts' EBIT estimates reveals a discount rate of 15%.

    But let’s remember that analysts have consistently and by a large margin missed Apple's financial performance. So let’s dial in a more aggressive estimate of around $56bn of EBIT for the fiscal year 2012. The discount rate goes up to 19% and implies an EBIT multiple of 5.3x.

    In other words, Apple's cash flows for a zero growth scenario are being discounted at a rate of 15% to 19%. This places the company in an extremely risky category of investment. It is certainly not something that can be categorized as a value stock.

    The discussions on this blog regarding Apple’s valuation have been insightful, but only danced around the triangle of price, earnings and growth. When the growth forecasts are considered vis-a-vis current pricing, the assumptions built into 'consensus' forecasts for Apple are condemnations of the company.

    They present a view of a company that is extremely vulnerable and can neither preserve its current cash flows nor find new sources of growth. It is, quite plainly, a company doomed to commoditization.

    ---

    Notes:

    1. Or one can even assume that cash has a positive effect lowering costs of equity (less indirect bankruptcy costs).
  10. Does Growth Matter?

    Research · 85 comments

    In last week's discussion of Apple's (historically low) valuation, comments arose that perhaps the company's discount is not unique. Can we look at comparable companies and determine whether the relationship between growth, size and valuation are consistent?

    The challenge is in finding "comparable" companies. Apple is characterized by being large in terms of market capitalization, highly profitable, in the technology sector and growing relatively quickly. One can find a cohort of companies with each of these characteristics but not all.

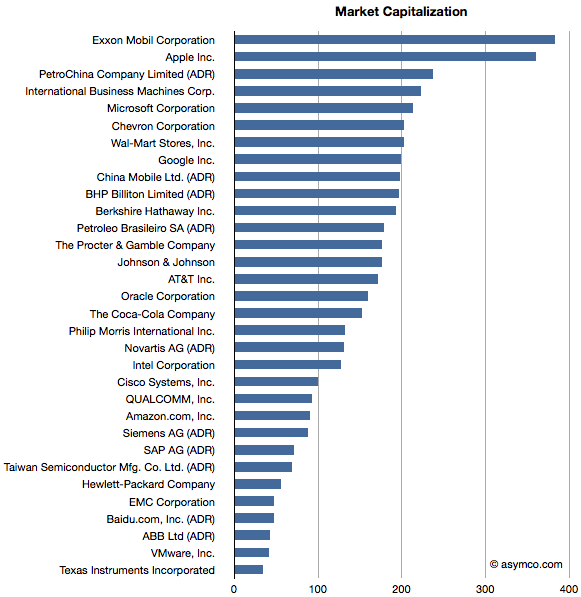
    Here is an attempt at looking at the largest companies by Market Capitalization (the so-called Mega-caps) to spot patterns of valuation. Some of the companies in the top 20 mega-caps were technology companies so I thought I'd highlight them. I then also added a few of the top 20 technology companies by capitalization to create a larger sample.

    The group I settled on is shown in the list below ranked by market cap.

    Companies below $130 Billion in market cap (i.e. below Novartis) are in the top 20 technology list but not in the top 20 overall list.

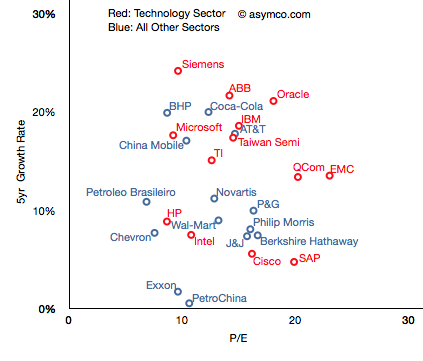
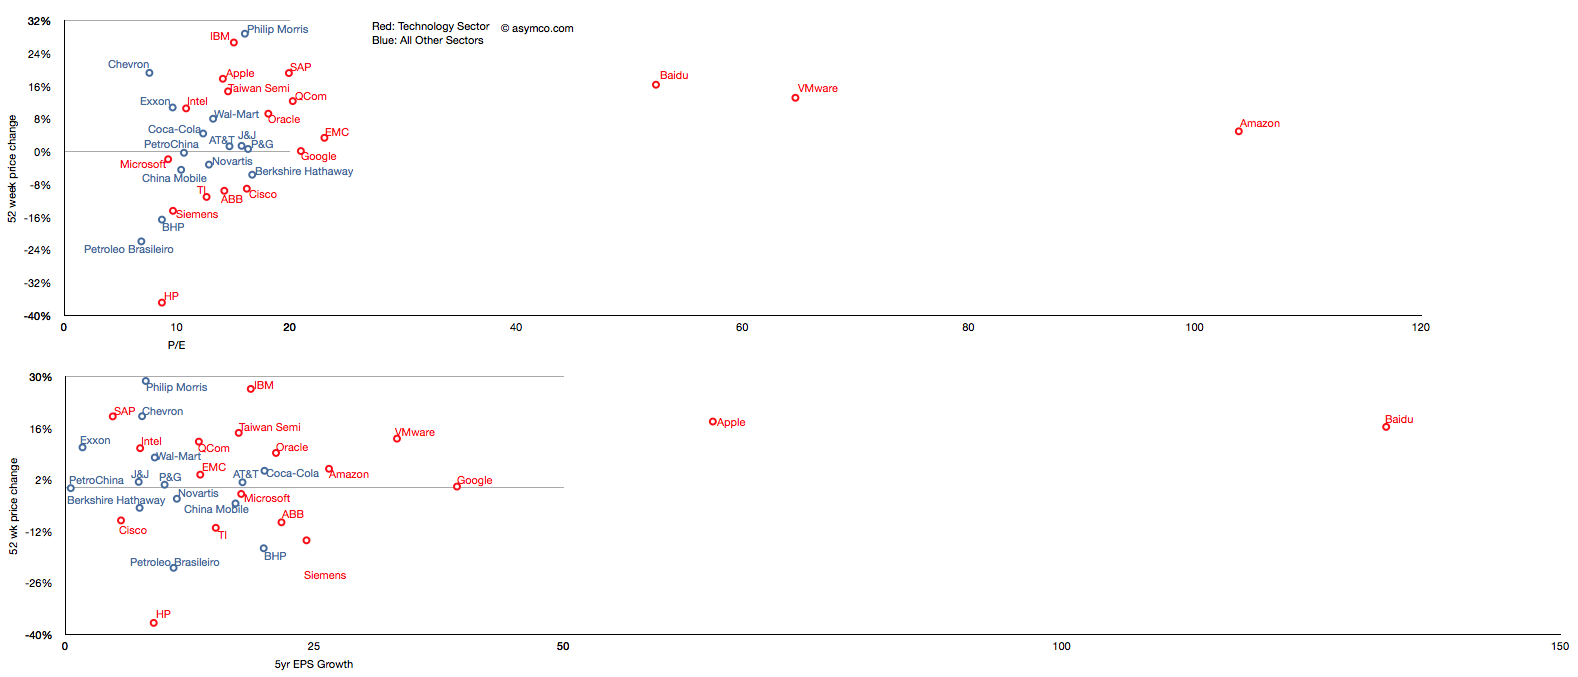
    I then plotted the P/E rate vs. 5 year Growth Rate for these companies, separating the tech sector by color (Red):

    The pattern is not encouraging. It appears that there is no correlation. Perhaps the technology companies are, as a group, further up and to the right, but overall they are equally unobservant of growth.

    For example, SAP has grown less than 5% in five years and yet enjoys a P/E of 20 whereas Microsoft has grown 18% and has a P/E of less than 10. The non-technology sector companies are similarly broken. Berkshire Hathaway, a conglomerate, is rewarded for slow growth and China Mobile is punished for relative high growth.

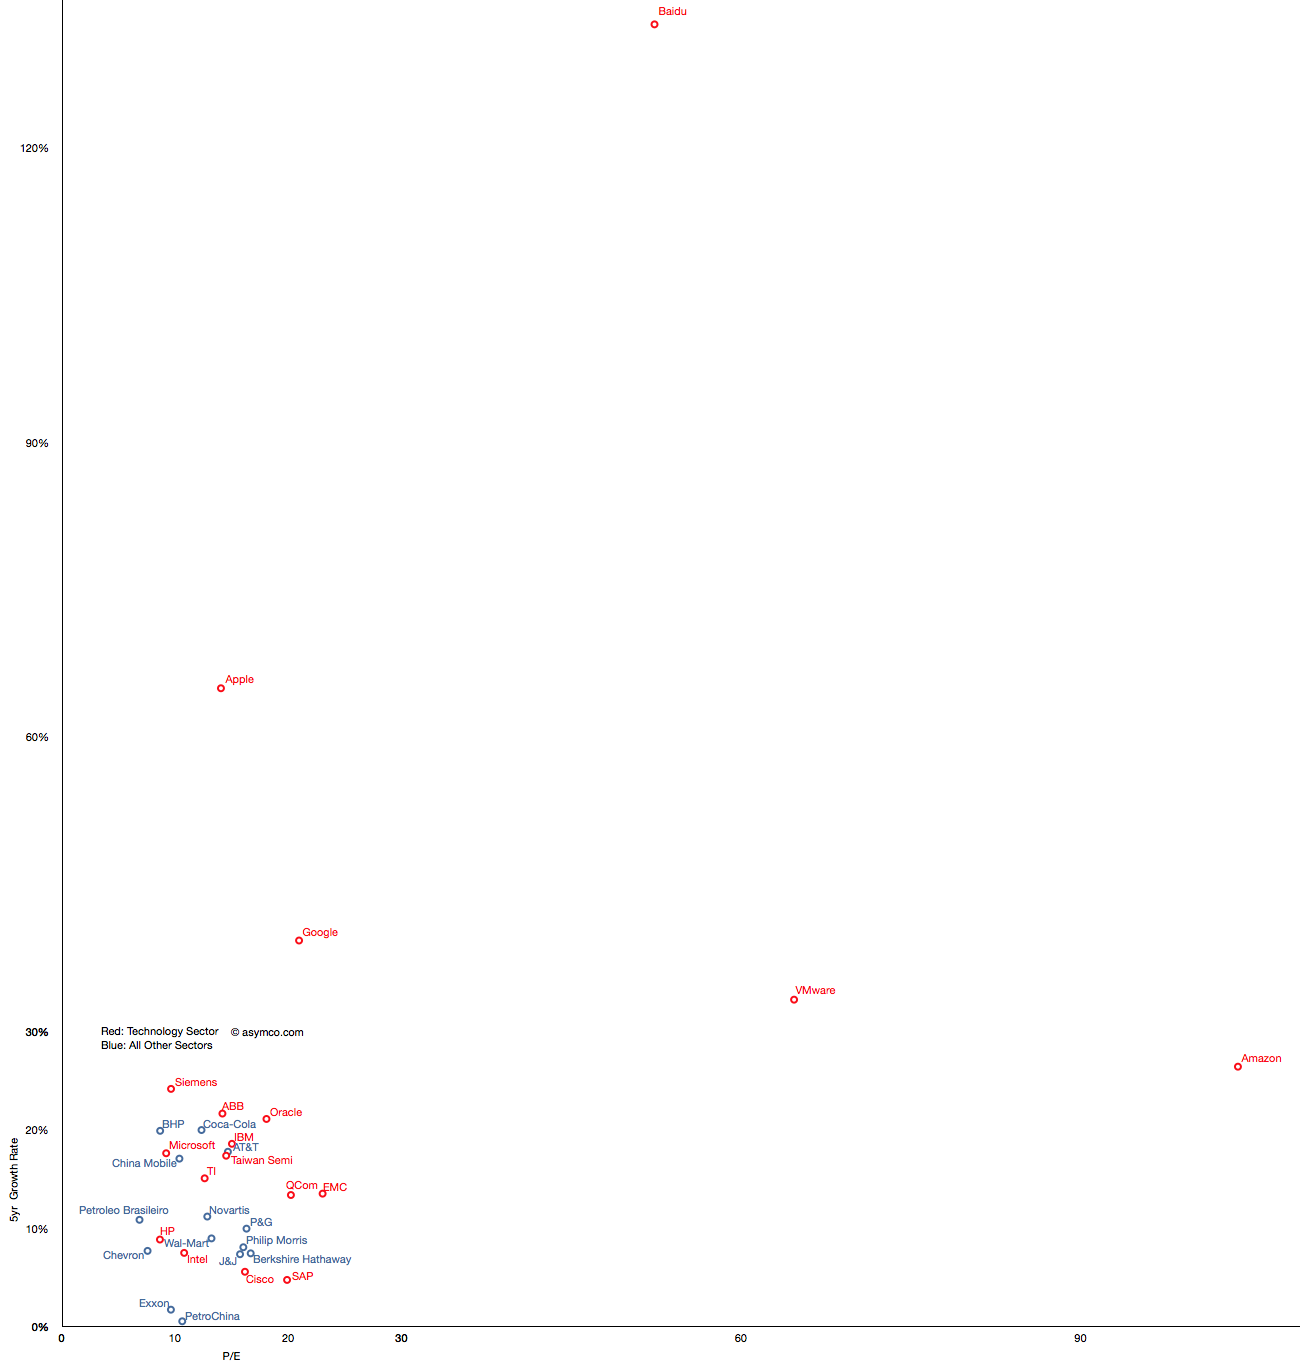
    But you'll notice that some companies are not on this chart. That's because they are outliers. Their growth or P/E are so far out of this cluster that the would make it impossible to discern individual performance. The complete "top 20" picture is shown in the following chart which will require either a large display or a lot of scrolling (1300x1364 pixels):

    With this level of detail, we can see how distinct some companies are. Not only from a correlation point of view but from a cluster of peers. The outliers are Amazon, Baidu, VMware, Google and Apple.

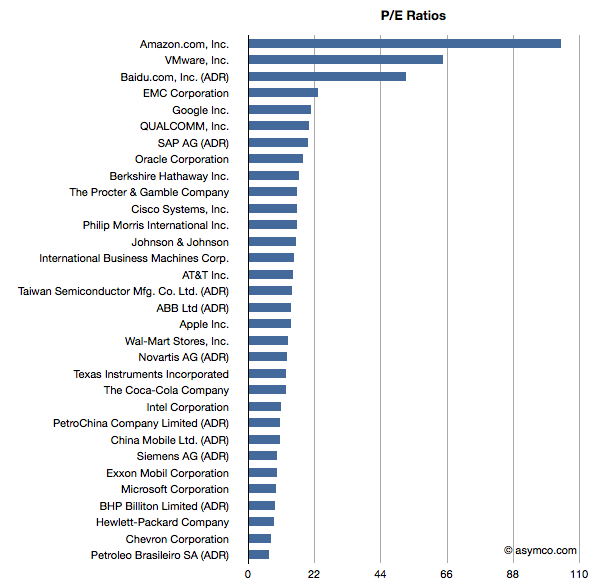
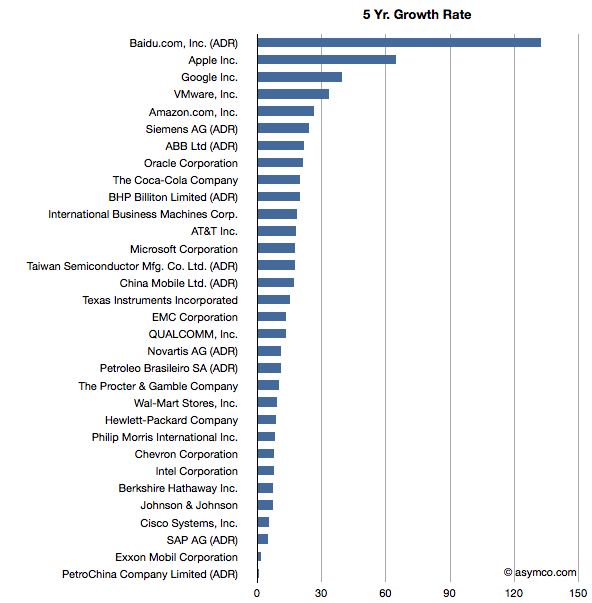
    These outliers can be seen also in ranking of P/E and Growth:

    Baidu has grown earnings by 132 percent while creating a market cap of $47 billion and has a P/E of 52. Amazon has grown by 26% while having a total value of $90 billion and a P/E of 104. VMware is "only" a $40 billion market cap company with a 5yr EPS growth of 33% and a P/E of 64. Finally, Google has returned a 39% growth rate, a market cap of about $200 billion and a P/E of 21 and Apple brings up the rear of P/E with 14 but with the second largest market cap of $360 billion and the second largest growth of 65%.

    What this analysis shows is that the market does not have any "rule" of rewarding growth with a high P/E. If anything, the outlier analysis shows that there are significant anomalous valuations that cannot be explained by growth data.

    ---

    Note: I've also tried to observe correlation between recent share price change and growth and recent price growth and long-term earnings growth.

    Similar anomalies and lack of correlation can be observed.