Asymco

Asymmetric Intelligence

Windows Mobile

  1. Google and Apple, The Beginning

    Research

    Are Apple and Google competitors or are they partners?

    Prior to the launch of the Android operating system, Apple and Google collaborated on many projects. Google Search was predominant on Apple products including the (at the time) new iPhone. The iPhone also launched with support for Gmail and had native Google Maps and even YouTube. Google was a cornerstone supplier for the new smartphone.

    After the launch of Android only a year later, the relationship changed. The two companies came to be viewed as mortal enemies. The perception that Android was disruptive to Apple—insofar as it undercut the pricing power of the new touch-based user experience—was universal. The "zero price" of Android and its licensing by all other phone makers suggested a competitive collapse was imminent for the fledgling iPhone. Android phones were far cheaper and "good enough." If not immediately, then with the resources of all phone makers and Google itself, Android would surely soon overtake the iPhone in performance along all dimensions. It took a great deal of courage to argue otherwise.

    But, over time, the notion that the iPhone would continue to exist became more widely held. Holding on to a "premium" positioning, iPhone seemed to be have pulled a rabbit out of a hat, perhaps because of Steve Jobs' reality distortion field or because of magical marketing. Nonetheless, doubts over long-term growth persisted.

    Having survived Android, Apple was still seen as vulnerable to a multitude of Google initiatives including Chrome and Chromebooks, a range of Google Pixel phones (enabled by the acquisition of Motorola and HTC.) The entry of Google wearables (enabled by the acquisition of Fitbit), Glasses, the Play Store, YouTube content, Google productivity apps, Google cloud, Google TV, Nest, Google Assistant and numerous other services were all cited as nails in the iPhone coffin. This is all before the age of Crypto a new generation of AIs came into fashion.

    Throughout this period the iPhone continued to increase its audience, growing its base of users not only from smartphone non-users but also from so-called "switchers", that is, those who moved from Android to iOS. Apple has benefitted from this net positive switching for at least five years now as most of its addressable market has already adopted the smartphone. There are about 1.2 billion iPhone users and it's far more likely that a new iPhone user today arrives from the 3.5 billion Android users than from the 3.2 billion people who don't yet have any smartphone. That is because those who don't yet have a smartphone today are also likely to not yet have access to electricity, cellular networks or money.

    Indeed, it is Android that seems to be in a precarious position. The ecosystem is bleeding not just high-end users but also from fragmentation. Chinese OEMs in particular deliver their own experiences and code bases, eschewing Google services altogether. Large OEMs such as Samsung are seeking to differentiate with their own experiences and ecosystems and accessories and chafe against Google's hardware offerings. Upgrade rates to new Android versions are poor. Support of hardware beyond a few years is lacking. But, most fundamentally, Google has not developed a business model that directly fuels development of Android.

    Put simply, Android is not a profitable product. It's not designed to create revenues. It's designed to reduce costs.

    To understand this, we have to understand Google's business. It's not very complicated. Google's revenues in the last quarter are segmented as follows:
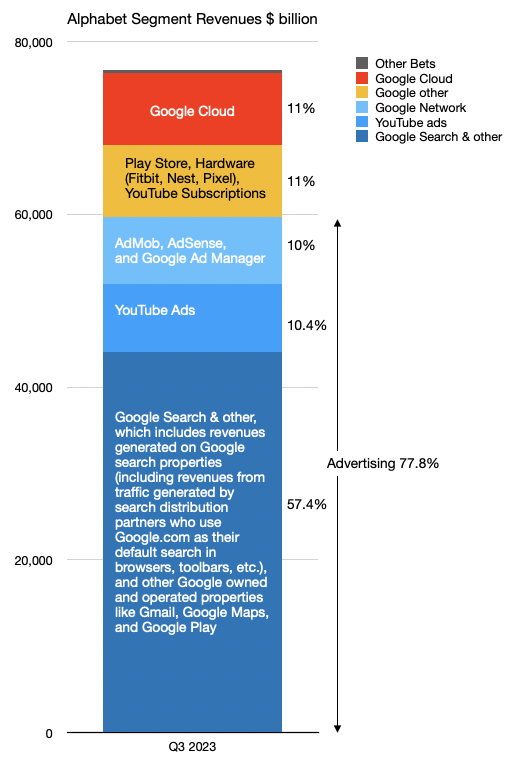
    The colors above indicate the major categories. Blues are Advertising, yellow is "Other" and red is Google Cloud. Other Bets, consisting of research projects, is a 0.4% rounding error. Apart from Search which is about 60%, each major category is about 10%. Advertising as a business model is about 78%.

    To Alphabet's credit, Advertising as a business model has been reduced from 94% a few years ago. Much of that credit goes to Cloud which is a B2B business and has completely different resources, processes and priorities than Search. The "one trick pony" label is less applicable to Google today.

    Search however, and the ancillary properties, are still, by far, the largest sources of revenues and profit. Note that Android itself is missing from this mix apart from Play Store which is a direct Android extension. Play does contribute somewhat as part of "Other" but the OS itself is an enabler across all these categories.

    While not directly producing revenues, what Android does is perhaps even more important. It helps reduce the amount Google has to pay to access its customers. Think of Search as a system which takes queries in and puts results out. These results are what advertisers pay for and the queries are what Google pays for. The output depends on the input. That input is harvested from many users. Access to those users is not free. The cost can be paid by building access directly (Android) or by paying for access to someone else's property (Apple, Windows, or Firefox). In old-school business terminology this is called distribution.

    Distribution is often ignored or considered a superfluous "middleman" to be bypassed. But distribution is foundational to any business. It is, effectively, other people, outside your company, helping you sell your product because they have access to the customers. They get paid for that access, often with a percent of sales. Stores are distribution. Wholesalers are distribution. Resellers are distribution. Without distribution scale cannot happen. Distributors help both producers and consumers by creating access.

    Access is also provided by what we call infrastructure. Just like you can't travel by car from your house to your destination without roads, all access to products and services is effectively infrastructure. If you own the infrastructure then you have to pay to build it and maintain it. If you don't own it you have to pay to use it. All infrastructure has value and all infrastructure has costs.

    This all makes more sense when recalling the historic birth of Android. At the time (2006 to 2008) the worry for Google was that Microsoft's mobile operating system (Windows Mobile née Windows CE) would be licensed as was Windows. That is to say that all phone OEMs would take a license for a nominal fee and build Windows Mobile phones. Microsoft would thus dominate the mobile computing market the way it dominated the PC market (with market share above 95%). Microsoft would then ensure that Bing search was the default on all devices running Windows and Windows Mobile, thus blocking access to what was expected to be the next 3 billion users while capturing all search ad dollars ad infinitum.

    If Windows Mobile were to dominate, Google would be denied distribution, at any price. It would thus be relegated to, at best, 10% market share of mobile search. This would be an existential crisis.

    In this setting, Apple was an ally for Google. Apple was not a search engine provider and was very welcoming of Google search on a nascent Safari browser. Whereas Explorer would block Google search, Safari would offer default placement. Not for free, but for a reasonable cost. Google was a "go-to-market" partner for Apple and it was a symbiotic relationship.

    However, the expectation of Google at the time was that Apple would be no more successful with iPhone than it was with the Mac: A fringe of "creative" or "fanboy" quirky oddballs. This was not just Google's expectation. It was everyone's expectation.

    Android was built to counter a Microsoft mobile OS monopoly with a "zero cost" option vs. Microsoft's end-user-license model. Microsoft made money selling software. Both system software (Windows) and application software (Office.) Google would give away system software (Android) and services (Gmail and Docs) but make money on advertising.

    A genius move. Phone OEMs would much rather pay zero of the OS on their phones than for the non-zero Windows Mobile license. [On a $200 retail cost phone (and thus $90 bill of materials) a $8 OS license is a huge cost.] Google's Android did indeed block Windows Mobile from getting a foothold in the post-PC era.

    But it did so by taking some short cuts. Android itself was an acquisition in 2005 (for $50 million, with a keyboard interface) and, in response to the iPhone, a new touch user interface was developed. It so happened that this interface copied as closely iOS as Windows had copied the original Mac. This perceived theft was such an affront to Steve Jobs that he declared war on Google.

    It was important to ask (as few did) why did Google need to develop an OS, only to give it away. Was its business that robust if it needed to expend enormous energy and capital to build an enabler? The answer is, of course, distribution.

    Google was initially not paying for distribution as most people just typed "google.com" into their browsers. As the URL field became a search field, Google could still expect PC users to make Google.com their search bookmark, one click away.

    But on mobile devices, the friction of the constrained interface meant that defaults mattered. Mobile was going to require new distribution economics. Devices were going to be in the hands of many more people, who, since they did not have full-size keyboards, would type less and who would interact in new (and very succinct) ways. One click away was one click too far.

    With Android (and Chrome) Google set defaults for its services across the platform. If Android was the OS then Chrome would be the default. If Chrome was the default, then Google Search would be the default. For these Android-sourced queries, Google would not pay for distribution. Or, more precisely, would only pay to build and keep Android. Thus the more Android there was, the cheaper it was to obtain search queries for Google. Google had built its own highways: it owned the infrastructure that connected users to its services. These roads were for Android users. And what about iOS users?

    Over a 15 year period the smartphone went from essentially zero to 5 billion users. It became so important to those 5 billion people that they keep it with them every waking moment, use it 100 times for a total of 5 hours each day. That adds up to 182,500,000,000,000 interactions a year and, as a result, it has changed behavior, politics and humanity itself.

    Throughout this period, the relationship between Google and Apple changed. From being allies, to mortal enemies to, as we shall see, partners. We have to understand this new relationship that has emerged and its consequences.

    The next post will explore the relationship in detail using the lens of the deal structure that exists. A deal which is not public and largely unexamined.
  2. The Innovator's Stopwatch. Part 2

    Research · 40 comments

    The adoption curve has been used to categorize adopters into groups by their behavior: innovators, early adopters, early majority, late majority and laggards. This categorization asserts that adoption is function of psychology, or the likelihood of people to act or react within social systems. [Rogers first edition 1962]

    It's a compelling model and has been proposed as a tool for firms to help with their marketing strategy. As diffusion proceeds through each adopter category, the product is re-positioned to address each group's presumed behavior. Innovators (first 2.5% of the population) are offered novelty, a chance to experiment and uniqueness of experience; early adopters are offered a chance to create or enhance their position of social leadership; the early majority build imitate the leadership of the early adopters and justify it with productivity gains; the late majority are skeptics but, given a set of specific benefits, join the earlier adopters. Finally the laggards reluctantly agree to adopt as their preferred alternative of not adopting disappears.

    The theory suggests that a firm can be successful if they modify their marketing and perhaps product mix to accommodate these adopter categories in a timely manner.

    If this is the case however, why is it that those who have access to these data (i.e. who is buying and when) not to do the right thing? Why is it that during a technology adoption curve, there is a high degree of turnover in the firms which capture profits from the products that deliver this technology?

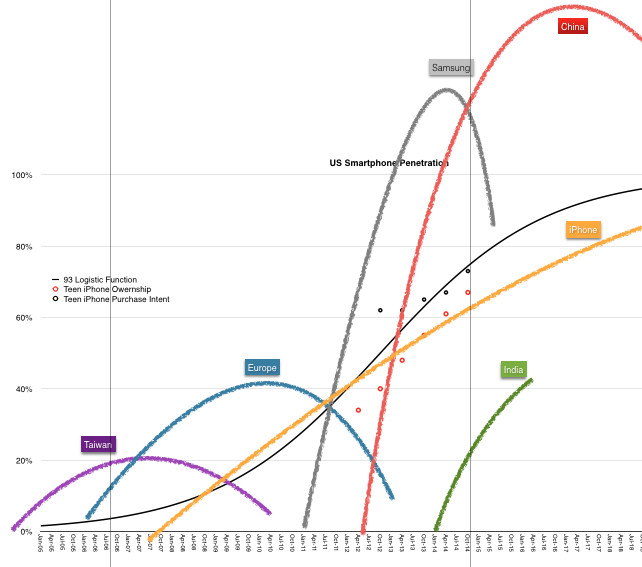
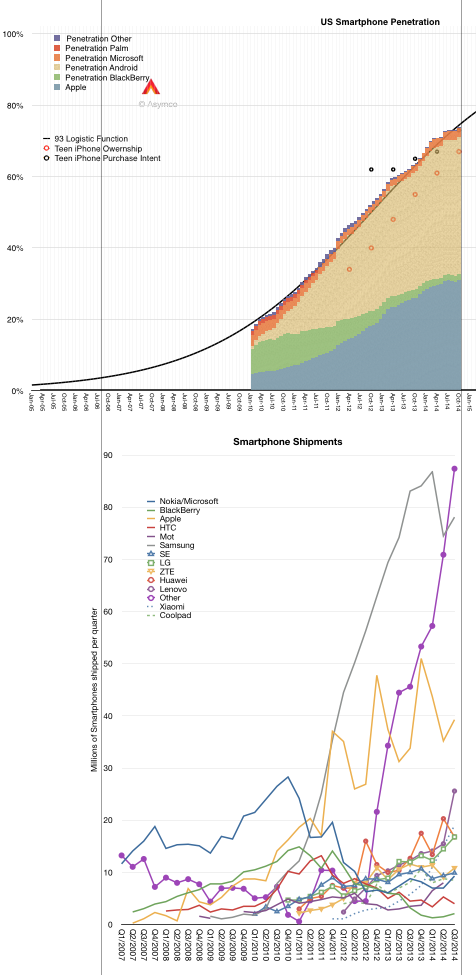
    If you don't believe this to be the case, consider the smartphone market. The data about buyers is easily obtained (even without paying a fee). Shown below is the US smartphone penetration data as obtained by comScore (including teenage survey data from Piper Jaffray).

    Screen Shot 2014-12-16 at 5.07.41 PM

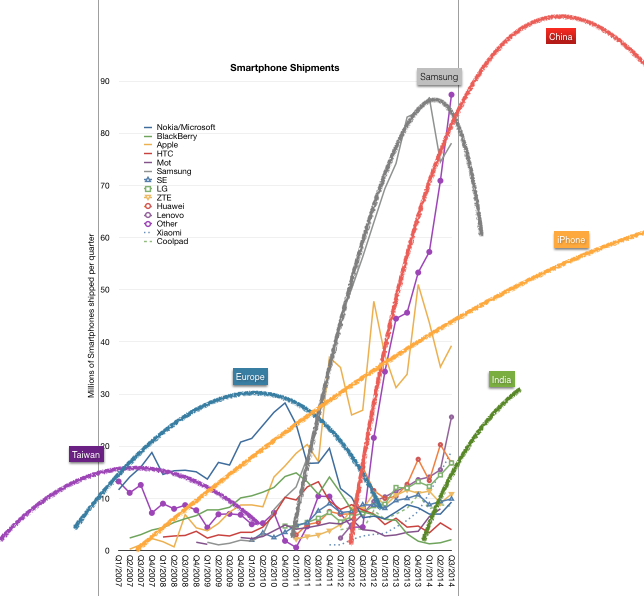
    Following the penetration data there is a second graph showing the smartphone shipments for the largest vendors as well as the sum of the "others" which make up the difference with the total market. I used vertical registration lines to align the different data sets to the same time scale.

    Having observed the market for some time, it's possible to see a set of "epochs" which show the rise and fall of various platforms/vendors/geographic production areas. I applied these "epochs" as a rough sketch over the production data.

    Screen Shot 2014-12-16 at 5.26.11 PM

    I define these epochs as:

    • The Windows Mobile epoch from 2003 to about 2010 peaking in 2007. Competitors from Taiwan using Windows Mobile fielded a large number of devices and led that platform to win over proprietary Palm and Symbian.
    • The Nokia/RIM epoch from 2005 to about 2012 peaking in 2010. Nokia's distribution power takes its platform to global dominance. At the same time BlackBerry surges in popularity peaking at about the same time.
    • The Samsung epoch from 2010 to (probably) 2016 peaking in 2014. Samsung surges from almost no smartphone volumes to double the nearest competitor in a matter of three years.
    • The Chinese epoch from 2012 and ongoing. With a vast number of new competitors doubling or tripling sales over a few short years, "Other" becomes once again the bulk of volumes with additional brands like Lenovo, Huawei, ZTE, Xiaomi, Coolpad adding to the total.
    • The (probable) Indian epoch from 2014. This epoch is not so much of or about India as the "local brands" which begin to have large, even majority, market share in markets such as India, Indonesia, Philippines, Vietnam, etc. This epoch is the triumph of the local over the global and represents the latter stages of adoption.

    Now I deliberately left out Apple because, as can be seen in the shipments data, Apple never held a pre-eminent volume position. It is however a competitor with a steady rate of growth. So steady in fact, that it seems to mirror the overall market. Essentially, Apple shows that there is a potential for growth without competitive flux. A type of growth that is "systemic" rather than a function of some rivalry and hence turnover.

    But Apple is an exception. As so often it tends to be.

    The real puzzle is why are there so many turnovers in leadership in such a short span of time. The idea that five distinct eras can exist in a mere decade seems preposterous. These turnovers are not without economic drama. They are booms as well as busts. They happen in a market where there are literally billions of consumers spending the equivalent of $300 billion/yr. so the stakes are pretty high.

    But it's even more strange. If you super-impose the epochs on the (early) diffusion curve you can observe how a predictable adoption curve ((I.e. one whose shape can be determined well in advance and updated with very high precision)) results in unpredictable success in the market.

    Screen Shot 2014-12-16 at 5.38.51 PM

    There must be something about the way companies behave *while* they are watching the evolution of the market. They seem to be running at a cycle time far faster than the market's overall absorption rate. Is this because competition is forcing them to mis-spend their energies?

    Could it be that the behavior of firms is also a function of the psychology and reward systems of managers? That they seem compelled to optimize for a time frame shorter than the economic lifespan of the technology? That this mismatch of phase between lifespans of a technology market and their profit model leads to premature demise of their market position?


  3. Samsung vs. Google: an Interview with Rafael Barbosa Barifouse of Redacao Epoca

    Research · 60 comments

    On Mar 18, 2013, Rafael Barbosa Barifouse - Redacao Epoca - Editora Globo asked (and I answered):

    Q: Why is Samsung creating Tizen?

    A: I believe they are collaborating on Tizen development because they want an alternative to Android and because Bada was not good enough to meet that goal. Tizen's roots include contributions from Intel, Nokia and several Japanese companies so it's not Samsung's OS per se. Historically it was the "open" alternative operating system for embedded and mobile systems. See https://github.com/kumadasu/tizen-history/blob/master/tizen-history.pdf for a historic perspective.

    In some ways Tizen seems to be a blend of several pieces of code including proprietary Samsung user interfaces. Samsung is presumably interested in having a unique, differentiated experience. This is something every device maker seeks. Put another way, if they did not seek this then it's unlikely that they would be profitable which would also imply that they would not invest in marketing and development of products. As Samsung invests both in marketing and development it can be concluded that they seek to offer a unique value proposition and, in today's market, that means a unique experience.

    Does it make sense to create a new mobile OS when it has had so much success with Android?

    Samsung would argue that the success it's had is not due to Android but to its products. Arguably they are right because if Android were the valuable component in a phone then buyers would buy the absolute cheapest device that runs Android regardless of brand. That is not the case. People still seek out a particular brand of phone because of the promise it offers. Consumers have been buying more Galaxies than no-name Android phones.

    Why is Samsung the most successful company between the Android devices makers?

    In my opinion it's due to three reasons:

    1. Distribution. Success in the phone business depends in having a relationship with a large number of operators. Samsung had these relationships prior to becoming a smartphone vendor [because it sold all other kinds of phones]. Few alternative Android vendors have the level of distribution Samsung has. For comparison Apple has less than half the distribution level of Samsung and most other vendors have less than Apple.
    2. Marketing and promotion. Samsung Electronics spent nearly $12 billion in 2012 on marketing expenses of which $4 billion (est.) was on advertising. Few Android vendors (or any other company) has the resources to match this level of marketing. For comparison, Apple's 2012 advertising spending was one quarter of Samsung's.
    3. Supply chain. Samsung can supply the market in large quantities. This is partly due to having their own semiconductor production facilities. Those facilities were in a large part built using Apple contract revenues over the years they supplied iPhone, iPad and iPod components. No Android competitors (except for LG perhaps) had either the capacity to produce components or the signal well in advance to enter the market in volume as Samsung did by being an iPhone supplier.

    Tizen was being treated as an OS for low and mid level devices, but recently Samsung said that it will launch a high-end device with Tizen on Q3, an area where it's very successful with Android. What has changed? What does this announcement mean?

    Planning for these product launches is done a few years prior to launch. I believe alternatives to the Android line (i.e. Galaxy) have been planned for a long time. Note that Samsung also has a line of Windows Phones and historically has supported Bada, Windows Mobile, Symbian, PalmOS and LiMo smartphone platforms. Samsung's involvement with Android is only about three years old, and arguably only enjoyed two years of prominent growth. That's less than one product launch cycle and far less than a platform or OS development cycle.

    I believe the company has a long term perspective and that includes a time span beyond the likely lifetime of Android [Note that platforms do have finite lives]. Keep in mind that phones last less than two years. If users are not loyal to a platform then they will very quickly move on. The "stickyness" of a platform depends on media or software consumption by the user. That level of consumption is not particularly high for most Android users. The same phenomenon happened with Symbian and BlackBerry and Windows Mobile users. Hundreds of millions switched or will switch out of those platforms. This happens far less with iOS, Mac OS X and Windows because of the significant investments users make in the ecosystems above the OS.

    Is Google dependent on Samsung's sucess with Android? Or Samsung is more dependent on Android since its the most popular mobile OS nowadays?

    Google is not dependent on Samsung because it's not dependent on Android. Samsung is not dependent on Google because Samsung is not dependent on Android. Android is valuable in theory but in practice its value is hard to identify. Historically it was planned as a defense against the hegemony of Windows, BlackBerry and iOS. In that respect it has succeeded. But playing defense is not enough to win a game. For Google to truly succeed in mobile it needs to define a better business model.

    So far its profitability from mobile is very weak and has not shown up in the bottom line. Furthermore, it's probable that Google has 'control' over only about 40% of Android devices in use. Control here means a guarantee that users will use those devices for the benefit of Google, and, more importantly, not for the benefit of its competitors.

    You can also think of it this way: If they "divorced" there would be minimal to no impact to their fortunes in the foreseeable future. Buyers of Samsung phones will still buy Samsung phones because they will look and feel very similar and Google services will still be available through browsers or apps (e.g. Google maps on iOS). Conversely, users of Google services will continue to use them because they will be available on Samsung devices, no matter what OS is running. The services Google offers are independent of Android and are cross-platform. They will make sure they are available on all major platforms (as they were before and during Android). Google is far more loyal to Search and Maps and Gmail and YouTube than they are to Android.

    Do you think Google is going to merge Android with Chrome OS?

    Google's chairman said they would so I assume they will.

    If so, how this could make an impact on Samsung?

    It depends on how the new OS would enforce licensing terms. If the result would be a restriction on Samsung services like S Pen, AdHub, Samsung Wallet, SmartTV, ChatON etc. then Samsung might reject the OS and either fork Android or move to Tizen more broadly.

  4. How many Lumia phones were sold in the US?

    Research · 159 comments

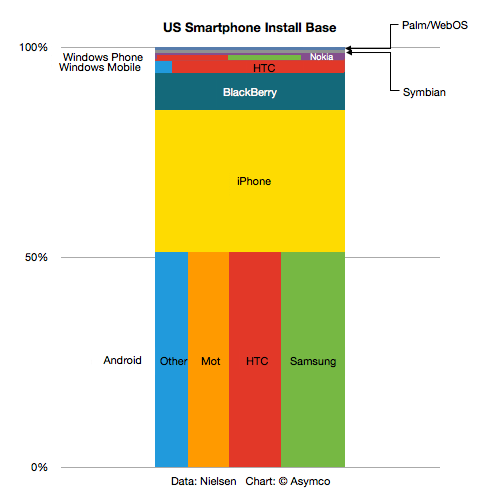
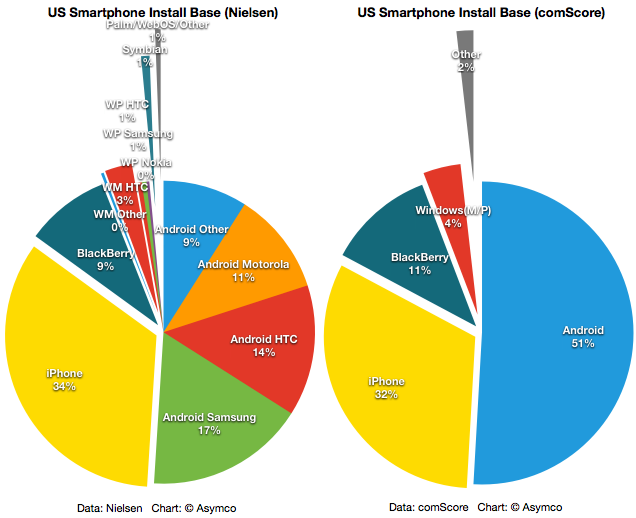
    Nielsen and comScore survey US consumers through different methodologies, however they both try to paint a picture of the smartphone patterns of ownership and consumption.

    I regularly report on comScore's data as it's published on a monthly basis. Nielsen offers updates on a quarterly basis but there is more detail.

    The latest report (for Q2) shows smartphone shares by both platform and vendor. The following graph is a treemap built with the Nielsen data:


    The same data is also plotted below as a pie chart:

    I also added the latest comScore mobiLens data in the pie chart to the right.

    Note that both surveys agree in the main on the largest platforms. The difference seems to be within a reasonable margin of error. The details available in the Nielsen data are perhaps also interesting. The various Android OEM shares as well as the division between Windows Mobile base and Windows Phone (7) base could provide some insight. Nielsen's total Windows base adds up to 4.5% while comScore reckons on 4%. Within that total, Nielsen breaks out 3.2% for Windows Mobile and 1.3% for Windows Phone. Within the Windows Phone total, HTC and Samsung are shown as having 0.5% and Nokia 0.3%.

    If we then use comScore's figure for total smartphone users (110 million) then the data would suggest that there are 330k Lumias in use in the US. This would have been accummulated over a sales period of about four months.

  5. The parable of RIM

    Research · 155 comments

    Here are the highlights from RIM's latest quarter:

    • 14.1 million BlackBerry smartphones shipped, 13 million sold through
    • 150k PlayBook shipped with sell-through slightly higher. 800k PlayBooks shipped so far.
    • BlackBerry subscriber base up to 75 million
    • High growth cited for U.K., France, South Africa, Mexico and Argentina, Indonesia, Saudi Arabia and South Africa. RIM is the #1 smartphone vendor in the Latin America and Caribbean region. Sales outside the US, UK and Canada were 61% of revenues. US is now 20% of sales, UK 11%.
    • Hardware growth outside the US was 56%
    • There are 630 carriers
    • 50k apps in App World with 5 million downloads per day
    • Forecasting 11 to 12 million smartphones next quarter

    Given the channel fill with a new product, the device business was marginal at best. The company obtained -1% growth y/y in units but 31% sequential growth from a transitional quarter. The average selling price (inclusive of service revenues) is $354 and about $280 excluding service revenues. I estimate that operating margins have dropped to about 11%. Not a good story, but one we have been warned to expect.

    But a crucial new twist to the story is that RIM announced that they don't expect new BlackBerry 10 devices until late next year. That came as a surprise and the stock sold off significantly, valuing the company at well below book value.

    Stepping back, the biggest surprise is that the company seems to have had no plan for sustaining itself.

    Let me explain.

    If you go back to 2005 or so the world of smartphones was a mix of modular OSs and integrated platforms, much as it is today.  Not unlike Android today, Windows Mobile was successful in licensing to dozens of vendors who in turn released hundreds of products. Symbian also was licensed but most volumes came from Nokia and they held the lion's share. Then there was the BlackBerry integrated solution which worked smoothly and had devoted fans who upgraded every chance they had and operators who were joyous at the new ARPU. There was also PalmOS as offered by PalmSource trying to be a "third horse" and unseat stodgy old Microsoft.

    It was into that fray that both Apple and Google jumped. Google acquired Android in 2005 and Apple was busy polishing a version of OS X that would became iOS. In three and two years respectively these platforms would be in the market.

    Regardless of the actions of rivals, all competitors must have faced the same questions in 2005: As technology was changing rapidly and as they all had access to component roadmaps, what is the best technology approach to this market? Should they embrace certain innovations to sustain their business trajectory? RIM had a tightly integrated software, hardware and service offering. What could make it better? Nokia was also basing its products on a more loosely integrated offering (nominally it was modular, but only just). It saw the writing on the wall and began developing a Linux variant (Maemo) as a potential candidate to replace Symbian. Microsoft was basing its solution of a modular approach. Windows CE was ok as a kernel but they had layers on top which were optimized around stylus-based user experiences (analogous to mouse actions). Could it take on a rich computing experience?

    There were many experience candidates. Stylus, keypad, keyboard all had adherents. There was a lot of hesitation. After the iPhone launched with capacitive (finger) touch, resetting user expectations, it still took a year for many of the vendors to re-consider their technology plans. The weakest changed first.

    Microsoft felt the pain quickest. They also had the least to lose since revenues from Windows Mobile were paltry. By 2008 internally they turned 90 degrees. They embarked on re-building their user experience and orphaning the Windows Mobile ecosystem and many of the vendor relationships they had built. Palm dropped PalmOS and built WebOS internally quite quickly. They licensed Windows Mobile as a stop-gap. Around the same time Nokia doubled down on Maemo and joined with Intel to form MeeGo. They did not orphan Symbian though and kept trying to adapt it to the new experiences and input methods.

    But RIM did nothing. Almost nothing. They were the healthiest competitor. They felt no pain from iPhone's entry. The platform they had built was still growing and they were tweaking it constantly. There were always improvements to point to but fundamentally the code was limited. It was very difficult to adapt it to touch input and the first attempts at a touch UI were embarrassing. But there were no signs of a new platform that reflected the Unix-like competition.

    As I pointed out in an earlier post, Unix-like operating systems were having their revenge. To a computer scientist the future of mobile computing would mirror that of personal computing in terms of architecture. The foundations of the early smartphones were built on constraints that were disappearing while being unable to accommodate new input methods. In other words, the early efforts were optimized around those constraints and sub-optimal for rich user experiences. They had to be. There were limited processors, memories and screens and battery life.

    It turned out that all the early mobile operating systems were unsuitable for the advances in technology that came after 2007. Companies which were able to adapt or embrace Unix-like operating systems in a mobile context gained the ability to grow with the new input methods. The sooner they "pulled the trigger" on the shift, the better off they were. This is in fact what enabled entrants to gain footholds. Entrants entered with Unix-like OSs straight away while incumbents had to justify changing and the more successful they were the harder it was to justify changing.

    RIM had trouble justifying this change. It waited until 2010 to finally acquire the QNX asset that would offer them a stronger software foundation.  It still had to adapt this acquisition and it looks like it won't be done until at least 2012, seven years after they should have started. And this should be seen as a sustaining technological change. A new OS is not a disruptive technology to what is already a mobile computer.

    However, delays like these can be fatal. We see the impact on Microsoft who was earliest to push the reset button in 2008. It still took two years to rebuild Windows Mobile into Windows Phone and is now still struggling to regain lost share (less than 2% today). We see the impact on Nokia which was unable to affect a transition to MeeGo due to a litany of issues and had to throw in the towel on self-determination. We see the impact on Palm which lost its independence as WebOS was a bit too little too late.

    These companies had the right technical strategies but suffered from execution and business architecture issues. RIM is years late in embracing what appears to be a sustaining improvement.

    But whenever you see what appears to be a coordinated effort by companies to fail simultaneously you have to ask if the change they struggle with is really sustaining or disruptive. The pattern makes me suspicious that what RIM, Microsoft, Palm and Nokia faced was more than a failure to embrace a sustaining improvement. I suspect that the failure is evidence of tectonic shifting of business models.

  6. Will Windows Phone get to compete with non-consumption?

    Research · 45 comments

    Before diving into the answer to the question in the title, there is some new data to digest.

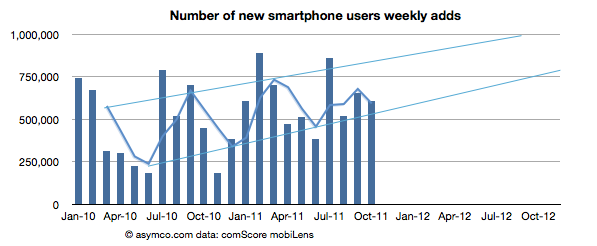
    The latest from comScore shows consistency with the previous months of smartphone growth in the US.

    • The growth rate was 607k/wk new-to-smartphone users. This is slightly down from 654k/wk for the previous month but up significantly from 450k/wk the year before.
    • The penetration of smartphones reached 38.5% (non-smartphones are at 62%)
    • The penetration should reach 50% before September 2012 with about 1.2% being converted every month.

    The following chart shows the weekly add rate with a three-period moving average:

    This chart is important in that it should first show signs of inflection in growth. That does not seem to be happening yet.

    The installed base by platforms is shown below:

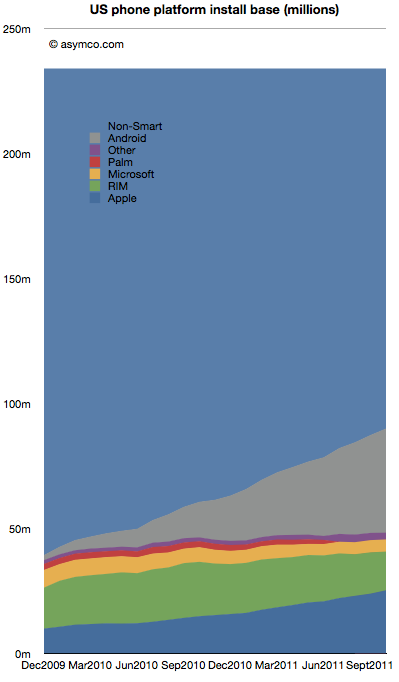
    Android is estimated to have grown to 41.7 million users in the US, adding 2.5 million users in the last month. Android is adding half of Microsoft's entire US mobile base every month.

    RIM BlackBerry lost one million users in October. RIM's slide has accelerated again with over 3.7 million leaving the platform in the last six month. With 15.5 million subscribers, RIM has fewer users in the US today than it did in late 2009.

    iPhone gained 1.34 million. Installed share increased slightly to 28% from 27.4% the previous month. There are now over 25 million iPhone users (above age 13) in the US.

    Windows Mobile/Phone had no perceptible change (-34k) indicating perhaps that the losses in Windows Mobile are being erased by gains in Windows Phone. Microsoft's platform stopped losing significant users six months ago. Whereas the bleeding has been stopped, overall number of users remains at a rather poor 5 million or 5.4% share.

    "Other" which includes Symbian and WebOS lost another 184k users to reach only 2.7 million users.

    There are still 144 million smartphone non-consumers.

    Android and iPhone now make up nearly three quarters of all smartphone ownership in the US. That's a total of 67 million users. With no sign of slowing, the chances are that there are at least 100 million users still remaining to convert. Sounds like an attractive target. But that target is shrinking fast. The rates of adoption signal saturation of most likely buyers will happen toward the end of next year.

    At least 25 million new Android users will be gained and at least 10 million new iPhone users will be created in the next 12 months. That's 35% of remaining non-consumption. Assuming some acceleration, it's not hard to see 50% being claimed by the two entrenched incumbents.

    This leads to an interesting positioning question. Is Windows Phone destined to compete with consumption or non-consumption? If traction is not forthcoming in the next 12 months, that leaves a very difficult last 50 million available as non-consumers. They are more difficult as they will be late adopters and perhaps more price sensitive and less motivated by features.

    Windows Phone still has quite a bit of opportunity outside the US, but in the US (and in Europe which is not much different) the competition will increasingly be with rival incumbencies not with non-consumption. As the custodians of the Windows franchise, Microsoft should be well aware of the inherent difficulties with competing with installed platforms.

  7. The tell-tale signs suggesting a platform's demise

    Research · 74 comments

    In the post on OS turning circles, I used the concept of a radius of turning as an analogy for agility. One problem with the analogy is that turning in circles implies a return to a starting point or at least a closing of the loop. The idea is that there is lifecycle repetition. However, in reality, this does not apply to the world of operating systems.

    An OS, as a platform, usually has a finite life. It is born, grows and usually reaches a point where it is no longer supported. Sometimes, a new platform is born to take its place from the original owner but more often a replacement comes from a new challenger company.

    So rather than circles, the analogy of OS lifetimes may be more accurate.

    If we do think of platforms as finite, then the natural question is what causes an end? We need to look for patterns which may indicate when a platform is reaching end of life.

    The difference in this analysis is that the measure of "age" of a platform I use is not time per se but versioning. The logic is that each major version is a meaningful and significant improvement in a platform which needs to be delineated, marketed and celebrated. It embodies the business logic as well as the engineering logic of the platform custodian.

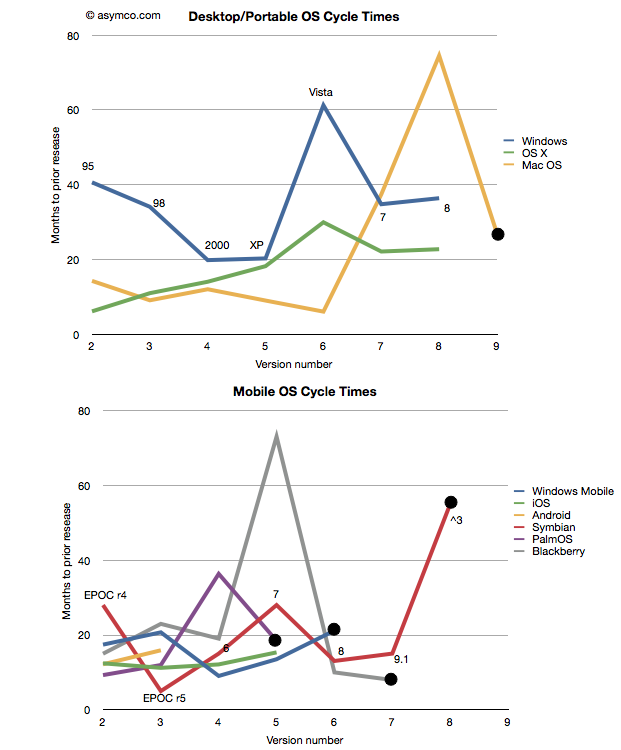
    Taking the data from the last post I added a few more platforms: Symbian[1], PalmOS and Blackberry OS[2] to seek out patterns. I also separated the desktop/portable OS's from Mobile OS's and plotted these version-demarcated lifespans.

    One thing to observe is that the scales of the two charts are comparable. There are examples of short- and long-term version updates and the number of iterations (lifespan) can be similar. I noted also that there were several platforms which have reached end-of-life[3][4]. Those platforms have a big black dot at the end of the line.

    That leads to another observation. The end of a platform seems to be indicated not by simple age (the shortest lived was six years and the longest lived was 16) nor by the number of versions (PalmOS lived for five while MacOS lived for nine). Instead the end of life is most clearly visible as a lengthening of the development cycle.

    Note that each platform that ended was preceded by a spike into the vertical--a significant delay in the release of a version. The data is one thing, but it's anecdotally supported by observation. Industry observers note that delays in improving the product are symptoms of some fundamental architectural or marketing roadblock. In the case of Mac OS, Apple struggled to bring modernity to its "Classic" OS. It need memory management, more reliability and a better file system to support the move to networking and media hub use that defined the consumer expectations of a PC.

    There was a change in the basis of competition, away from pure productivity and more toward entertainment that turned out to be more demanding in new ways. Apple had to move away from Mac OS and lost time with its internal Copland effort before punting with NextSTEP. Similar transitions are visible with Palm (from PalmOS to WebOS), Microsoft (from Windows Mobile to Windows Phone) and Nokia (from Symbian to MeeGo) and RIM (from Blackberry OS to QNX). In fact, survival of a transition is relatively rare and never without significant pain and loss of value or share.

    This is also understandable through the lens of disruption theory. As a product reached the point of being good enough, "breakthroughs" are harder to come by. Engineers and marketers struggle to push the product into increasingly rarefied strata of performance. The old architecture does not fit the new demands but it's crammed into them anyway. This last big push is then followed by a stall and ultimate demise. Meanwhile, an entrant gains lift in the rich atmosphere of new bases of competition with an architecture that's built specifically for it. The process then repeats.

    And so the charts relate the same story of sustaining improvements followed by inevitable last gasps that Clayton Christensen first illustrated[5] in The Innovator's Dilemma. A book that came out just as the first mobile platforms cataloged in these charts began their ascent.

    ---

    Notes:

    1. Versions of Symbian do not match easily to integer values. I used the versions as recorded by pdadb.net. The sequence is as follows: EPOC Release 3: "1", Release 4: "2", Release 5: "3", Symbian OS 6.0: "4", OS 7.0: "5",  OS 8.0: "6", OS 9.1: "7" (9.0 was deproductized), Symbian ^3: "8". Symbian ^4 has been cancelled. These original version numbers are noted on the chart.
    2. The times recorded are for "general availability of product" which in the case of mobile OS's means the time when a device using that OS was released.


      Symbian
      PalmOS
      Blackberry
      Jun-97
      Jun-96
      Jan-99
      Oct-99
      Mar-97
      Apr-00
      Mar-00
      Mar-98
      Mar-02
      Jun-01
      Mar-01
      Oct-03
      Oct-03
      Oct-02
      Nov-09
      Nov-04
      Sep-10
      Feb-06
      May-11
      Sep-10
    3. End of life is defined as the last version generally available. In some cases (e.g. PalmOS 6) newer versions are built but they may not be released into a working complete product.
    4. Windows Mobile is treated differently here than in the previous post. I chose to declare it EOL after version 6 and consider Windows Phone as a separate OS. This is because the name change is indicative of a break with the past. As before, I defer decisions about continuity to the developers and/or marketers who choose the naming conventions.
    5. See slides 3 and 5 here
  8. OS turning circles: Questioning Windows' maneuverability

    Podcast · 137 comments

    [Updated with Mac OS versions. See footnote 3.]

    I'm glad Windows 8 is named the way it is. With Windows 7 Microsoft went to a numbering system which is much more rational than the mixed naming of the past. The number 8 actually corresponds to the actual sequential number of major versions of Windows released to date.

    Windows proper actually did not start with what was called "Windows 1.0". Windows actually started in April 1992 when Windows 3.1 was released. It was the first Windows which was an operating environment onto itself, apart from DOS. It was followed by Windows 95 (which we can call "2"), Windows 98 ("3"), Windows 2000 ("4"), Windows XP ("5"), Windows Vista ("6"), Windows 7 and now Windows 8.

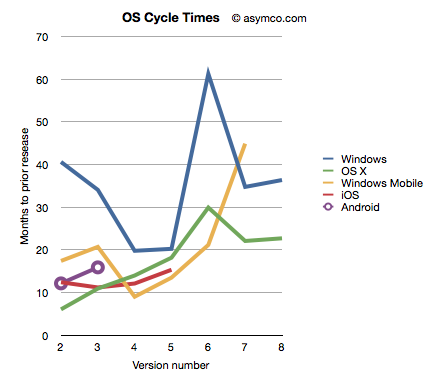
    Given this nomenclature and the dates of general availability of said versions, we can derive a measure of the frequency of upgrades. For example Windows "2" followed about 41 months after "1" and "3" took 34 months after "2". If we continue this for all the versions, and assume "8" will launch by October next year, we can plot the cycle times of new Windows versions.

    To make the story more interesting I added the same data for other OS platforms. OS X, iOS and Android have version numbers which correspond to the sequential order in which they were released. I am assuming that the numbering system (1.0, 2.0, 3.0 etc.) are meaningful and that major releases are given a new integer value.[1]

    I also added Windows Mobile which suffered from the same confused numbering that Windows suffered until the current Windows Phone 7. To create a map to integer values I used the following: Pocket PC 2000 is "1", Pocket PC 2002 is "2", WinMo 2003 is "3", WinMo 2003 SE is "4", WinMo 5 is "5", WinMo 6 is "6" and Windows Phone 7 is "7". There is no clarity when and what Windows Phone 8 will be so that is left off the chart.

    The chart above does give a clue that Windows is a bit slower (more months between releases) than alternatives. However, the point I want to convey is that this cycle time can be a strategic advantage. A faster upgrade cycle means more rapid adoption of improvements, not to mention more revenues. Rather than a line chart, the better way to visualize it is as a turning circle.

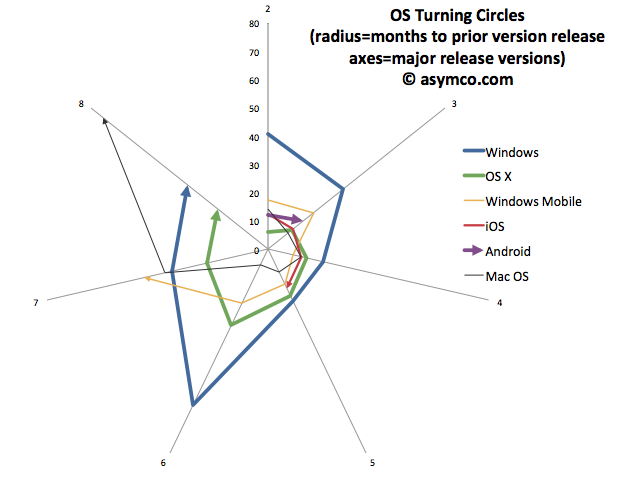
    The analogy is from aerial combat where a plane that can "turn inside" an opponent can get into a firing position. The tightness of turning circles also means that a competitor can iterate more quickly and thus move up the trajectory of improvements necessary to remain competitive more rapidly. To that end, I re-plotted the data above with radial axes.

    The chart clearly shows how among desktops, OS X has been tighter than Windows[3]. Furthermore, mobile OS's have been, typically, more agile than desktop OS's. The exception being Windows Mobile which had significant architectural and business model challenges. It will be interesting to watch the radius of Android. So far it seems to be tight, but as tablet functionality has been added, the speed of change has slowed slightly.

    However, the big contrast is between mobile and desktop. Microsoft tries with Windows 8 to merge the two. But these are different ecosystems. Buyers, OEMs, users, all have different behavioral patterns (jobs-to-be-done) for mobile OS vs. desktop/portables. Will the cycle time for Windows 9 and Windows 10 tighten up? Can Microsoft operate its OS division at this new cycle time?

    What is even more bad news is that the most important customers for Microsoft, enterprises, actually upgrade every other version. The Windows "radius" is nominally averaging about 35 months but large account adoption is closer to 60 months.

    The contrast is then striking: Consumerized devices with over-the-air updates on a 12 month cycle are five times more agile than a traditional corporate Windows desktop. Another way to look at this is that for every change in a corporate desktop environment, the average user will change their device experience five times. Although Microsoft might find comfort in Enterprises' leisurely pace of change[2], those are the wrong customers to keep happy going forward.

    The implications are left as an exercise to the reader, but I would argue that along with the asymmetry in business model around pricing that I highlighted in the last Critical Path podcast, Microsoft has a significant operational asymmetry with devices as a new class of computers.

    ---

    Notes:

    1. The dates of general availability of various versions of operating systems.


      Version
      Windows
      OS X
      Windows Mobile
      iOS
      Android
      1
      4/6/92
      3/24/01
      4/19/00
      6/29/07
      10/21/08
      2
      8/24/95
      9/25/01
      10/1/01
      7/11/08
      10/26/09
      3
      6/25/98
      8/24/02
      6/23/03
      6/17/09
      2/22/11
      4
      2/17/00
      10/24/03
      3/24/04
      6/21/10
      5
      10/25/01
      4/29/05
      5/9/05
      10/1/11
      6
      11/30/06
      10/26/07
      2/12/07
      7
      10/22/09
      8/28/09
      11/8/10
      8
      11/1/12
      7/20/11
       
    2. While at Nokia's Enterprise Solutions I was witness to this difference between the cycle time of devices and the pace of adoption of Enterprises. The fundamental disconnect was that the sales cycle for a "solution" was longer than the shelf life of a device upon which that solution was predicated. Needless to say, Nokia Enterprise Solutions did not last long. Nor do we see today any significant Enterprise-focused mobile device businesses (RIM itself moved to consumerize its products years ago.)
    3. I added Mac OS data to the second chart to also illustrate that no company is immune from spinning out of control. Mac OS clearly went spun out after version 6 with increasing delays leading to its demise and replacement. You can also note that its replacement (OS X) was able to straighten-up and fly right. The lesson may be perhaps that ditching and starting over is a viable option.
  9. "Other" vendors sell 10% of Smartphones but 30% of voice-oriented phones

    Research · 12 comments

    In the last post, I highlighted the difference between smartphones and non-smart device sales last quarter. The trajectory of share growth for smart devices would appear to have accelerated due to Android.

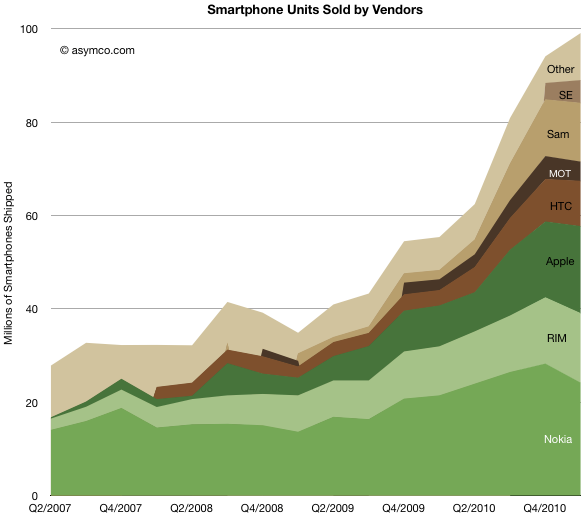
    The following charts show the evolution of smartphone vendors and platforms over the last few years.

    Like in the past, I used color clustering to show the separation between "integrated" (in green) and "modular" (in brown) platforms and their users.

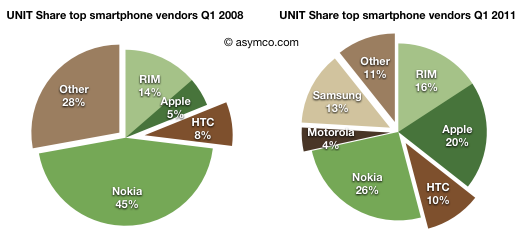
    Unlike the non-smart market where "other" make up 30% of the market, smartphones are still a big brand business. "Other" make up only 11% of units. and that number has been trending down. It would seem that the age of unbranded Android phones is still not upon us.

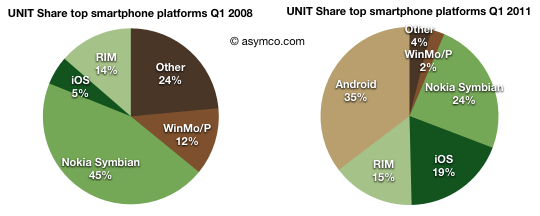
    Comparing three years "before and after" here is Q1 2008 vs. Q1 2011 by vendors share:


    Apple added 15% of share, Samsung 13%, Motorola 4%, RIM and HTC 2%. Nokia lost nearly 20% of share.

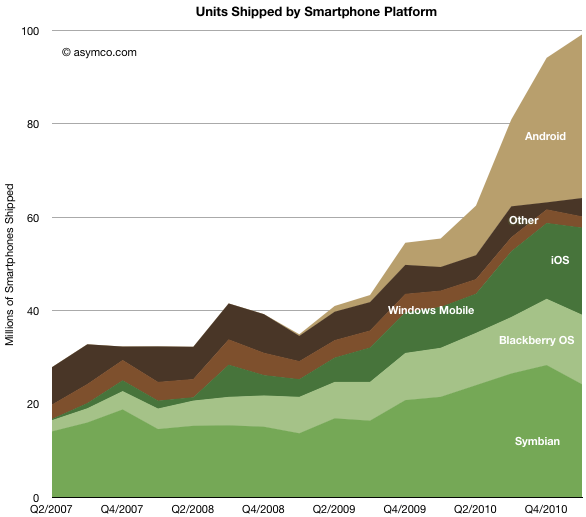
    From a platform point of view, the unit chart looks like this:

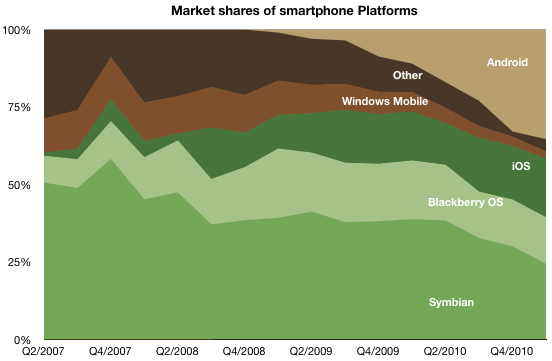
    Note that Android's growth came at a time when Symbian had a terrible quarter. The evidence is visible in the share chart:

    Android's gain seems to be at the expense of Other, Windows Mobile and Symbian. In the pie chart snapshot over a three year period the transfer seems clear.

    Android took 35% of share, iOS 14% and RIM 1%. Windows Mobile/Phone has collapsed to 2%.

    But again I would caution about drawing "sustainability" conclusions from looking at this market with a share perspective. As it's growing at a huge rate (73% year/year) it's bound to be become so large that single digit share numbers still amount to vast ecosystems while huge shares of fragmented products don't amount to much of value. To emphasize the point, I would remind that in 2008 Symbian was not just Nokia but a lot of "Other" was made up of Symbian in Japan. The combined fragmented footprint of Symbian was well over 60% of the market. It did not do much good for the platform.

  10. HTC and self-determination

    Research · 74 comments

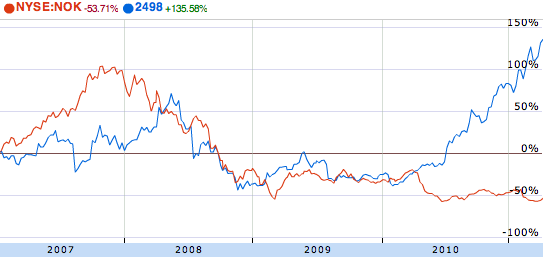
    HTC's market cap has just overtaken Nokia's. While market capitalization is a fickle thing, shifting with sentiment, this is still a remarkable feat. Nokia's market capitalization has almost halved in the space of a year while HTC has more than tripled from $10 billion to over $33 billion.

    If you roll back to 2007 and the start of the modern era of smartphones, you can see how the two companies stocks traded places:

    (source: Google finance)

    The recession was hard on everybody but HTC soared during 2010 while Nokia never recovered. Markets reward unforeseen growth and typically that means above-market growth.

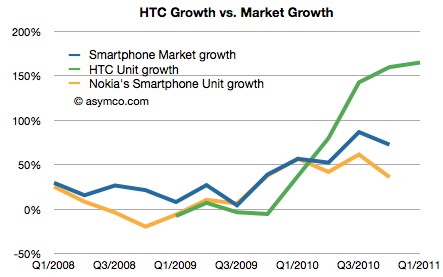
    That's reflected in the following chart (admittedly units and not profits, but pricing and margins for both have remained relatively steady.)

    As Nokia's growth lagged the market the stock was punished. As HTC's growth exceeded the market's growth, the stock was rewarded.

    But there are a few more observations to make:

    • HTC's smartphone business was under-performing the market for most of 2009. In fact, it was even in negative growth for three quarters.
    • The surge in growth coincided with HTC adding Android to its portfolio and given no other changes, seems to be causal.
    • Although not within the time range of the charts above, HTC had another period of rapid growth in the mid 2000s.

    A year ago HTC was making excuses and apologizing. Today they are more valuable than the largest phone vendors. All thanks to Android.

    But why no thanks to Microsoft?

    HTC was the primary Windows Mobile vendor a few years ago. They claimed at one point to have shipped over 80% of all Windows Mobile devices. They were also the leader in the Pocket PC franchise as they were the ODM behind the iPaq brand from HP/Compaq. HTC would not exist today were it not for Microsoft.

    The relationship is such that HTC is paying Microsoft for protection from (potential) Android IP infringements. HTC has also licensed Windows Phone though the relationship between Nokia and Microsoft must give them pause.

    But that's the whole problem. Those who live by the sword shall die by it. HTC was a Microsoft dependent and now they're a Google dependent. As the basis of innovation shifted, HTC was agile enough to make the transition. Perhaps they can execute a portfolio switch yet again as their upstream suppliers change whims or business models.

    But then again, as we saw with Windows Phone, perhaps not.

    If HTC wants to control its destiny it needs to control its suppliers. Now that its power and brand have grown, it needs software because in their market software is self-determination.

  11. The controversy of playing it safe: What's IDC's Smartphone Market Message?

    Research · 53 comments

    IDC released a new forecast for the worldwide smartphone market which included a long range forecast--all the way to 2015.

    Most people fixated on the share data in 2015. Not hard to do since whoever wrote the press release highlighted this flashy headline. Putting aside the three significant digits of accuracy on every data point and the hard to swallow declaration that a painfully underperforming (in more ways than one) Windows Phone will overtake iOS and BlackBerry to become the second largest platform by units/year in 2015, there is much more to the report.

    Using only the public data from the press release we can put together a pretty good picture of the transition being forecast and determine some of the (unstated) assumptions being made. It's these assumptions about the underlying market dynamics which illuminate far more than the falsely precise share data.

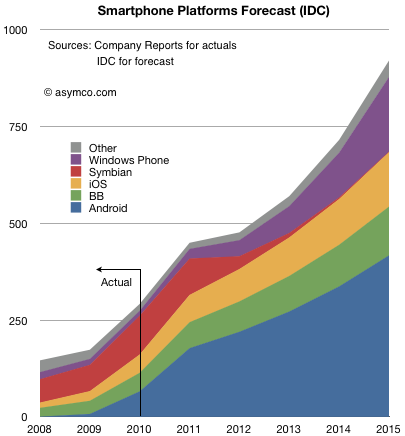
    The following chart shows both historic platform performance (which is detailed in the Asymco Interactive data sets on a quarterly basis) and the forecast based on the given compound growth rate published.[1]

    I see three main assumptions being made:

    1. Nokia (or more precisely Symbian) share will be swapped for Windows Phone. The transition period 2011 to 2015 shows approximately 150 million Symbian devices will be sold which is the stated goal for Nokia. IDC is making an assumption that the hardware vendors will roughly maintain their respective shares irrespective of platform dynamics and that Nokia will switch its share of users from one platform to another in a predictable way.
    2. iOS and BlackBerry will maintain share. Presumably this is also driven by hardware channel dynamics and relationships with carriers.
    3. Android will grow share slightly but the vast bulk of growth will come from market growth.
    4. Market growth is strong but undramatic.

    Overall this is not a controversial set of assumptions.

    Except perhaps that it assumes that the basis of competition in the market is unchanging. Of course it's well understood that the basis has shifted during the tumultuous 2007 to 2010 and forecasts made before the iPhone was launched sound absurd today.

    But IDC says that the unpleasantness won't happen again. From listening to the conversations going on today on this blog and elsewhere, their assumption that things will not change (again) is fairly deeply ingrained, indeed conventional wisdom. In that sense IDC is not taking any liberties with the future. The projections of current realities onto the future leads to this type of forecast and status quo defenders should be satisfied, if not rejoice.[2]

    However, there are a few more consequences of even this uncontroversial forecast which should make keen observers sit up and notice.

    If we look at more than the before and after snapshots and comfortable pie-splitting sound-bites there are some profound seismic things being implied.

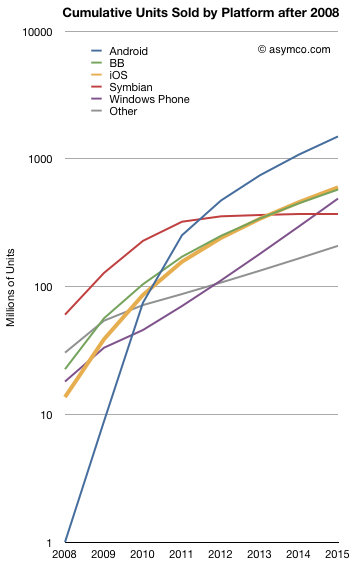
    For example the entire market will be nearly 1 billion smartphones a year (in four years!). Even more startling, considering the "race to a billion" discussion we've been having, some of the platforms seem to be reaching that threshold rather quickly. The following chart shows the cumulative unit sales for the candidate platforms on a log scale:


    Android is considered likely to break one billion units in five years post-launch. Windows Phone will sell nearly half a billion units and Blackberry will be well over that number.

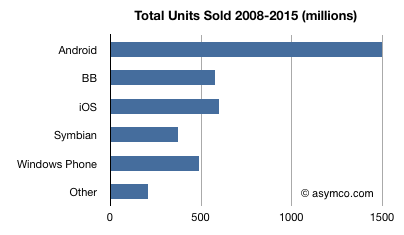
    I tallied the cumulative platform unit totals below:

    No less than four platforms will have sold half-billion units by 2015. The suggestion that Android will "win" by having the most units sold seems as hollow as the suggestion that Symbian "won" by having the most users in 2008. Not so much because it will go on to lose them, but because there were plenty of viable alternatives for users to buy and developers to build for. Half a billion users cannot be easily ignored.

    So even "safe" assumptions can lead to astonishing results in this market. Namely, IDC is saying that the smartphone market will not have any platform losers.

    There is one more thing the report implies. If you look at the ranking of leading platforms (by units/year) in 2008,  2015 and, with a little extrapolation, 2016/2017 you get:

    Rank in 2008Rank in 2015Rank in 2016/2017
    SymbianAndroidAndroid
    OtheriOSWindows Mobile
    RIMRIMiOS
    Windows MobileWindows MobileRIM
    iOSSymbianOther
    AndroidOtherSymbian


    In other words, there is a complete reversal being projected. An almost perfect flip: those on top end up at the bottom and those on the bottom end up on top. That's about as controversial as it gets. Pretty impressive for a set of safe assumptions.

    --

    Notes:

    1. You should ignore the shape of the curve between 2011 and 2015 as it assumes the CAGR is applied to every year. Although the press release shows a CAGR, the actual report may include various fluctuation in yearly growth. The starting point of 2011 and the end result in 2015 however should be the same.
    2. If, on the other hand, you believe that exponential growth, rapid gains in communications speed, new breakthroughs in interaction with devices, and entrants winning with new business models are causes for a disruption, then perhaps extrapolation may not be the way to forecast this market.