Asymco

Asymmetric Intelligence

Windows Phone

  1. Forecasting Nokia's Windows Phone sales and Microsoft's mobile customer acquisition cost

    Research · 56 comments

    Our agreement with Microsoft includes platform support payments from Microsoft to us as well as software royalty payments from us to Microsoft. In the first quarter 2012, we received a quarterly platform support payment of USD 250 million (approximately EUR 189 million). We have a competitive software royalty structure, which includes minimum software royalty commitments. Over the life of the agreement, both the platform support payments and the minimum software royalty commitments are expected to measure in the billions of US Dollars. The total amount of the platform support payments is expected to slightly exceed the total amount of the minimum software royalty commitments.

    From Nokia's Q1 2012 financial interim report

    The figure of $250 million for Q1 is the same as the amount Nokia received for "platform support" in Q4 2011. This means Microsoft has paid $500 million over two quarters. During the same time frame Nokia shipped approximately three million Windows Phone devices. The average cost to Microsoft to acquire a Nokia Windows Phone user is therefore $167 per user. This is down from $250/user in the last quarter.[1]

    If the royalty is equivalent to a license fee then the more interesting question is how and when will the royalty payments nearly match the platform support payments as expected. This might give us an estimate of what both parties are expecting from the relationship.

    If the payment schedule of $250 million per quarter is maintained through 2014, Microsoft will have paid $3.25 billion to Nokia. This is well within the "billions of US dollars" range that is cited above. (The minimum would be $2 billion which would mean payments through the end of 2013).

    We also need to estimate the royalty payment structure. One figure that has been circulating for a long time is that Microsoft prices Windows Phone (and its antecedent Windows Mobile) at $15/unit. It's an aggressive price point for a mobile software license and should be subject to volume discounts but let's assume it's correct. If it is correct then the only remaining question is how quickly will Windows Phone units grow at Nokia?

    One way to begin is to calibrate WP growth to iPhone growth. For the first two quarters iPhone and Lumia have sold at rough parity.[2] iPhone sold 1.4 million in its first quarter (including opening weekend sales of 270k in previous quarter) while Nokia sold "approximately" one million Lumias in its first quarter[3]. In the second quarter Nokia cited 2 million Lumia units and Apple had 2.3 million iPhone sold in Q4 07. So far Lumia is slightly under the iPhone ramp, but let's give it the benefit of doubt.

    If we  apply iPhone growth rates to Lumia then we have the following sales forecast for Nokia's Windows Phones:
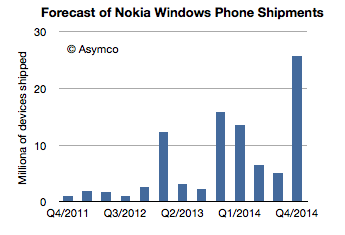
    This looks like healthy growth, as was the iPhone's. However, this "iPhone growth" pattern only results in about $1.4 billion in payments in exchange for $3.25 billion from Microsoft, leaving a deficit of $1.9 billion in the "platform support" balance.

    To erase the deficit, I tried an approach where I assigned 3 million and 4 million for Q2 and Q3 shipments respectively then applied a constant (y/y) growth rate thereafter. Solving for a figure of growth which results rough parity with platform support payments gives us about 250% growth. The resulting sales profile looks like this:
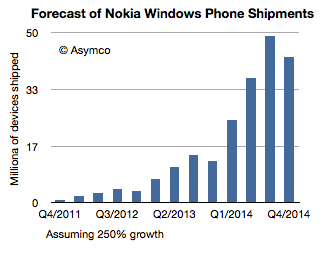
    This ramp would result in 210 million Windows Phones shipped over about three years. It would also generate nearly $3.2 billion in "royalties" for Microsoft offsetting $3.25 billion in "platform support" payments by Microsoft to Nokia.

    There are many assumptions in this, royalty rate and length of contract chief among them, but the key question should be a sanity check: is this a feasible product ramp. It's certainly far faster growth than Apple has been able to achieve. On average Apple obtained about 160% quarterly y/y growth. It also exceeds the growth rate that Samsung has been able to achieve (165 to 170 million smartphones shipped from a standing start three years ago). It implies 150 million units shipping in the third year of sales and nearly 50 million in a peak quarter. It assumes perhaps as much as 20% market share in smartphones in 2014. It's certainly ambitious.

    But even if it's achieved, it's only a break-even point for Microsoft's relationship with Nokia. It would imply that payments to and payments from Nokia would be in balance. The road to (dare one say it?) profitability for Microsoft in mobile would just begin to be visible at that point.

    ---

    Notes:

    1. What the quote above also reveals is that Nokia is also expecting to pay back some of these "support payments" in the form of "royalty payments" for the software. That's an interesting word choice as usually an OEM would pay a license rather than a royalty for software. I'm not sure if this implies anything but it may.
    2. See also Charles Arthur's analysis of comparable growth ramps for mobile phone platforms here.
    3. This figure was cited "to date" in a March statement so actual calendar Q1 may have been less, perhaps 650k.
     

  2. The opportunity cost of Windows Phone

    Research · 69 comments

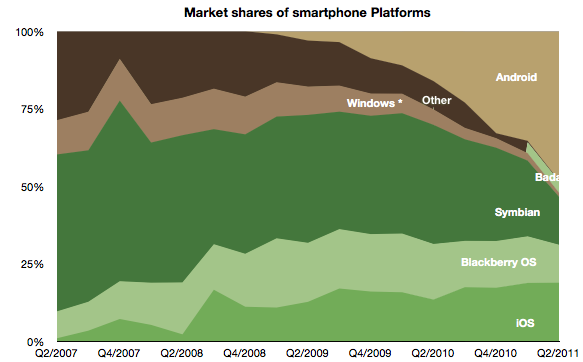
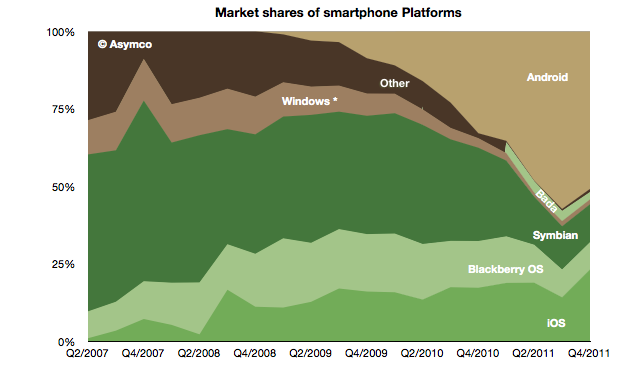
    The global mobile OS market shares for Q4 shows a continuing (but diminished) leading share.

    At the end of last year Android's unit share reached 51% which is down from about 57% during the third quarter. iOS reached 23%, followed by Symbian at 12%, RIM at 9%, Bada at 2.4%, Windows Phone at 1.6% and Other at 1%.

    When seen on a year/year basis Android gained 18 points of share in Q4 while Symbian lost 18 points. iOS gained 6 points of share and RIM lost 6 points. Bada gained 2.5 points and Windows lost 1.5 points.

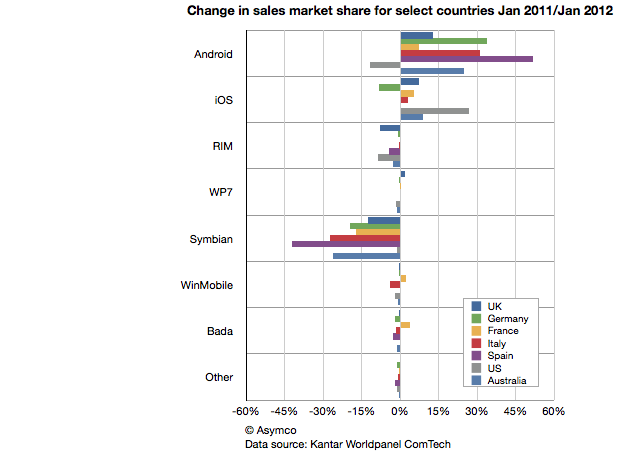
    This symmetry can also be observed in another set of data. Published in The Guardian Kantar Worldpanel ComTech data shows the OS share changes for January on a year/year basis for a select set of countries.

    Android share gains do seem to be mirrored by Symbian share losses on a country-level.

    This should be most interesting to Nokia and Microsoft as both have a lot riding on Windows Phone replacing Symbian sales. If there should be a recovery in the fortunes of these companies, it would seem that their strategies should focus primarily on stemming and then reversing the losses to Android.

    Microsoft's strategy of increasing the cost structure for Android through IP licensing is certainly part of this picture but it's a slow process to turn that disincentive for Android into a large incentive for Windows Phone.

    Indeed, the speed with which Android handsets can be developed seems to be a key value of that operating system and one for which Microsoft does not have a good answer.  Nokia is now one year into its commitment to the Microsoft platform and it has a very limited portfolio to show for it (and limited sales as well.) As a result, Nokia's Symbian business evaporated very rapidly. More rapidly than the company anticipated.

    The dilemma for other vendors may well be how long will it take for them to develop a replacement for their Android portfolio in Windows Phone.

    The opportunity cost of this switch is subtle and insidious but may be the root of why we don't see a stampede toward Microsoft. Conversely, Android contract-free, implement-at-will availability may be its greatest selling point.


  3. Will Windows Phone get to compete with non-consumption?

    Research · 45 comments

    Before diving into the answer to the question in the title, there is some new data to digest.

    The latest from comScore shows consistency with the previous months of smartphone growth in the US.

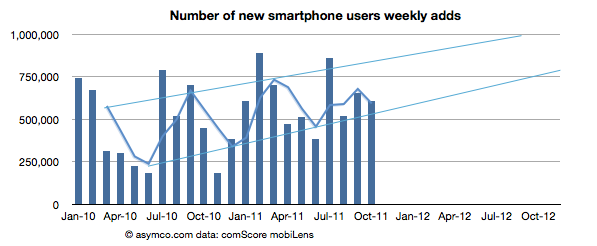
    • The growth rate was 607k/wk new-to-smartphone users. This is slightly down from 654k/wk for the previous month but up significantly from 450k/wk the year before.
    • The penetration of smartphones reached 38.5% (non-smartphones are at 62%)
    • The penetration should reach 50% before September 2012 with about 1.2% being converted every month.

    The following chart shows the weekly add rate with a three-period moving average:

    This chart is important in that it should first show signs of inflection in growth. That does not seem to be happening yet.

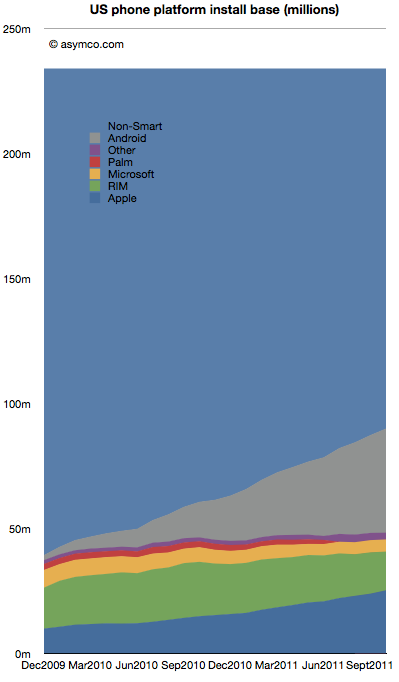
    The installed base by platforms is shown below:

    Android is estimated to have grown to 41.7 million users in the US, adding 2.5 million users in the last month. Android is adding half of Microsoft's entire US mobile base every month.

    RIM BlackBerry lost one million users in October. RIM's slide has accelerated again with over 3.7 million leaving the platform in the last six month. With 15.5 million subscribers, RIM has fewer users in the US today than it did in late 2009.

    iPhone gained 1.34 million. Installed share increased slightly to 28% from 27.4% the previous month. There are now over 25 million iPhone users (above age 13) in the US.

    Windows Mobile/Phone had no perceptible change (-34k) indicating perhaps that the losses in Windows Mobile are being erased by gains in Windows Phone. Microsoft's platform stopped losing significant users six months ago. Whereas the bleeding has been stopped, overall number of users remains at a rather poor 5 million or 5.4% share.

    "Other" which includes Symbian and WebOS lost another 184k users to reach only 2.7 million users.

    There are still 144 million smartphone non-consumers.

    Android and iPhone now make up nearly three quarters of all smartphone ownership in the US. That's a total of 67 million users. With no sign of slowing, the chances are that there are at least 100 million users still remaining to convert. Sounds like an attractive target. But that target is shrinking fast. The rates of adoption signal saturation of most likely buyers will happen toward the end of next year.

    At least 25 million new Android users will be gained and at least 10 million new iPhone users will be created in the next 12 months. That's 35% of remaining non-consumption. Assuming some acceleration, it's not hard to see 50% being claimed by the two entrenched incumbents.

    This leads to an interesting positioning question. Is Windows Phone destined to compete with consumption or non-consumption? If traction is not forthcoming in the next 12 months, that leaves a very difficult last 50 million available as non-consumers. They are more difficult as they will be late adopters and perhaps more price sensitive and less motivated by features.

    Windows Phone still has quite a bit of opportunity outside the US, but in the US (and in Europe which is not much different) the competition will increasingly be with rival incumbencies not with non-consumption. As the custodians of the Windows franchise, Microsoft should be well aware of the inherent difficulties with competing with installed platforms.

  4. The Global Smartphone Market Landscape

    Research · 79 comments

    There is finally enough information to try to give an estimate of the smartphone market as a subset of the overall phone market.

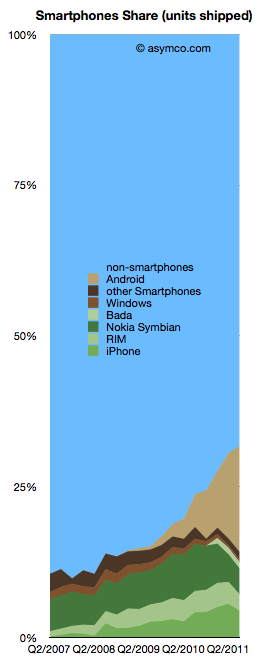
    The chart to the left shows the overall picture.

    To sum up: The smartphone market has now reached over 30% of shipments. Non-smart devices are at 69% of total. The individual phone platform shares are as follows:

    1. Android (and Android-like): 17.6%
    2. iOS (iPhone only) 4.4%
    3. Nokia Symbian: 4.3%
    4. BlackBerry: 2.76%
    5. Bada: 1%
    6. Windows Phone 0.5%

    The past quarter was the first where there is evidence of significant non-seasonal decline in incumbent platforms. Both RIM and Symbian saw two sequential drops in volume. The iPhone had a seasonal (or, more accurately, transitional) decline. Windows Phone had a very modest increase in share from 1.3% to 1.7% share though this is well below a margin of error in the estimate.

    Android (and Android-like) shipments ballooned to nearly 70 million but sell-through could be about 10 million less. Nearly one in five phones sold is now powered by an Android variant. A remarkable story since the share was zero less than three years ago

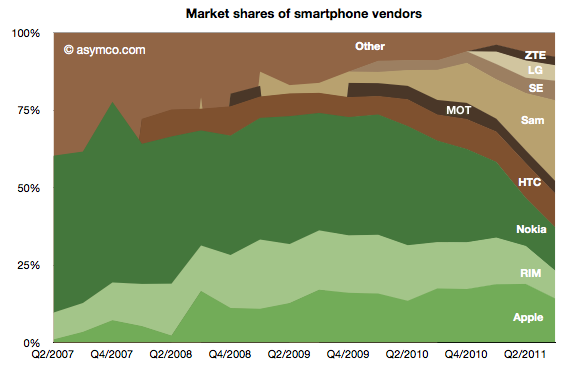
    Of the vendors involved, here is the division of share:

    Samsung achieved 26% share, nearly swapping share with Nokia over a single year. Nokia reached below 14% while Apple maintained above 14% but down from 19% the quarter prior. HTC overtook RIM with 11% vs. 9%. Sony Ericsson is around 6% and Motorola probably slipped below LG with 4% vs perhaps 5% respectively.

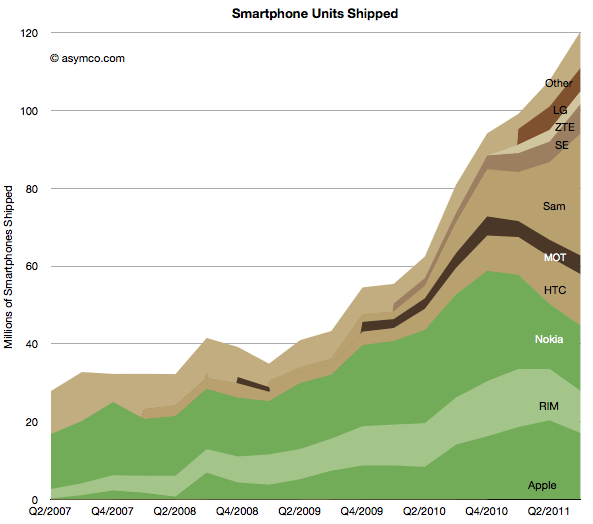
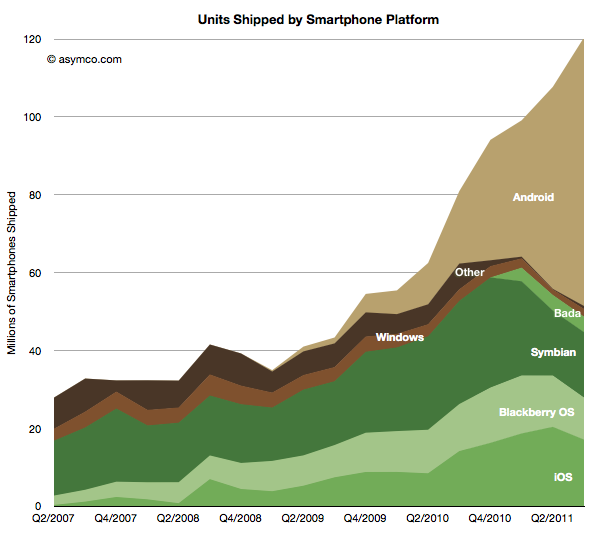
    The absolute performance of shipments by vendor and platform follows:


      I maintained the historic distinction between integrated (green) and modular (brown) OS strategies to show how the value chain evolved. As Nokia swaps its share to a licensed Windows Phone the share held by integrated vendors is likely to shrink even further.

    Does this mean it's the end of integration? Or even more importantly, as I have previously suggested the link, is this the end of innovation in the mobile phone market?

    It would appear that with 30% smartphone share, the vast majority of phone vendors are ready to abandon any ambition to obtaining extraordinary profits from mobile devices.[1] Apart from Apple, there seems to be complete capitulation to being manipulated by platform orchestrators with unpredictable or opaque intentions.

    The thesis of perpetual innovation rules this out. While new input methods offer a clue that visual interaction and the platforms that depend on it are not permanent, the fact remains that cloud computing and the coupling of additional intelligence that comes with it will enable new points of integration and the positioning of these points on new jobs to be done.

    Stay tuned as we discuss the future of mobile computing. The best is yet to come.

    Notes:

    1. By extraordinary I mean margins above what a component assembler and distributor would be able to obtain--see the PC industry.
  5. Windows Phone, a year on

    Research · 103 comments

    Windows Phone is in limbo. The company acknowledged that it has performed below expectations. During the last quarter for which we have data (ending June) I have an estimate that Windows Phone sold only 1.4 million units (Gartner's sell-through analysis suggests 1.7 million). That gives Microsoft a 1.3% share of units sold (Gartner 1.6%), a new low.

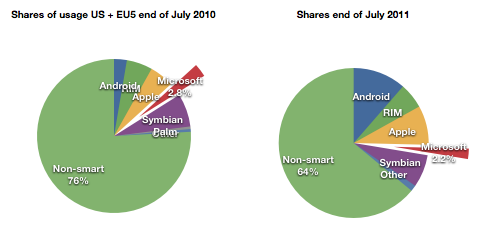
    At the same time, comScore data shows that user erosion in the US and EU5 has slowed and is holding at about 2.2% of all users.

    For its part Microsoft has lain low during the last few months. It released version 7.5 (Mango) last month to manufacturers.  It has a number of Windows Phone SKUs in the market or recently announced (27 with version 7 and eleven with version 7.5)

    It also sued Android vendors successfully and obtained royalties from the largest Android licensees Samsung and HTC. Patent royalties from Android are probably going to be higher than license revenues from Windows Phone for quite some time.

    Something is missing from this analysis. Clearly Microsoft has a plan. It's always had a plan. The plan is not easily perceived because the market Microsoft addresses itself to is not directly to the consumer--we cannot read the message. Microsoft needs to work through partners. Device vendors and operators mainly. In order to persuade them Microsoft deploys its check book.

    Put another way, the plan is that Microsoft intends to buy market share. Before we get into exactly how, we need to understand the most important but least discussed contributor to device sales: channel incentives.

    Before a phone is sold it needs to get through a mine field of obstacles: it needs to appeal to operator or distributor priorities; it needs to fill a slot in a portfolio of products for the manufacturer and the channel; it needs to acquire shelf space; it needs to appeal to some end users and, unless it has a blindingly strong brand, it needs to offer incentives to the retailer.

    This last piece of the puzzle is something of a mystery. Although not a universal practice, in many cases retail staff are paid commissions directly or indirectly by the device vendor. This relationship between the retailer and the vendor is not transparent. A buyer typically does not know what incentives are attached to a given device. Stories of salespeople steering people to and away from certain devices abound.

    Microsoft acknowledges this:

    Both Samsung and HTC Corp. have committed to increasing marketing budgets for the phones, said Andy Lees, president of Microsoft’s mobile unit, in an interview. While manufacturers will determine how the money is spent, some of it will probably go toward spurring retail staff to tout Windows Phone models, he said.

    Microsoft Phones to Get More Marketing, Sales Incentives - Bloomberg.

    In another interview:

    Q: It seems like one of the challenges is getting the salesperson in the store to push the phone.

    A: Absolutely. I think that's a number of things:

    One — they get influenced by how good the product is. The reviewers have influence with that and also their own experience.

    The second thing is the alignment with the operator. I think we're already pretty aligned and over the life of this release, we'll get even more aligned.

    Much more here: Business & Technology | Windows Phone chief Andy Lees sees time ripe for Mango | Seattle Times Newspaper.

    What's more, Microsoft and Nokia have a deal whereby at least one billion dollars from Microsoft are earmarked for the promotion of Nokia Windows Phones.

    Even prior to the launch of the Nokia relationship, with the original Windows Phone launch exactly a year ago, Microsoft made clear that it had a budget for promoting Windows Phones ($400 million in fact). In the event, the money seems to not have been spent, or spent sparingly because LG made public its disappointment. The coded language can be interpreted as a snub to Microsoft for withholding promised funds.

    Perhaps the funding was withdrawn because by the time the launch was scheduled, the Nokia deal was being negotiated. Perhaps Microsoft felt it better to put more effort behind the re-launch of the platform with Nokia on board. A re-launch which has yet to happen but seems to have already had $127 million allocated to it by Nokia alone.

    Microsoft is proud of what it has accomplished with Windows Phone because they were able to update the OS in 11 months and took only about two years to completely rebuild Windows Mobile into Windows Phone.

    But the dependence on a complex value network means that products do not reach users quickly enough and when they do the marketing message is weak, even when backed by large budgets. The real problem with Microsoft's approach is that it's neither viral like Android (because it has a price and a contract associated with it) nor is it focused and agile like Apple's. It seems to suffer from the worst aspects of modularity (market lag) without benefiting from the control over the ecosystem and end user experience that differentiates it.

    Microsoft will muddle through but the 20% share that it says is "conservative" seems anything but.

  6. The tell-tale signs suggesting a platform's demise

    Research · 74 comments

    In the post on OS turning circles, I used the concept of a radius of turning as an analogy for agility. One problem with the analogy is that turning in circles implies a return to a starting point or at least a closing of the loop. The idea is that there is lifecycle repetition. However, in reality, this does not apply to the world of operating systems.

    An OS, as a platform, usually has a finite life. It is born, grows and usually reaches a point where it is no longer supported. Sometimes, a new platform is born to take its place from the original owner but more often a replacement comes from a new challenger company.

    So rather than circles, the analogy of OS lifetimes may be more accurate.

    If we do think of platforms as finite, then the natural question is what causes an end? We need to look for patterns which may indicate when a platform is reaching end of life.

    The difference in this analysis is that the measure of "age" of a platform I use is not time per se but versioning. The logic is that each major version is a meaningful and significant improvement in a platform which needs to be delineated, marketed and celebrated. It embodies the business logic as well as the engineering logic of the platform custodian.

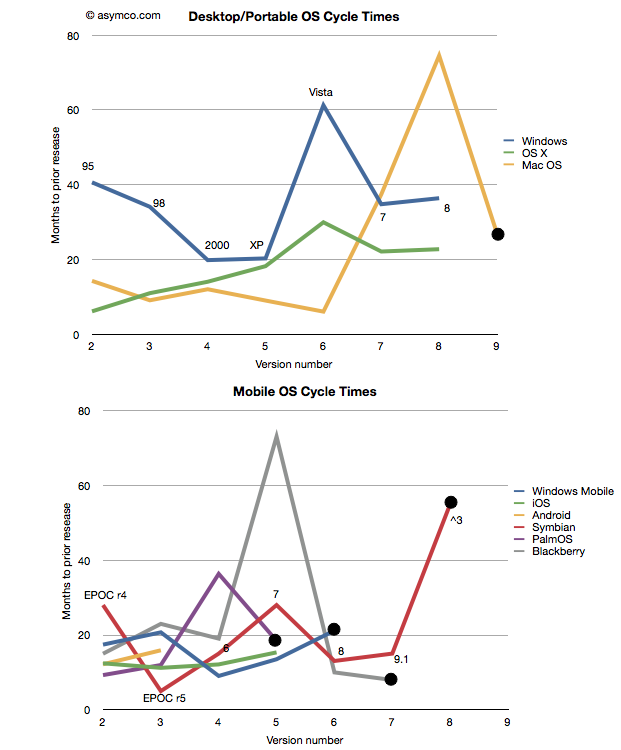
    Taking the data from the last post I added a few more platforms: Symbian[1], PalmOS and Blackberry OS[2] to seek out patterns. I also separated the desktop/portable OS's from Mobile OS's and plotted these version-demarcated lifespans.

    One thing to observe is that the scales of the two charts are comparable. There are examples of short- and long-term version updates and the number of iterations (lifespan) can be similar. I noted also that there were several platforms which have reached end-of-life[3][4]. Those platforms have a big black dot at the end of the line.

    That leads to another observation. The end of a platform seems to be indicated not by simple age (the shortest lived was six years and the longest lived was 16) nor by the number of versions (PalmOS lived for five while MacOS lived for nine). Instead the end of life is most clearly visible as a lengthening of the development cycle.

    Note that each platform that ended was preceded by a spike into the vertical--a significant delay in the release of a version. The data is one thing, but it's anecdotally supported by observation. Industry observers note that delays in improving the product are symptoms of some fundamental architectural or marketing roadblock. In the case of Mac OS, Apple struggled to bring modernity to its "Classic" OS. It need memory management, more reliability and a better file system to support the move to networking and media hub use that defined the consumer expectations of a PC.

    There was a change in the basis of competition, away from pure productivity and more toward entertainment that turned out to be more demanding in new ways. Apple had to move away from Mac OS and lost time with its internal Copland effort before punting with NextSTEP. Similar transitions are visible with Palm (from PalmOS to WebOS), Microsoft (from Windows Mobile to Windows Phone) and Nokia (from Symbian to MeeGo) and RIM (from Blackberry OS to QNX). In fact, survival of a transition is relatively rare and never without significant pain and loss of value or share.

    This is also understandable through the lens of disruption theory. As a product reached the point of being good enough, "breakthroughs" are harder to come by. Engineers and marketers struggle to push the product into increasingly rarefied strata of performance. The old architecture does not fit the new demands but it's crammed into them anyway. This last big push is then followed by a stall and ultimate demise. Meanwhile, an entrant gains lift in the rich atmosphere of new bases of competition with an architecture that's built specifically for it. The process then repeats.

    And so the charts relate the same story of sustaining improvements followed by inevitable last gasps that Clayton Christensen first illustrated[5] in The Innovator's Dilemma. A book that came out just as the first mobile platforms cataloged in these charts began their ascent.

    ---

    Notes:

    1. Versions of Symbian do not match easily to integer values. I used the versions as recorded by pdadb.net. The sequence is as follows: EPOC Release 3: "1", Release 4: "2", Release 5: "3", Symbian OS 6.0: "4", OS 7.0: "5",  OS 8.0: "6", OS 9.1: "7" (9.0 was deproductized), Symbian ^3: "8". Symbian ^4 has been cancelled. These original version numbers are noted on the chart.
    2. The times recorded are for "general availability of product" which in the case of mobile OS's means the time when a device using that OS was released.


      Symbian
      PalmOS
      Blackberry
      Jun-97
      Jun-96
      Jan-99
      Oct-99
      Mar-97
      Apr-00
      Mar-00
      Mar-98
      Mar-02
      Jun-01
      Mar-01
      Oct-03
      Oct-03
      Oct-02
      Nov-09
      Nov-04
      Sep-10
      Feb-06
      May-11
      Sep-10
    3. End of life is defined as the last version generally available. In some cases (e.g. PalmOS 6) newer versions are built but they may not be released into a working complete product.
    4. Windows Mobile is treated differently here than in the previous post. I chose to declare it EOL after version 6 and consider Windows Phone as a separate OS. This is because the name change is indicative of a break with the past. As before, I defer decisions about continuity to the developers and/or marketers who choose the naming conventions.
    5. See slides 3 and 5 here
  7. OS turning circles: Questioning Windows' maneuverability

    Podcast · 137 comments

    [Updated with Mac OS versions. See footnote 3.]

    I'm glad Windows 8 is named the way it is. With Windows 7 Microsoft went to a numbering system which is much more rational than the mixed naming of the past. The number 8 actually corresponds to the actual sequential number of major versions of Windows released to date.

    Windows proper actually did not start with what was called "Windows 1.0". Windows actually started in April 1992 when Windows 3.1 was released. It was the first Windows which was an operating environment onto itself, apart from DOS. It was followed by Windows 95 (which we can call "2"), Windows 98 ("3"), Windows 2000 ("4"), Windows XP ("5"), Windows Vista ("6"), Windows 7 and now Windows 8.

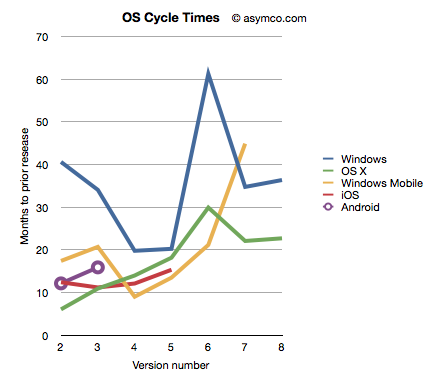
    Given this nomenclature and the dates of general availability of said versions, we can derive a measure of the frequency of upgrades. For example Windows "2" followed about 41 months after "1" and "3" took 34 months after "2". If we continue this for all the versions, and assume "8" will launch by October next year, we can plot the cycle times of new Windows versions.

    To make the story more interesting I added the same data for other OS platforms. OS X, iOS and Android have version numbers which correspond to the sequential order in which they were released. I am assuming that the numbering system (1.0, 2.0, 3.0 etc.) are meaningful and that major releases are given a new integer value.[1]

    I also added Windows Mobile which suffered from the same confused numbering that Windows suffered until the current Windows Phone 7. To create a map to integer values I used the following: Pocket PC 2000 is "1", Pocket PC 2002 is "2", WinMo 2003 is "3", WinMo 2003 SE is "4", WinMo 5 is "5", WinMo 6 is "6" and Windows Phone 7 is "7". There is no clarity when and what Windows Phone 8 will be so that is left off the chart.

    The chart above does give a clue that Windows is a bit slower (more months between releases) than alternatives. However, the point I want to convey is that this cycle time can be a strategic advantage. A faster upgrade cycle means more rapid adoption of improvements, not to mention more revenues. Rather than a line chart, the better way to visualize it is as a turning circle.

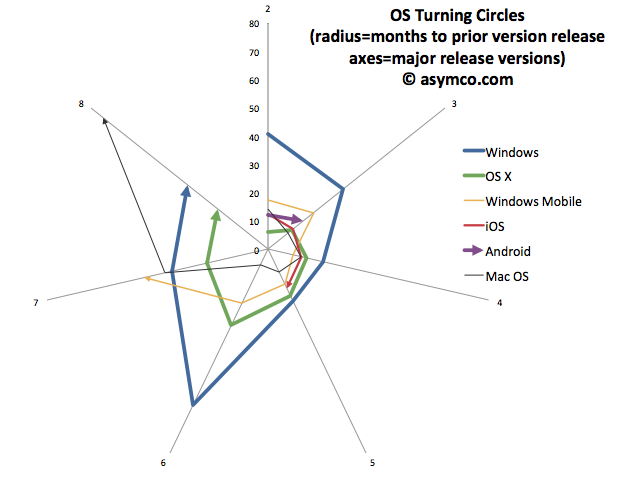
    The analogy is from aerial combat where a plane that can "turn inside" an opponent can get into a firing position. The tightness of turning circles also means that a competitor can iterate more quickly and thus move up the trajectory of improvements necessary to remain competitive more rapidly. To that end, I re-plotted the data above with radial axes.

    The chart clearly shows how among desktops, OS X has been tighter than Windows[3]. Furthermore, mobile OS's have been, typically, more agile than desktop OS's. The exception being Windows Mobile which had significant architectural and business model challenges. It will be interesting to watch the radius of Android. So far it seems to be tight, but as tablet functionality has been added, the speed of change has slowed slightly.

    However, the big contrast is between mobile and desktop. Microsoft tries with Windows 8 to merge the two. But these are different ecosystems. Buyers, OEMs, users, all have different behavioral patterns (jobs-to-be-done) for mobile OS vs. desktop/portables. Will the cycle time for Windows 9 and Windows 10 tighten up? Can Microsoft operate its OS division at this new cycle time?

    What is even more bad news is that the most important customers for Microsoft, enterprises, actually upgrade every other version. The Windows "radius" is nominally averaging about 35 months but large account adoption is closer to 60 months.

    The contrast is then striking: Consumerized devices with over-the-air updates on a 12 month cycle are five times more agile than a traditional corporate Windows desktop. Another way to look at this is that for every change in a corporate desktop environment, the average user will change their device experience five times. Although Microsoft might find comfort in Enterprises' leisurely pace of change[2], those are the wrong customers to keep happy going forward.

    The implications are left as an exercise to the reader, but I would argue that along with the asymmetry in business model around pricing that I highlighted in the last Critical Path podcast, Microsoft has a significant operational asymmetry with devices as a new class of computers.

    ---

    Notes:

    1. The dates of general availability of various versions of operating systems.


      Version
      Windows
      OS X
      Windows Mobile
      iOS
      Android
      1
      4/6/92
      3/24/01
      4/19/00
      6/29/07
      10/21/08
      2
      8/24/95
      9/25/01
      10/1/01
      7/11/08
      10/26/09
      3
      6/25/98
      8/24/02
      6/23/03
      6/17/09
      2/22/11
      4
      2/17/00
      10/24/03
      3/24/04
      6/21/10
      5
      10/25/01
      4/29/05
      5/9/05
      10/1/11
      6
      11/30/06
      10/26/07
      2/12/07
      7
      10/22/09
      8/28/09
      11/8/10
      8
      11/1/12
      7/20/11
       
    2. While at Nokia's Enterprise Solutions I was witness to this difference between the cycle time of devices and the pace of adoption of Enterprises. The fundamental disconnect was that the sales cycle for a "solution" was longer than the shelf life of a device upon which that solution was predicated. Needless to say, Nokia Enterprise Solutions did not last long. Nor do we see today any significant Enterprise-focused mobile device businesses (RIM itself moved to consumerize its products years ago.)
    3. I added Mac OS data to the second chart to also illustrate that no company is immune from spinning out of control. Mac OS clearly went spun out after version 6 with increasing delays leading to its demise and replacement. You can also note that its replacement (OS X) was able to straighten-up and fly right. The lesson may be perhaps that ditching and starting over is a viable option.
  8. Samsung's Polyplatform Paradox

    Research · 57 comments

    Samsung has, over the years, shipped phones using almost every operating system it could get a hold of. That includes Symbian, Windows Mobile, Windows Phone, LiMo, Android, PalmOS and OPhone.

    As far as I know, today its portfolio includes Android, Windows Phone and its own Bada OS. The relaxed attitude to platform exclusivity at Samsung is in stark contrast with almost all other competitors who either for the sake of encouraging their own platforms or minimizing development costs maintained either one or two smartphone platforms.

    Samsung justified their polyplatform strategy a few years ago by saying that different platforms are popular in different regions and as they did not want to be excluded from any market, they felt that being agnostic is the best policy.

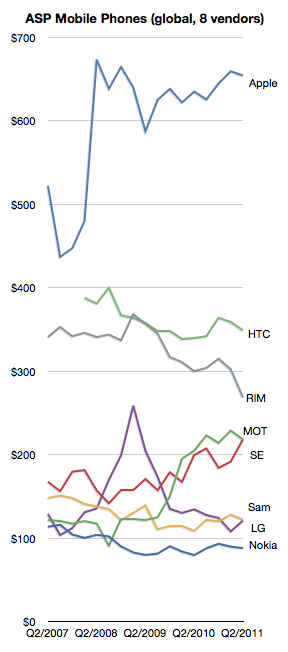
    The idea that platforms are not universal, but the result of provincial preferences is interesting. It's a concession that "politics" plays a large part in mobile markets. However, for all the volume growth the strategy has produced, the strategy has not paid off in terms of higher margins or pricing power as the following chart shows.

     So perhaps polyplatform thinking is coming to an end.

    Exhibit A is Bada itself. The idea that Samsung would build its own OS came as a surprise to anyone following their history. Why did Samsung buy a book when there's a library in town?

    Exhibit B is the repeated statements of Samsung's Chairman saying that the company should invest in software. Software!

    Exhibit C is the statement today that Samsung intends to spend some of its $9.3 billion R&D budget on Software.

    The money is expected to be used to strengthen the company technology prowess in such areas as mobile phones, semiconductors, displays and electronics products. Funds will also be allocated to software development.

    Samsung investing in software development does indicate that perhaps the company does see value in that component and would prefer not to be dependent on suppliers for it.

    In theory, as the market power of inputs (supplier power) increases due to concentration and forward integration it makes sense to backward integrate.

    As a supplier itself, however, Samsung has to ask itself if its component customers are thinking the same thing.

  9. The Post-PC era will be a multi-platform era

    Research · 104 comments

    Windows Phone Marketplace has reached 25,000 apps. That's an impressive figure given that so few devices have actually been sold. Compared with Android which is activating half a million devices per day, Windows Phone seems like a rounding error. According to Gartner, 3.6 million smartphones using a Microsoft mobile OS were sold in the first quarter of 2011, of which 1.6 million were Windows Phone 7. That implies a daily activation rate of 17,500 per day or one WP device for every 28 Android devices.

    And yet the number of apps on Windows Phone is more than 10% of the number of Android apps and Android Apps are about half of iPhone apps. As far as Windows Phone is concerned, apps are being added faster than users. Why is this?

    If we take the point of view that mobile platforms behave like the computing platforms of years gone by (i.e. Windows vs. Mac) then this is inexplicable. Developers should not be bothering with a distant third. This would be like betting on the Amiga in the era of Windows.

    But we're not in the PC era any more. That era had very high software development costs. It had very difficult software distribution channels (retail box sales typically) and very few categories of software with high price points. It was also dominated by institutional buyers which did not give quarter to small vendors. It was also a time when there were orders of magnitude fewer users and even fewer buyers.

    The post-PC era is characterized by an explosion of ideas and application of new talent to software. It's an era of immediate gratification and painless, one click distribution. App production is a cottage industry not something entrusted to only a few experts or those who can raise venture capital. It allows the small to distribute widely and get a shot at stardom. It has been (thankfully) avoided by enterprise buyers. The result is an explosion of apps: well over half a million new apps have been built in three years on three platforms that did not exist three years ago.

    So the very reasons which are driving developers to spread their bets across all and any new platforms should indicate the potential for new platforms and the sustainability of small platforms. The thesis that one dominant platform wins the mobile "war" is naive. The post-PC era will be a multi-platform era. Developers already understand this. Platform vendors know this. It's time to unlearn the lessons of the PC era.

  10. Nokia a trop écouté les réseaux télécoms

    Research · 70 comments

    My thanks to Robert van Apeldoorn, journalist for Trends Tendances Magazine, for asking good questions. My responses are reproduced below. The article (in French) is titled "Nokia a trop écouté les réseaux télécoms" and can be found in the June 23rd edition of the magazine along with more details in the article "Comment Nokia peut-il renaître?".

    -About your post “Does the phone market forgive failure”, that puts forward the idea that all mobile device vendors experiencing losses never really recover… It seems that this possible “rule” is more severe than in the computer industry. If Digital Equipement, Compaq, WordPerfect did fail, IBM and, yes, Apple, did survive failure and rebound strongly. Do you think that there is a difference between the industries? What makes the failures more lethal in the mobile device market ?

    The observation is unique to the mobile phone market and even there it's only an observation not a rule. It could be that Nokia will be the first mobile phone company that will recover from severe crisis, but history shows it to be very unlikely. I try to shed some light on the reasons why it's unlikely and what makes the mobile phone market so unforgiving. I think much of the problem rests with the fact that mobile phones are sold indirectly, through intermediaries who are amplifying both success and failure. A company like Apple was able to recover in the computer industry because it launched new products like iPod which could be sold directly to consumers. It had to convince the consumer and only the consumer. Having to convince a distributor, retailer, value added reseller, operator and consumer would be much more difficult. These intermediaries are "institutional" buyers who are risk averse and have low tolerance for untested ideas. Institutional buyers need to think about dealing with other people's money not just their own so they are doing the right thing from their point of view.

    Nokia needs to persuade first operators, then distributors and then consumers that its new products are great (even though maybe the old ones were not so great.) That's tough. Apple works in the other direction. It creates consumer demand then "sells" that demand to the intermediaries as needed.

    These intermediaries (which Steve Jobs famously called "orifices" to the market) amplify the success and failure of a company. For a long time after a product may lose favor with consumers, it will still be sold out of momentum of the channel. But it works the other way as well. If you're out of the channel, getting in is much harder even if the product may have favor with consumers. This is Microsoft's problem with Windows Phone. Surveys show that it's well liked by users, but because Microsoft relies on a long chain of intermediaries, it's still very hard to get started. Microsoft (and Nokia) rely on momentum to carry them once they get some traction and they plan to spend a lot of money ($ billions) to ensure they get some traction.

    -You are absolutely not optimistic at all about the Microsoft partnership (see “in memoriam” post). What could be the best solution? To enhance Symbian platform? Go for Android?  To create a new market with a new kind of device (cf book “How new ideas can win fast”)? Or to go back in the tire business ;-) ?

    I only observe and record data and then try to have a theory of why it happens that way. The empirical data shows that Microsoft has been very unsuccessful with mobile. Their partners seem to all have failed and the list is long. So the question is why. Is it just bad luck? Is there something wrong with management? Is it that perhaps there is a failure in strategy or business architecture?  All these are possible hypotheses but I believe the problem is that Microsoft has chosen not to integrate products and to rely on intermediaries at a time when that strategy leads to uncompetitive products. One can understand why they went with this strategy: They believe the scale of the market is so large that they cannot address it like they did with Xbox (building their own complete solution). However, that also means that they are likely to be uncompetitive during the time when integrated products/ecosystems are still not good enough and can iterate more quickly to capture the market. This was true for the iPod where Microsoft tried to license technology to device makers. It was true during the time of Windows Mobile when Microsoft's OS could not compete with either Blackberry or Symbian and it may still be true today with iPad which redefined what a computer could be.

    -What and when, precisely, Nokia did fail to understand how to be remain the market leader and innovator?

    I think the answer goes beyond the failures in execution or software development. Being late or sloppy with Symbian evolution is a symptom not a cause of the failure. What Nokia failed to understand is that software and data-oriented products would be built and sold and valued differently than voice-oriented products. Nokia listened very carefully to its best customers, the operators. Operators saw data as a sustaining improvement to their core business and steered Nokia into building "voice-plus" products. Every technology that came out of the laboratories was used to enhance the phone *as a terminal* in a network. Nokia never framed the product as a computer using the network as an accessory the way modern smartphones are valued (or if they did as with Maemo, it was a half-hearted effort). Users today are glued to apps and local media storage and see network access as a necessary inconvenience. The network is only valued in terms of being available.

    The re-framing of the device from being a terminal to being the center of user's focus is the "disruption" which is sweeping aside all the incumbents in the phone space. They all did what was expected of the best managers: they listened very closely to their best customers. That also leads to blindness when the industry itself is being ripped apart by disruptive forces.

    -In many aspects, Nokia developed many innovations (email on the phone, music store, smartphone with applications, tv on the phone,..). I remember visiting a Nokia exhibition four or five years ago, in Nice, with a broad and incredible new services range that I almost never see on the Belgian market. Many of the innovations were related (dependant) to a deal with telcos, as network device vendor. Blackberry (RIM) or Apple were more successful. Is it because they had nothing to sell as network device vendors ?

    This is answered by the previous answer as well. All of Nokia's services were designed to help operators improve their business. Operators were the best customers and they ensured Nokia would sell large volumes. But consumers did not see it that way. When a competitor came with an alternative, consumers defected en masse. By then it was too late to change the strategy. It takes years. Nokia still perseveres with this operator-first strategy. Elop continues to say they will do what operators need first. The first thing he did when on the job was visit every major operator. The decision on Windows Phone was based on whether operators saw it as a viable third alternative to the iOS/Android duopoly. Strategy is a matter of priorities not capabilities.

    -How is the Nokia strategic problem perceived in Finland ?

    The problem is very deeply felt in Finnish society. Nokia was a source of pride for the country and also a large employer both directly and indirectly. I think the impact is felt more psychologically than financially. There was a sense of betrayal when Symbian was publicly "terminated". Many people criticize present and past management, but I think that anger is misplaced. The failure of a company rarely comes from the failure of character or intelligence. It's usually a failure of being too rational, too reliant on best practices. What Finns need is a dose of independence in thought and a re-assertion of their willingness to take risks.

    The Finnish character is one of independence and perseverance in face of adversity. If Nokia loses its independence then it will need to deal with a lot more adversity. I believe however that innovation will continue. Case in point: Rovio, the maker of Angry Birds is a Finnish company.

  11. Peak RIM

    Research · 37 comments

    In their monthly survey update on US phone usage, comScore reported that by the end of April 74.6 million people in the U.S. owned smartphones. In the same period a year ago only 48.1 million did. The percent of smartphone users out of total phone users has reached 32%.

    The following data points can also be deduced:

    • 2.1 million or 474k people/week became smartphone users during April.
    • 62% of smartphones in use in the US are either Android or iOS. The sum a year ago was 37%.
    • There are about 20 million iPhone users and 27 million Android users in the US today. A year ago there were 12 and 6 million respectively.
    • RIM's US user base peaked at 22 million in Sept 2010. It is now 19 million and dropping.
    • Usage of Microsoft mobile operating systems in the US is in steady decline dropping from 7 to 5 million users in one year.
    • During April 475,000 people abandoned their Blackberries.
    • Android and iOS gained 3 million users in April. One million switched from other smartphones and 2 million switched from non-smartphones.

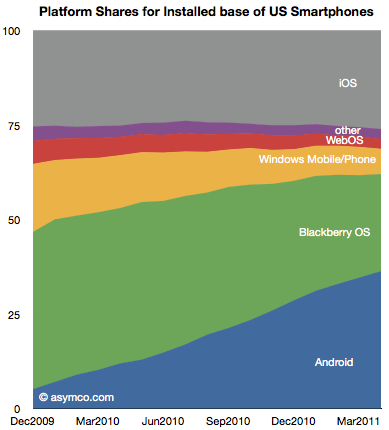
    The following chart shows the evolution of installed base share of platforms among users of smartphones in the US.

    The impressive share gains for Android are apparently at the expense of RIM and Microsoft. Over the period shown, Android gained 25 million users while RIM gained only about 2.8 million.

    Although perhaps comforting to see some growth overall, the situation for RIM is more grim than that. During the first half of the period (December 2009 to August 2010) RIM had gained 4.6 million users. During the second half (Sept 2010 to April 2011) RIM lost 1.8 million users.

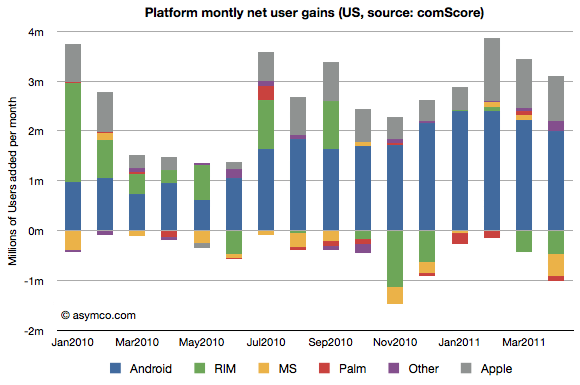
    The net user gains and losses for the various platforms is shown in the following chart:

    Note how RIM (green bars) went from being a consistent net usage gainer to a consistent net usage loser during this 16 month period. In addition, note how Microsoft's platforms (yellow bars) have had a very poor showing with very small gains during four months and moderate losses during the others. The losses in usage even increased after the release of Windows Phone late last year suggesting no traction whatsoever for Windows Phone.

    The other point to be made is that if we assume smartphone users remain smartphone users, then those platform losses are gains by other platforms. In other words, the areas less than zero in the chart above represent smartphone "churn" or switching between platforms (As a percent of all smartphone users that number represents 1.35%.) That number is far lower than the total smartphone gains, so it's safe to say that most of the iOS and Android gains were at the expense of feature phones rather than other smartphones. And since iOS share is consistent (and supplies are constrained), few if any Android gains are at the expense of iOS.

    There are many interesting patterns to observe in the data, but I think the most evocative is the erosion of Blackberry usage. If the Blackberry peaked, and a follower platform not yet in sight, the question is how long will RIM survive?