Asymco

Asymmetric Intelligence

Windows

  1. The world's biggest startup

    Research · 34 comments

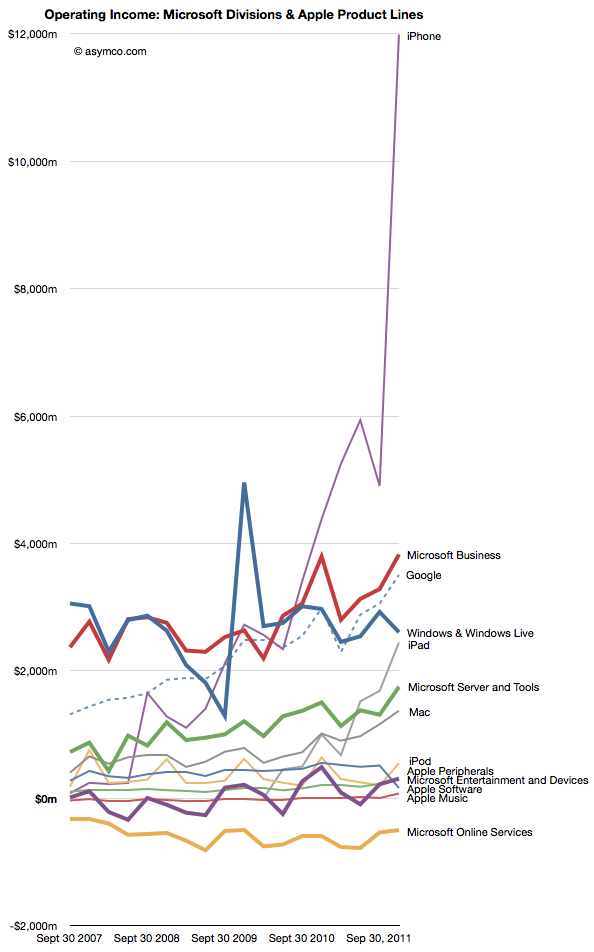
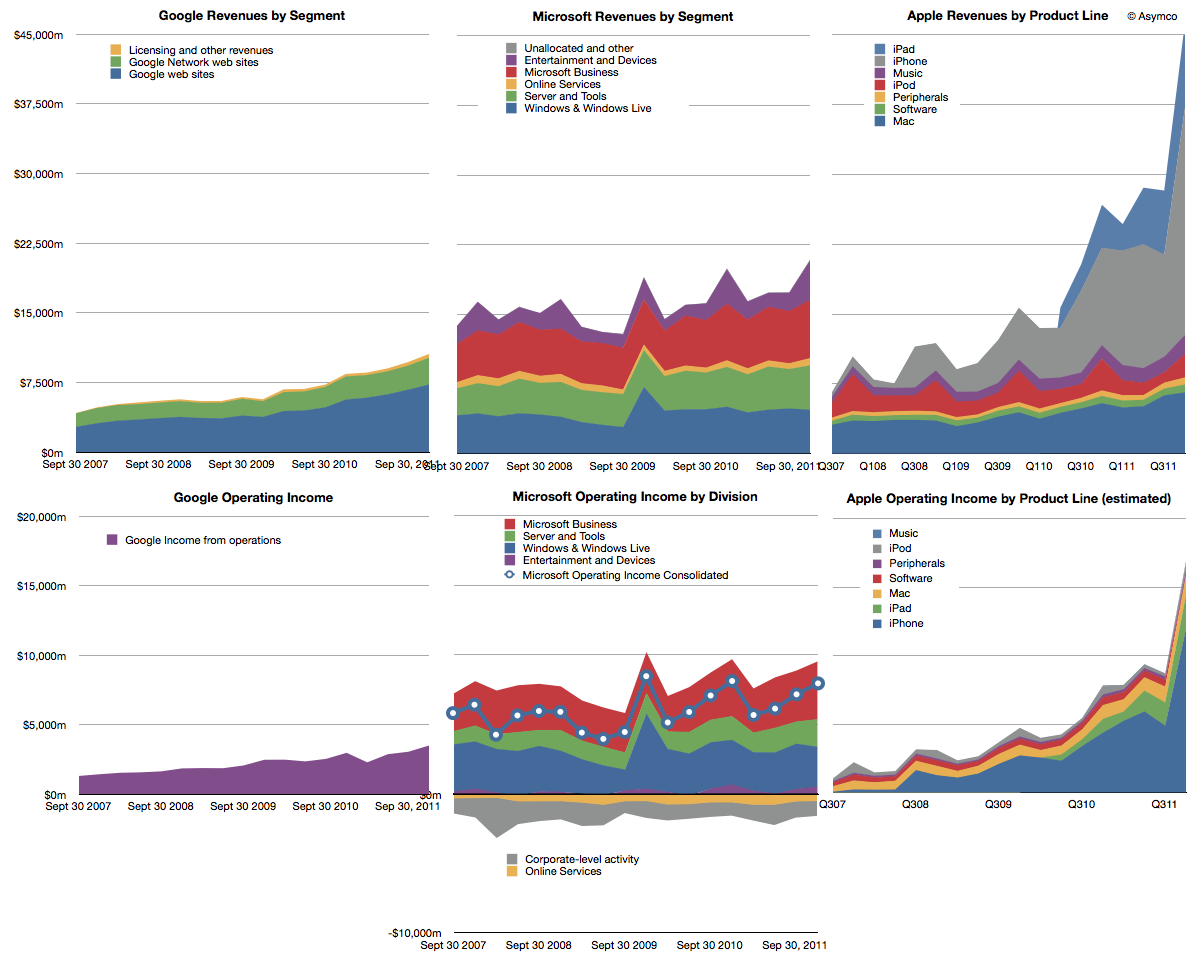
    Last year we began offering revenue and operating income comparisons between Apple and Microsoft. It was becoming evident that the iOS franchise was beginning to overtake both in revenue and profitability the Windows franchise. To offer more dimensions of comparison this time I am adding Google's top and bottom lines for comparison (click image for detail):

    Note that the graphs have the same scales when read horizontally. I've broken out the sub-divisions of revenues as the companies report them. Here are some observations:

    1. The time spanned is 4.5 years (September 2007 to December 2011)
    2. If we compare the fourth quarter 2007 to fourth quarter 2011 the ratio of Google : Microsoft : Apple went from 1: 3.39:2:16 to 1:1.97: 4.38. In other words, Microsoft was 3.4 times bigger than Google but today it's only about twice. Apple was twice and is now about 4.4 times bigger.
    3. In terms of operating income (i.e. before R&D, SG&A and OI&E) the ratios were 1:4.48:1.53 and are now 1:2.28:4.82. Microsoft's income gap to Google halved while Apple's more than tripled.
    4. Google and Microsoft have grown but not by adding new sources of revenue. Apple grew its base but, more importantly, added new businesses for spectacularly more growth.
    5. Compared to Microsoft and Apple, Google's revenue is distinctly single-source: advertising. Though divided between own sites and those of affiliates, advertising is today 96.1% of revenue and was 98.6% four years earlier.

    If we compare the individual product/business operating incomes individually we see some interesting patterns:

    1. Google's advertising profits have overtaken Windows as has the iPhone and the iPad may do so quite soon.
    2. Microsoft's Business (Office) and Server businesses are growing more quickly than Windows
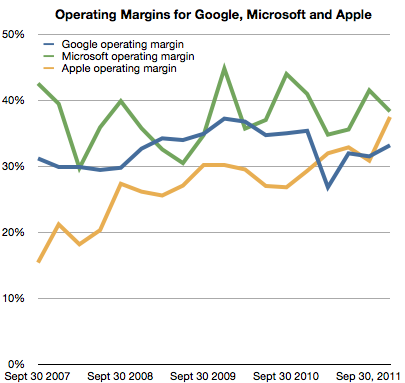
    3. The hardware oriented Apple' operating margin is now 37% and exceeds Google's 33% while being nearly equal to Microsoft's 38% (see chart below)

    I presented a subset of this material January 30th at a TechMeetups event titled "Apple - world's biggest startup." A presentation by Adam Lashinsky focused on the cultural and procedural aspects which highlight Apple's "startup" nature. My presentation showed, using these graphs, Apple's growth characterizes it as a "startup". The growth did not come from a broadening of its core products markets. It came from the creation of new product categories. Google, a much younger company does not exhibit this non-secular growth any more than Microsoft which is about as old as Apple is.

    The lesson is perhaps that rapid growth is not the right of small companies alone. Apple has used disruptive innovation to transform itself and offers a stunning contrast to two other companies which are also seen as innovative leaders.

  2. Is the iPad a PC?

    Research · 127 comments

    Gartner published its estimates for "PC" shipments during the fourth quarter. As I've done in the past, I combined their estimates with known shipments from Apple and separated Apple's performance from the Windows-based market.

    I also take into consideration the iPad as a potential competitor for computing purchases. Apple will report fourth quarter results including Mac and iPad shipments in less than two weeks but I am using my own estimates until then.

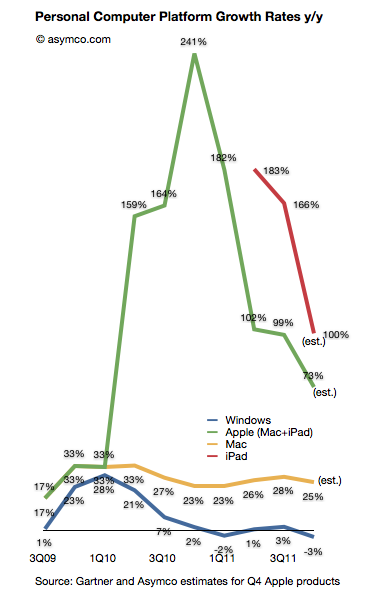
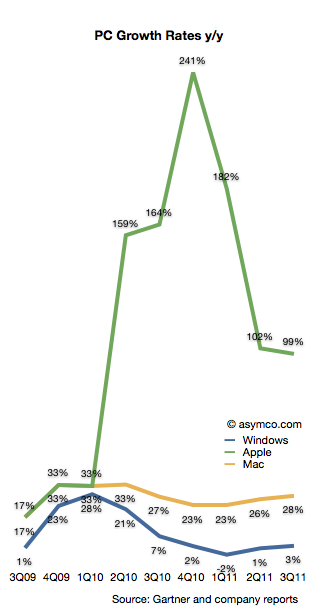
    Here is how the platforms grew over the last few quarters (all figures are global):

    The Gartner data implies a 3% decline in the size of the Windows PC market during the last quarter. This is the fourth quarter of disappointing Windows performance. If you observe the pattern for the Mac vis-a-vis  Windows there is a similarity in the overall cycle but a divergence in terms of growth. The "spread" between Windows and Mac OS X is increasing and has reached an all-time high of 28 points.

    But the more interesting story is that the decline in Windows seems to be coincident with the growth in the iPad. The green (Mac + iPad) shows the effect of the new category while the red line (iPad only) shows that growth in isolation (year-on-year).

    Coincidence?

    Ever since the iPad launched the hypothesis that it has an impact on PC has been hanging in the air. Most analysts (including Gartner) argued that there was no effect from iPad and that the problems with Windows were all due to one-time circumstances. We hear the same about the last quarter with floods in Thailand being blamed.

    However, in the latest quarter Gartner began suggesting that "consumers' attention was diverted toward other product categories, especially smartphones and media tablets."

    One wonders if these "media tablets" are not PCs and yet they negatively affect the purchase of PCs whether they are indeed competing with PCs.

  3. The other tablets

    Research · 89 comments

    Analysts have to count things in order to measure value. It sounds easy but it can be tricky. As I pointed out with PCs vs. iPads, if you count an iPad as a PC you can get into a lot of trouble with your clients. But if you don't you end up directing them away from confronting an existential threat. Only very rarely is a market report published in contradiction to widely held sustaining beliefs. More often than not analysts bow to the source of their paychecks and in so doing show their rear end to the truth.

    This comes up again now with respect to how to count tablets. Consider that there is little difference in architecture, software or design between an iPhone and an iPad. They run the same OS, use the same microprocessors and have similar communication methods, inputs and sensors. However they are considered completely different products and counted as part of separate markets. The only physical attribute that differs is the screen size. So we have to conclude that the size of the screen is a huge determinant factor in deciding whether a product is a tablet but not a smartphone (or music player).

    But what about tablets themselves? Their screen sizes vary widely. A 10" screen is certainly a tablet device, but a 4" screen certainly isn't. Where is the boundary exactly? It seems that a 7" device is still a tablet but a 5" may not be. The Dell Streak 5 device is presumably not a tablet. The arguments then descend into an arbitrary definition of tablet based on whether it fits in one hand or in a bag of a certain size.

    This begins to sound academic. Why should it matter what size is or isn't a valid tablet? Buyers are not in the market for screen sizes. They are in the market for products that can be hired to do jobs or address pain in their lives. So as far as consumers are concerned, these categories are meaningless. If you want to design something you'd better segment according to jobs to be done.

    However, buyers are not the target audience for the analyst. Nor are product designers (hopefully anyway.) Part of the reasoning of offering market research is that it presumably helps ecosystem participants (vendors, developers, retailers, etc.) decide where to invest their time and money. They are the target audience. They don't spend their lives reading tech blogs. For them it's important to understand "which way the wind is blowing" and that's where an analyst should be helpful with data.

    But then if we are to measure ecosystems, we have more difficulties.

    The iOS ecosystem is pretty well understood. Apple publishes the number of devices it sells and the number of apps on its store and downloads, etc. We can assume Microsoft will do the same with Windows 8 as they do already for Windows in general.

    For Android, it's a challenge. Google measures activations, but that may not cover the actual units sold. Google admits that it does not know how many Android devices are sold or even how many are for sale. It's in the nature of open source that it's not controlled and hence not measurable.

    But analysts still try. Consider the estimate that about 27% of all "tablets" shipped are Android. That's not something Google helped with. Google can report the number of activations of a certain version of the OS, but they themselves don't know what the device looks like or what size screen it has. A device vendor can put any version of Android on a device of any size. To find out how many tablets run Android, you need to try to estimate "bottom up" by adding the output from various vendors.

    However, it's clear that a large number of these devices are not exactly Android. Consider what  Kevin C. Tofel writes for GigaOm:

    I asked Strategy Analytics to clarify both of those points and received the following email response from Neil Mawston, the analyst who wrote the report: ”Yes, the press release refers to shipments, not sales. All sub-versions of Android are included. Yes, the B&N Nook Color tablet is included in the tablet figures.”

    So the B&N Nook is counted as an Android tablet and part of the 27% share of Android. But Google itself does not count the B&N Nook as an Android tablet. It's not something that can even use the Android brand. From Google's own documentation:

    We define an "Android compatible" device as one that can run any application written by third-party developers using the Android SDK and NDK. We use this as a filter to separate devices that can participate in the Android app ecosystem, and those that cannot. Devices that are properly compatible can seek approval to use the Android trademark. Devices that are not compatible are merely derived from the Android source code and may not use the Android trademark.

    In other words, compatibility is a prerequisite to participate in the Android apps ecosystem. Anyone is welcome to use the Android source code, but if the device isn't compatible, it's not considered part of the Android ecosystem.

    So to summarize, whereas the Nook is counted as an "Android tablet" it...

    • cannot be called an Android device without violating the trademark
    • may or may not compatible with Android Apps
    • does not include Google Services like Google Maps
    • cannot license the Android Market client software or brand
    • is not considered to be a part of the Android ecosystem by Google

    All this is also true for the Amazon Kindle Fire and whatever Baidu, Alibaba and other Google competitors will be selling. Furthermore, Google can define compatibility and therefore what "being Android" means arbitrarily and can change that definition at will. It can even withdraw compatibility on the basis of business priorities.

    It matters because these devices might end up very popular (see Amazon's reporting of Fire's pre-orders in its quarterly earnings call) and in aggregate could even be the majority of "Android tablets".

    The result is that most analysis of the Android ecosystem (and by comparison, all mobile ecosystems) depends on classifying as Android devices those that compete with Google, and indeed, with Android. For the purpose of assessing value, growth and opportunity for third parties such reports fall short.

    So what should be done?

    The solution is simple: Count as Android devices those that are allowed to be called Android as per Google's own definition. It makes clear that developers can reliably sell their software through the Android Market. It makes clear that those devices are designed to use Google services and it makes clear that those devices are not designed to compete with Google.

    Those devices which are using "derived" Android source code and are not compatible (as per Google's definition) and are not allowed to be called Android by their vendor should be called something else. Maybe "Android-like" or "Android derivative" or "Non-Google Android" or just "Other".

  4. A tale of two disruptions

    Research · 58 comments

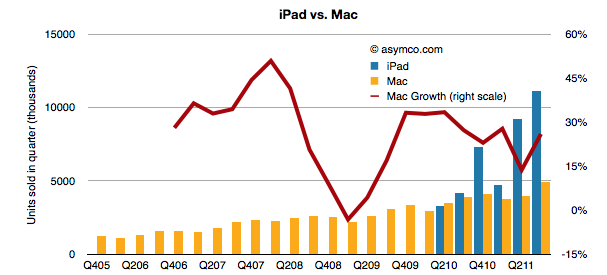
    Last quarter the iPad had unit growth of 166% with revenue growth of 146%. The iPad is selling more than twice the (also rapidly growing) Mac. The two product lines are shown below:

    A big reason the Mac is still growing is that it now consists of 74% portables and the MacBook Air and Pro products are still largely unmatched and have a near monopoly in their target price.

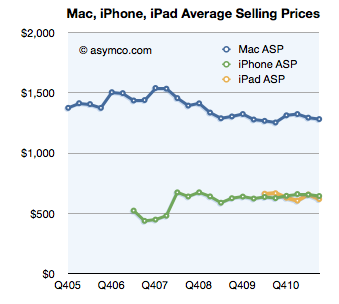
    The Mac's average selling price has remained remarkably steady for three years.

    But more importantly the iPad and the Mac both outgrew the PC market. Taken as OS X vs. Windows, the growth rates were 27.7% vs. 2.5%. If iOS is included along OS X, Apple grew its "computer" shipments at a rate of 99%.

    The following chart illustrates the growth rates for Windows, Mac and Apple as a combined OS X/iOS.

    The Windows platform still ran on 82% of PCs sold in the quarter with iOS taking second with 10.5%, OS X third with 4.7% and Android at about 3%.

    Even though Mac OS X grew faster than the overall PC market for 20+ quarters, its market share is still below 5%--lower than what the iPhone has been able to obtain in the far larger mobile phone market.

    That share has grown from 3.2% in the same quarter of 2008 but it's still a very slowly changing landscape.

    However, if we include the iPad, Apple begins to not only grow very rapidly, it moves up sharply in terms of ranking among PC vendors.

    Last quarter's 16 million OS X and iOS tablets brought it into second place behind the 16.6 million PCs that HP sold. That was enough to give Apple 15% share vs. 15.7% for HP. Over the last three years Apple has gained nearly 12 points of percentage of share.

    The other vendors mostly lost share but the most affected were the smaller OEMs. HP lost 2.6 points, Acer 3.9 and Dell 3.4. However "Other" lost 10.5 points. Lenovo is the only major vendor to gain share (+4.48 points).

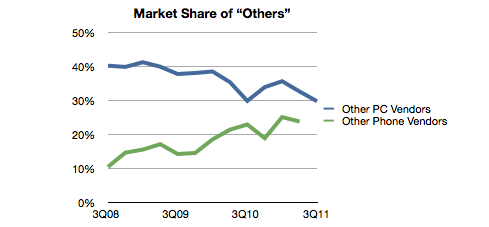
    What's interesting about this pattern is that whereas in the phone business "others" is a rapidly growing group of companies, in PCs the smaller vendors seem to be suffering. They still make up about 30% of the market but that's down from about 40% three years ago.

    In contrast, "Other" went from 15% to 24% of the phone market in the same time frame. Part of the explanation is that the entry of the iPad took the wind out of the "low end" netbooks and other cheap PCs. Consumers migrated low-end usage to a product re-built around those jobs.

    In the mobile phone market, the disruption is in the opposite direction: communication is moving rapidly up-market from real-time voice to latent messaging and from storage consumption to broadband consumption. The companies being rewarded today in the phone business are those who are leading the charge to new markets.

    In other words, on the PC, we are witnessing low-end disruption. On the mobile phone we are witnessing new market disruption. The irony is that the low end PC and the high-end mobile are very nearly the same thing but the industries, channels and incumbent business models are very different.

  5. Comparing top lines: Apple vs. Microsoft

    Research · 97 comments

    I've been providing analysis of Apple's operating and financial performance for some time. Recently we've begun to look at comparisons of financial performance for comparable companies. Now it's time to dig deeper and do comparisons of operating performance as well.

    To start, Microsoft.

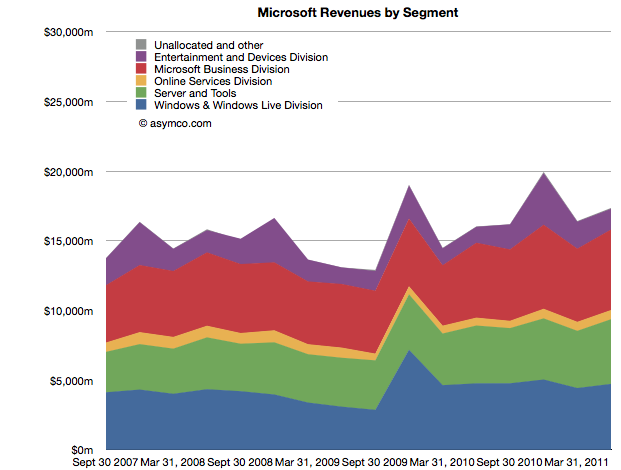
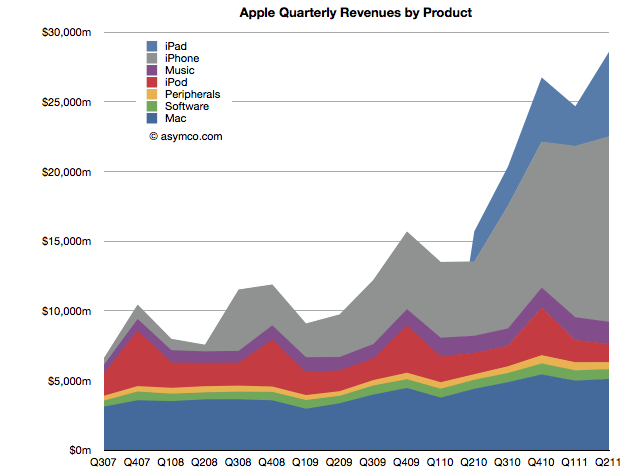
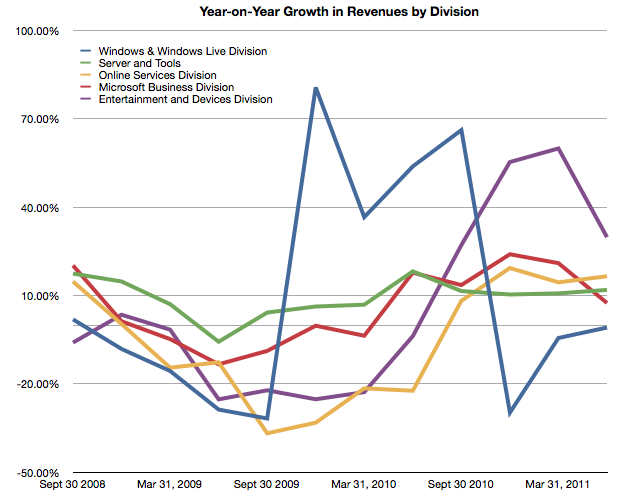
    Whereas Apple has product lines (iPhone, iPad, iPod, Mac, iTunes, Peripherals and Software), Microsoft has business divisions (Windows & Windows Live, Server and Tools, Online Services, Business (Office), Entertainment and Devices). The charts show revenues for both Apple and Microsoft according to these defined segments.


    The second chart should be a familiar one:

    Note that the horizontal and vertical axes are the same. The period of coverage is from mid-2007 to the end of June 2011 which corresponds to the life of the iPhone. The vertical axis ranges up to $30 billion/quarter in both charts.

    When shown this way, the exceptional growth for Apple becomes easier to understand (and perhaps Apple's valuation premium of 15.7 P/E vs. Microsoft's 9.5). Microsoft has been growing these past four years but not nearly at the rate of Apple. Microsoft grew quarterly revenues from the ~$15b range to ~$17b range.

    Additional points of interest:

    • The Mac business generates more Revenue than Windows
    • iOS powered devices generate more revenue than all of Microsoft's products put together
    • Apple's revenues grew 413% since Q2 2007 while Microsoft's grew 26%
    • The release of Windows 7 had a marked effect on revenues in the launch quarter but the sales did not seem to grow above the previous version's run rate ($4.2b/quarter vs. $4.7b/q on average).

    But most importantly, whereas Apple's growth has come from new businesses (iPhone and iPad), Microsoft has organically grown existing businesses. The condemnation of leadership at Microsoft should hinge on the absence of significant top line growth. Note that neither the Online Services nor the Entertainment and Devices divisions had appreciable net growth.


  6. OS turning circles: Questioning Windows' maneuverability

    Podcast · 137 comments

    [Updated with Mac OS versions. See footnote 3.]

    I'm glad Windows 8 is named the way it is. With Windows 7 Microsoft went to a numbering system which is much more rational than the mixed naming of the past. The number 8 actually corresponds to the actual sequential number of major versions of Windows released to date.

    Windows proper actually did not start with what was called "Windows 1.0". Windows actually started in April 1992 when Windows 3.1 was released. It was the first Windows which was an operating environment onto itself, apart from DOS. It was followed by Windows 95 (which we can call "2"), Windows 98 ("3"), Windows 2000 ("4"), Windows XP ("5"), Windows Vista ("6"), Windows 7 and now Windows 8.

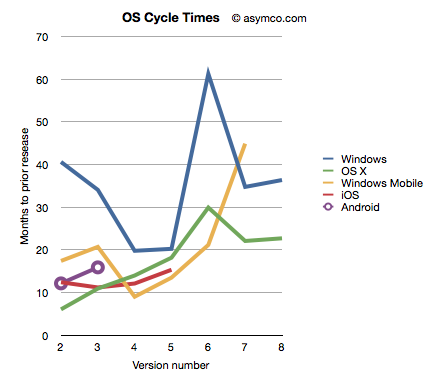
    Given this nomenclature and the dates of general availability of said versions, we can derive a measure of the frequency of upgrades. For example Windows "2" followed about 41 months after "1" and "3" took 34 months after "2". If we continue this for all the versions, and assume "8" will launch by October next year, we can plot the cycle times of new Windows versions.

    To make the story more interesting I added the same data for other OS platforms. OS X, iOS and Android have version numbers which correspond to the sequential order in which they were released. I am assuming that the numbering system (1.0, 2.0, 3.0 etc.) are meaningful and that major releases are given a new integer value.[1]

    I also added Windows Mobile which suffered from the same confused numbering that Windows suffered until the current Windows Phone 7. To create a map to integer values I used the following: Pocket PC 2000 is "1", Pocket PC 2002 is "2", WinMo 2003 is "3", WinMo 2003 SE is "4", WinMo 5 is "5", WinMo 6 is "6" and Windows Phone 7 is "7". There is no clarity when and what Windows Phone 8 will be so that is left off the chart.

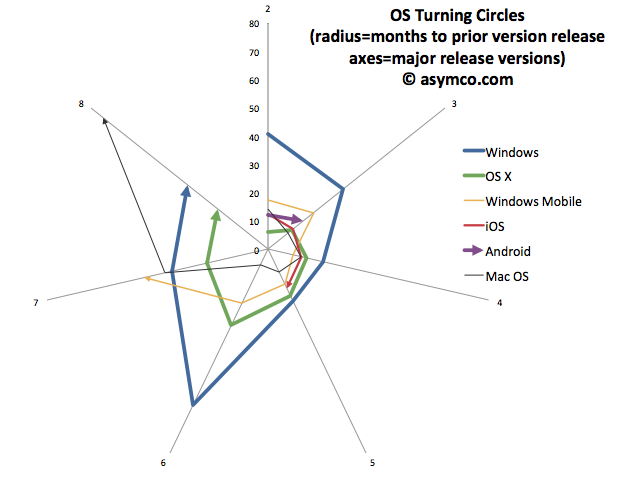
    The chart above does give a clue that Windows is a bit slower (more months between releases) than alternatives. However, the point I want to convey is that this cycle time can be a strategic advantage. A faster upgrade cycle means more rapid adoption of improvements, not to mention more revenues. Rather than a line chart, the better way to visualize it is as a turning circle.

    The analogy is from aerial combat where a plane that can "turn inside" an opponent can get into a firing position. The tightness of turning circles also means that a competitor can iterate more quickly and thus move up the trajectory of improvements necessary to remain competitive more rapidly. To that end, I re-plotted the data above with radial axes.

    The chart clearly shows how among desktops, OS X has been tighter than Windows[3]. Furthermore, mobile OS's have been, typically, more agile than desktop OS's. The exception being Windows Mobile which had significant architectural and business model challenges. It will be interesting to watch the radius of Android. So far it seems to be tight, but as tablet functionality has been added, the speed of change has slowed slightly.

    However, the big contrast is between mobile and desktop. Microsoft tries with Windows 8 to merge the two. But these are different ecosystems. Buyers, OEMs, users, all have different behavioral patterns (jobs-to-be-done) for mobile OS vs. desktop/portables. Will the cycle time for Windows 9 and Windows 10 tighten up? Can Microsoft operate its OS division at this new cycle time?

    What is even more bad news is that the most important customers for Microsoft, enterprises, actually upgrade every other version. The Windows "radius" is nominally averaging about 35 months but large account adoption is closer to 60 months.

    The contrast is then striking: Consumerized devices with over-the-air updates on a 12 month cycle are five times more agile than a traditional corporate Windows desktop. Another way to look at this is that for every change in a corporate desktop environment, the average user will change their device experience five times. Although Microsoft might find comfort in Enterprises' leisurely pace of change[2], those are the wrong customers to keep happy going forward.

    The implications are left as an exercise to the reader, but I would argue that along with the asymmetry in business model around pricing that I highlighted in the last Critical Path podcast, Microsoft has a significant operational asymmetry with devices as a new class of computers.

    ---

    Notes:

    1. The dates of general availability of various versions of operating systems.


      Version
      Windows
      OS X
      Windows Mobile
      iOS
      Android
      1
      4/6/92
      3/24/01
      4/19/00
      6/29/07
      10/21/08
      2
      8/24/95
      9/25/01
      10/1/01
      7/11/08
      10/26/09
      3
      6/25/98
      8/24/02
      6/23/03
      6/17/09
      2/22/11
      4
      2/17/00
      10/24/03
      3/24/04
      6/21/10
      5
      10/25/01
      4/29/05
      5/9/05
      10/1/11
      6
      11/30/06
      10/26/07
      2/12/07
      7
      10/22/09
      8/28/09
      11/8/10
      8
      11/1/12
      7/20/11
       
    2. While at Nokia's Enterprise Solutions I was witness to this difference between the cycle time of devices and the pace of adoption of Enterprises. The fundamental disconnect was that the sales cycle for a "solution" was longer than the shelf life of a device upon which that solution was predicated. Needless to say, Nokia Enterprise Solutions did not last long. Nor do we see today any significant Enterprise-focused mobile device businesses (RIM itself moved to consumerize its products years ago.)
    3. I added Mac OS data to the second chart to also illustrate that no company is immune from spinning out of control. Mac OS clearly went spun out after version 6 with increasing delays leading to its demise and replacement. You can also note that its replacement (OS X) was able to straighten-up and fly right. The lesson may be perhaps that ditching and starting over is a viable option.
  7. How we do all this will never be the same

    Research · 36 comments

    In a new ad for the iPad Apple once again makes the case that the tablet is a good substitute for a PC in a number of use cases (and permits some new ones.)

    We'll never stop sharing our memories. Or getting lost in a good book. We'll always cook dinner and cheer for our favorite team. We'll still go to meetings, make home movies, and learn new things. But how we do all this will never be the same.

    This belief that the iPad "cannibalizes" the PC is a powerful concept. The growth of the PC has certainly been affected. But has the Mac's growth also been affected?

    Tim Cook seems to think so. In the earnings call he said:

    In terms of cannibalization, we do believe that some customers chose to purchase an iPad instead of the new Mac during the quarter, but we also believe that even more customers chose to purchase an iPad over Windows PC. And as I've said before, there's a lot more of the Windows PC business to cannibalize than the Mac.

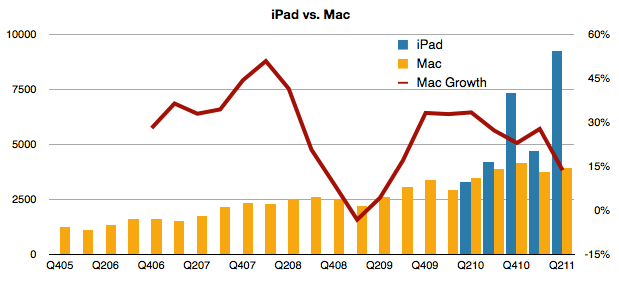
    If we look at the behavior of Mac vs. iPad, the following chart may be useful:

    First off, we can observe that since introduction, iPad has always sold more units than the Mac. Now it's selling more than twice as many units and the revenue from those units is higher than those of the Mac. The other line to look at is the growth (y/y). During the time that the iPad has been shipping, the Mac growth has been declining.

    Yes, it's still growing at five times the rate of the PC market (and 7.5 times the rate of Windows only PCs), but the iPad phenomenon is indeed affecting the Mac.

    With the launch of Lion, Apple is clearly showing that there is dramatic improvement potential in traditional personal computing. But increasingly the improvements are "borrowed" from touch interfaces. Clearly, as the ad implies, computing will never be the same again.

  8. The Frontiers of Platform Adoption

    Research · 46 comments

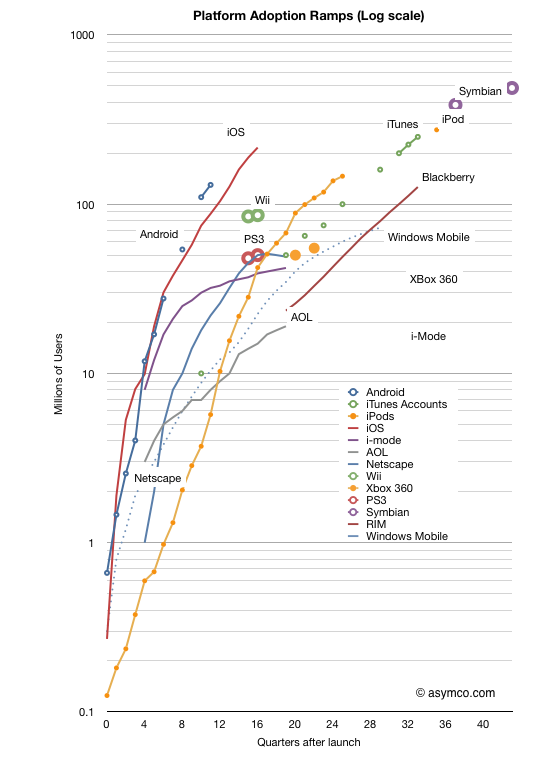
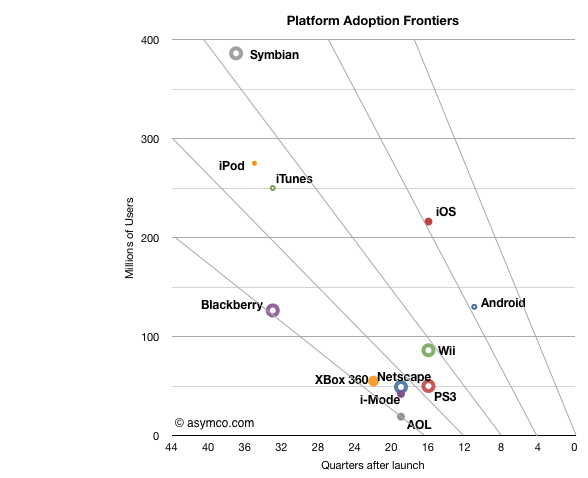
    In the last two weeks we received two more data points which allow an update to the "race to a billion" platform growth trajectories. Android reached 130 million active users and iOS reached 200 million.

    The updated picture looks like this:

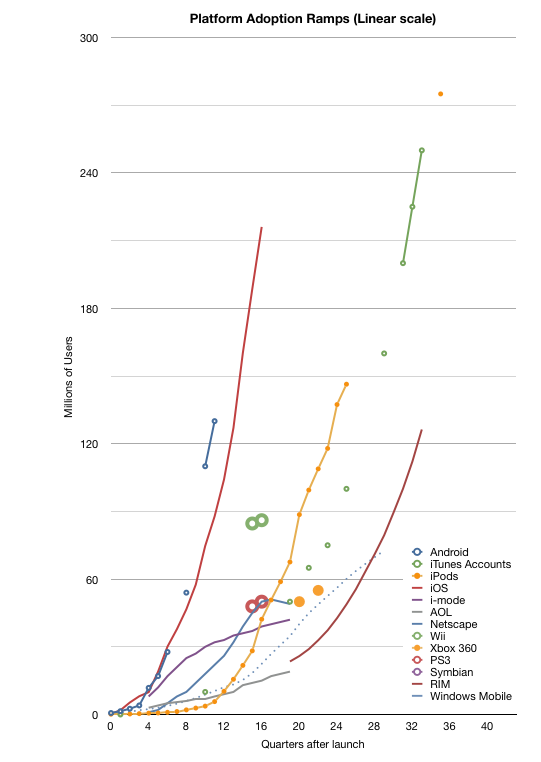
    Note again that this is a log scale graph. Every major horizontal gridline is an order of magnitude (10x) larger than the one below. It's a busy graph. The linear version follows:

    For the detail-minded, it makes for some interesting comparisons, but I want to create a more compelling visualization. One where each platform can be judged for potential and impact at a glance.

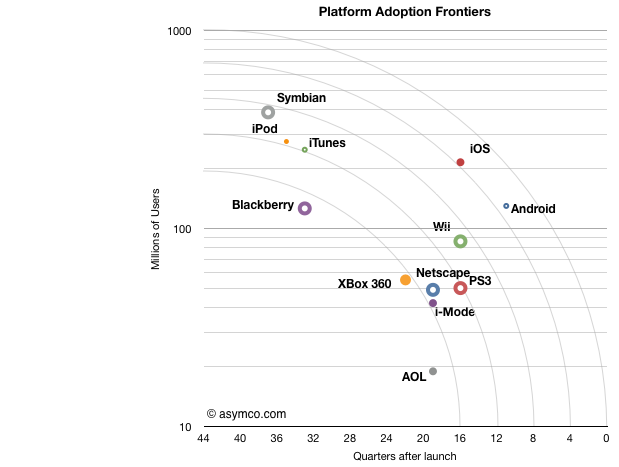
    To that end I came up with something I call the platform "adoption frontier" view. Based loosely on the Pareto efficiency concept the chart is reduced to show the latest known figure of (users,time) and overlay concentric arcs centered on 10 million/10 years and radii of unit years (x-axis).

    Note that the time axis is reversed from the chart above. This was to allow the best performers to be shown at the upper-right of the chart.

    The way to read this is as follows:

    • Each platform is represented by a point which shows its currently known peak in users and time to reach that number of users.[1]
    • The arcs (frontiers) represent possible performance classes.
    • The lowest frontier spans "four years to reach 10 million" to "10 years to reach 200 million". The highest frontier spans "<1 year to reach 10 million users" to "10 years to reach 1 billion users". Each frontier can be read in a similar way.
    • The main assumption is that a platform can reach more users but it takes time. Better performance is when a platform moves toward a frontier further from the origin.[2]
    • I chose the limits of the chart specifically: 10 years is roughly the limit of most platforms[3] in the current cycle time of technology disruption; One billion users is an upper bound set by Windows.

    One thing you can read from the chart is to say that "from a growth point of view, Blackberry is weaker than any of the other platforms." Sitting below the lowest frontier with fewer users than Android which has been in the market for less than a third of the time it seems to be less impressive. It is, however, in a similar band of growth as Xbox 360, which, by some measures, is a success story. So the performance standard is relative.

    One can also see the rough equivalence in growth between iPod and Symbian, both having crossed the second frontier. But iOS and Android are in a different league. They sit alone beyond the fourth frontier. The fifth frontier is the "billion user in a decade" potential and it seems within reach for both.

    What this view also offers is an answer to the question of competitiveness. Although platforms can co-exist and don't necessarily overlap, the question of becoming overwhelmed with "good enough" by widespread low end alternatives looms for the specialized platforms. For example, game consoles look very vulnerable because they simply do not have the potential to cross high frontiers and orders of magnitude of casual gamers (with potential TV connected devices) might orphan the consoles.

    I've also included some platforms that have peaked and faded (AOL and i-Mode and Netscape) as a warning. The frontiers illustrate of how hard it is to reach the upper limits of growth. Each level is exponentially more difficult than the last and achieving it with paying customers is a remarkable story of value creation.

    [UPDATE]

    I add below the frontier chart with a linear vertical axis. Note that the frontier lines are not equivalent to the frontier arcs in terms of coverage.

    ---

    Note:

    1. The data I have is for platforms where users have to pay something to participate. I exclude platforms where users are the only merchandise being sold (i.e. social networks or email provision).
    2. I only include the initial ramps not upgrades. Windows is anomalous because it is so old. During its first decade (1985 to 1995) it reached over 17 million users but placing it on this chart does not do it justice given the growth occurred in its second decade.
    3. See Symbian and Windows Mobile. However again, Windows which is nearly 30 years old, is an exception.


  9. Is the tablet computer a new PC or post-PC?

    Research · 60 comments

    Steve Ballmer stated and Andy Lees confirmed that Microsoft views iPad and other tablets as "just PCs". From a market measurement point of view Canalys agrees. IDC and Gartner don't, calling the new devices "media tablets."

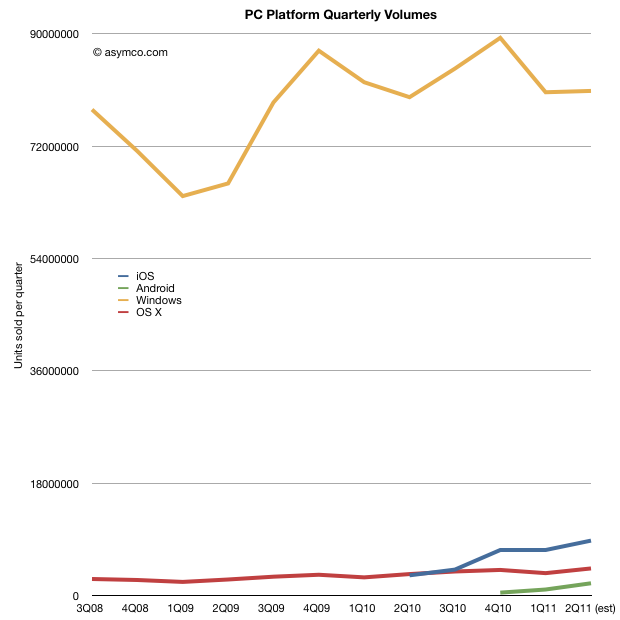
    Before deciding whether tablets belong with PCs in market metrics, it would be interesting to look at what the data shows. When seen as a combined market, the focus should be on platforms. The following chart shows the four main PC+tablet platform volumes since late 2008 [1].

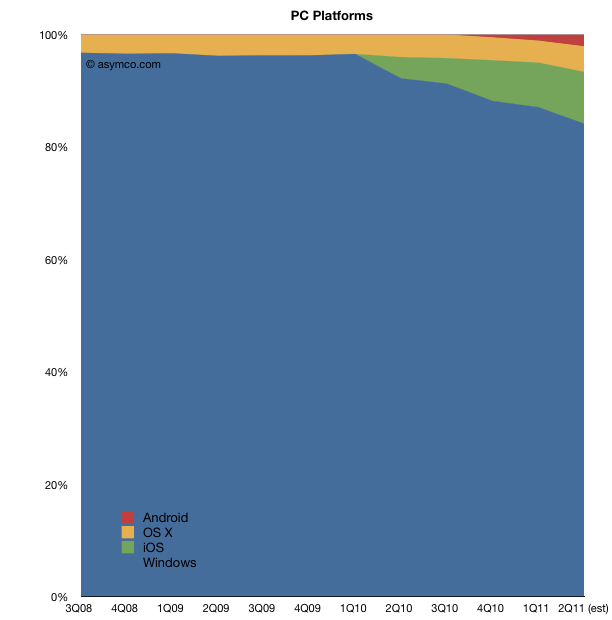
    The second chart shows the same data as share of total market:

    This comparison allows for some fresh observations:

    1. Excluding iPads, Apple is very close to being 5th largest global PC vendor. Global share likely to be above 5%. Including iPads, Apple would be 2nd.
    2. Platform year-on-year growth was Windows: +1.3%, OS X: +26%, iOS: +170%. Android growth cannot yet be measured since Android tablets have not been on the market for more than 1 year.
    3. In Q2 2011 one million more Windows PCs were sold than in Q2 2010. In same time, 903k more OS X PCs and 5.5 million more iPads.
    4. Excluding tablets, nearly 50% of the global PC growth was due to the Mac. Including iPad, Apple was responsible for ~70% of the growth in the PC market in Q2.

    The picture that emerges is that while Windows continues to be dominant with 84% of units sold in the last quarter, the growth belongs to tablets which captured about 90% of it. If Windows remains marginal on tablets, the "PC market" will likely tip away from Microsoft in two years (depending on how quickly Apple can build iPads.)

    Microsoft is making the commitment to move Windows to a tablet form factor but they are doing it while retaining the user interaction model of a desktop. This may or may not work but they are also conceding that a separate experience is also necessary. By rejecting the notion that a mobile OS alone can do the job, they are essentially building a "hybrid" tablet/laptop/desktop product which may be challenging to use but preserve their presence in the form factor.

    Whether Microsoft succeeds or not will depend on whether the new form factor is disruptive in more than user experience. In other words whether this is just a "new PC" or a "post-PC". The argument comes down to business model changes. For example the new model comes with different cycle time of product development (deep, integrated, yearly changes), different ecosystem (apps), different cost structures (high R&D in hardware), vast scale (device economics, components, ramps), and potentially new distribution (operators in the channel mix.)

    Summed up, the real challenge for Microsoft is whether they can keep their business model (selling OS licenses to hardware vendors) as PCs become more device-like. Not only is iOS setting the benchmark for performance but Android is potentially ready to take share if the market turns slightly more modular. Microsoft's differentiation looks to be primarily its legacy of PC software.

    It may also seem that much remains to be discovered in this market but I think the main bets have already been made. The PC market as we know it is in the end game.

    ---

    Notes:

    1. I used Gartner data for overall world-wide PC market and merged it with Mac and iPad data from Apple. Android data is estimated.
  10. The Post-PC era will be a multi-platform era

    Research · 104 comments

    Windows Phone Marketplace has reached 25,000 apps. That's an impressive figure given that so few devices have actually been sold. Compared with Android which is activating half a million devices per day, Windows Phone seems like a rounding error. According to Gartner, 3.6 million smartphones using a Microsoft mobile OS were sold in the first quarter of 2011, of which 1.6 million were Windows Phone 7. That implies a daily activation rate of 17,500 per day or one WP device for every 28 Android devices.

    And yet the number of apps on Windows Phone is more than 10% of the number of Android apps and Android Apps are about half of iPhone apps. As far as Windows Phone is concerned, apps are being added faster than users. Why is this?

    If we take the point of view that mobile platforms behave like the computing platforms of years gone by (i.e. Windows vs. Mac) then this is inexplicable. Developers should not be bothering with a distant third. This would be like betting on the Amiga in the era of Windows.

    But we're not in the PC era any more. That era had very high software development costs. It had very difficult software distribution channels (retail box sales typically) and very few categories of software with high price points. It was also dominated by institutional buyers which did not give quarter to small vendors. It was also a time when there were orders of magnitude fewer users and even fewer buyers.

    The post-PC era is characterized by an explosion of ideas and application of new talent to software. It's an era of immediate gratification and painless, one click distribution. App production is a cottage industry not something entrusted to only a few experts or those who can raise venture capital. It allows the small to distribute widely and get a shot at stardom. It has been (thankfully) avoided by enterprise buyers. The result is an explosion of apps: well over half a million new apps have been built in three years on three platforms that did not exist three years ago.

    So the very reasons which are driving developers to spread their bets across all and any new platforms should indicate the potential for new platforms and the sustainability of small platforms. The thesis that one dominant platform wins the mobile "war" is naive. The post-PC era will be a multi-platform era. Developers already understand this. Platform vendors know this. It's time to unlearn the lessons of the PC era.

  11. Windows generates less than a third the profit of iOS + OS X

    Research · 35 comments

    While a lot of the credit for Apple's success is rightfully assigned to the iOS franchises, the OS X business has more than quadrupled in five years. This has happened without drastic price fluctuations. Neither holds for the overall PC industry which has seen both volume and sales decline while prices have eroded along with profitability. On top of that, growth has nearly evaporated.

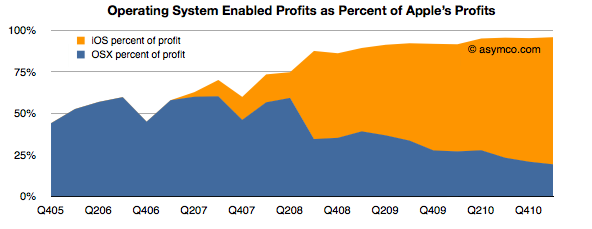
    Even with this success, as a percent of total value created, the Mac accounts for a mere 13% of Apple's profit. Including software as part of the OS X franchise implies that OS X is enabling about 20% of Apple's profits.

    iOS, on the other hand, is accounting for more than 75%. These two platforms combined amount to 96% of Apple's profits (up from 50% four years ago).

    That's $9.8 billion from integrated platform-based devices. One can be very confident that this profit would be negligible without the software differentiation only Apple can offer.

    So $10 billion is a lot of profit to obtain from a business enabled by operating system platform software. How can we get a handle on this size? How big is this? We could compare this with another operating system business: Microsoft Windows.

    Microsoft's Windows and Windows Live Division obtained sales of $4.445 billion in the last quarter with an operating income of $2.764 billion.

    So although Windows earned about twice what the Mac earned[1], iOS and OS X together enable 3.5 times the profits of Windows.

    The end of an era is the end of growth in one dominant business model. The PC era was epitomized by the concentration of profits in a dominant operating system vendor. That growth has slowed if not ended. The post-PC era is being kicked off by a new business model where profits are being concentrated in a hardware+software+service integrator.

    --

    1. Or you could read this as: The Mac generates half the profits of Windows while iOS devices generate 2.3x Windows profits.