Asymco

Asymmetric Intelligence

Horace Dediu

  1. "Other" vendors sell 10% of Smartphones but 30% of voice-oriented phones

    Research · 12 comments

    In the last post, I highlighted the difference between smartphones and non-smart device sales last quarter. The trajectory of share growth for smart devices would appear to have accelerated due to Android.

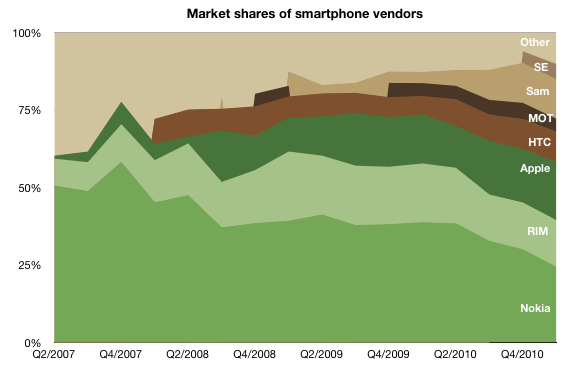
    The following charts show the evolution of smartphone vendors and platforms over the last few years.
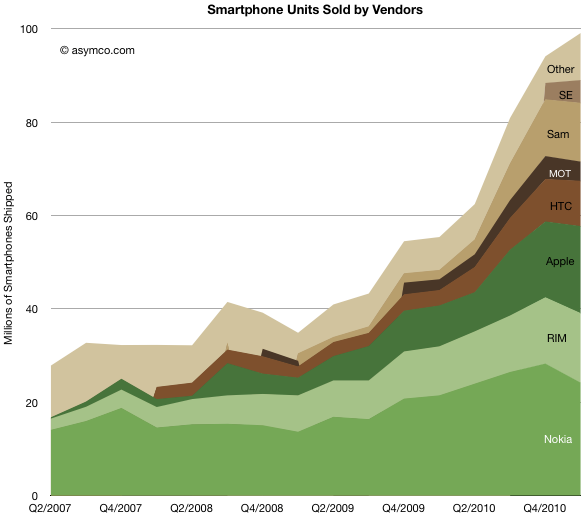
    Like in the past, I used color clustering to show the separation between "integrated" (in green) and "modular" (in brown) platforms and their users.

    Unlike the non-smart market where "other" make up 30% of the market, smartphones are still a big brand business. "Other" make up only 11% of units. and that number has been trending down. It would seem that the age of unbranded Android phones is still not upon us.

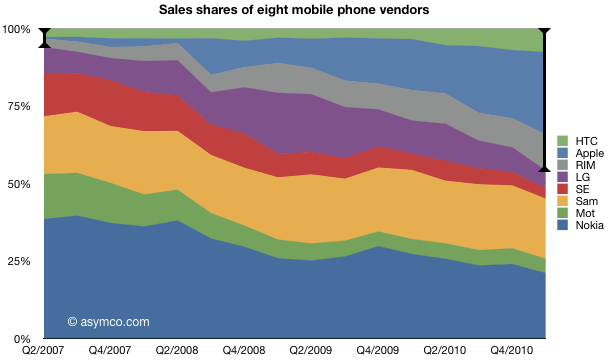
    Comparing three years "before and after" here is Q1 2008 vs. Q1 2011 by vendors share:
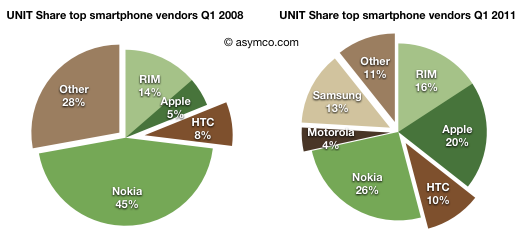
     

    Apple added 15% of share, Samsung 13%, Motorola 4%, RIM and HTC 2%. Nokia lost nearly 20% of share.

    From a platform point of view, the unit chart looks like this:
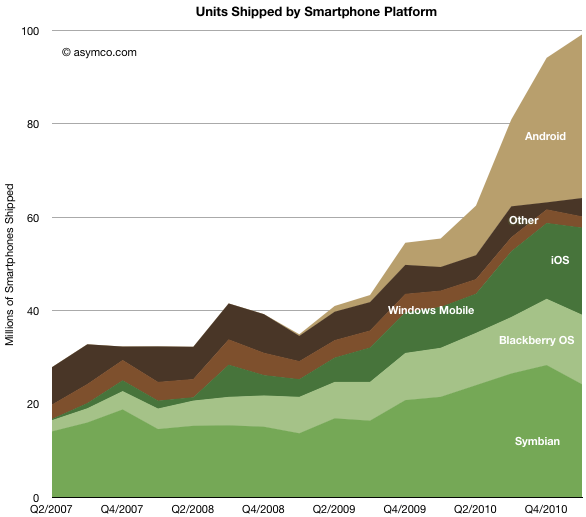
    Note that Android's growth came at a time when Symbian had a terrible quarter. The evidence is visible in the share chart:
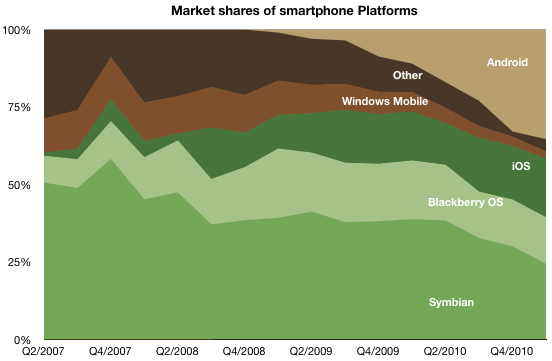
    Android's gain seems to be at the expense of Other, Windows Mobile and Symbian. In the pie chart snapshot over a three year period the transfer seems clear.
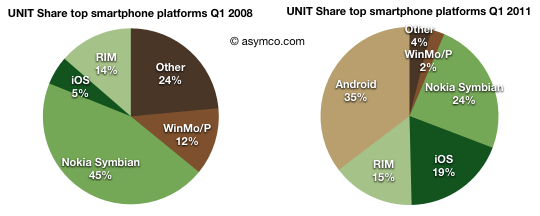
    Android took 35% of share, iOS 14% and RIM 1%. Windows Mobile/Phone has collapsed to 2%.

    But again I would caution about drawing "sustainability" conclusions from looking at this market with a share perspective. As it's growing at a huge rate (73% year/year) it's bound to be become so large that single digit share numbers still amount to vast ecosystems while huge shares of fragmented products don't amount to much of value. To emphasize the point, I would remind that in 2008 Symbian was not just Nokia but a lot of "Other" was made up of Symbian in Japan. The combined fragmented footprint of Symbian was well over 60% of the market. It did not do much good for the platform.
  2. Smartphones: the end of the beginning or the beginning of the end?

    Research · 43 comments

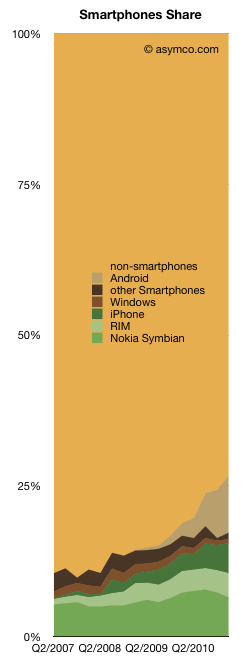
    The smartphone market grew to about 100 million phones last quarter. The volumes grew sequentially and as a result reached a new record share of 27% of total phones shipped. The chart on the left shows how this market evolved over the last few years.

    I've added each platform's contribution.

    While much of the focus will be on who had what share, the better question might be who has the better chance to beat smartphone non-consumption? Non-smart devices are still the dominant competitors. Though it's getting easier to win against them, they still have some compelling competitive advantages.

    What the chart shows is that Android (and phone versions of iOS) have taken share from direct competitors but have taken more from non-consumption. Rather than focusing on rivalry between platforms, minds should be focused on the shape of the smartphone adoption curve.

    The market is largely un-penetrated and yet some argue that "it's too late" to enter or that "the game is over" and winners have already been decided. This is an argument that we are at the beginning of the end. Once the market is predictable it's discountable. Once it's discountable it becomes economically uninteresting.

    I've argued that this is far from certain. In a short span of a few years, a decades old business has been re-defined. But that was just the device side of a larger business. Smartphones have been, so far, sustaining to the telcos who capture the vast majority of revenues and are thus the true incumbents.

    If and how they will be affected by further evolution of smart devices and new business models around them remains to be determined.

  3. The Rawr Chart

    Research · 30 comments

    The challenge with any performance metrics is that there is no single measure of business performance which is conclusive. The last few posts have covered mobile phone vendor performance measured by various methods. Growth (sequential, yearly and compounded multi-year),  margins, shares (units, profit and sales), rankings and time series. I've distinguished between smartphone pure plays and the diversified. Each is trying to shed light on what is a multi-dimensional puzzle.

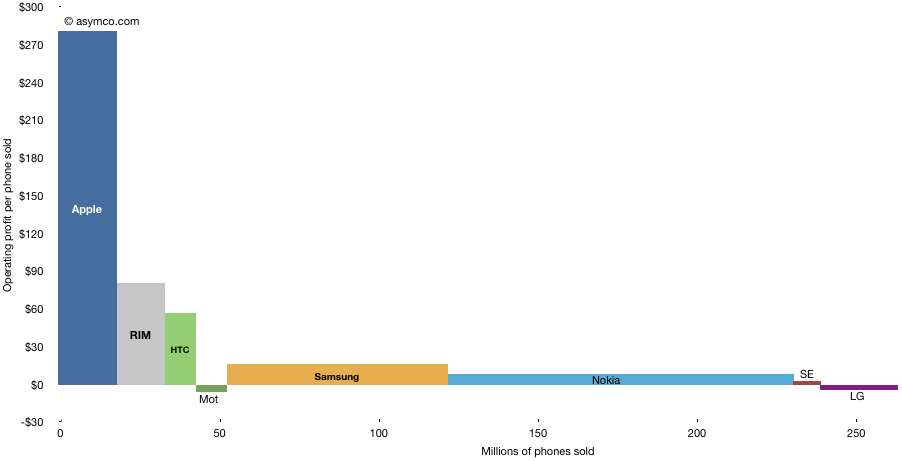
    I've used various charting tools and visualizations and they each render some clues, but the following chart is one of my favorites. It shows the way operating profit was distributed among the top vendors.

    The areas each represent the profit from mobile phone sales in Q1. The horizontal axis shows the volume of units and the vertical the profit per unit. It thus shows how "efficiently" profits were captured a unit basis. It also shows at a glance the different strategies employed and how they reflect performance. It shows who made money and who didn't. It shows the magnitude of differences.

    The shape of this chart has not changed in the last few quarters but it prompts speculation on how it might change in the following few years.

    I struggled to find a catchy name for this type of chart but @JustinD put it well here. Rawr indeed.

  4. Apple, RIM and HTC captured 75% of mobile phone operating profits in Q1

    Research · 32 comments

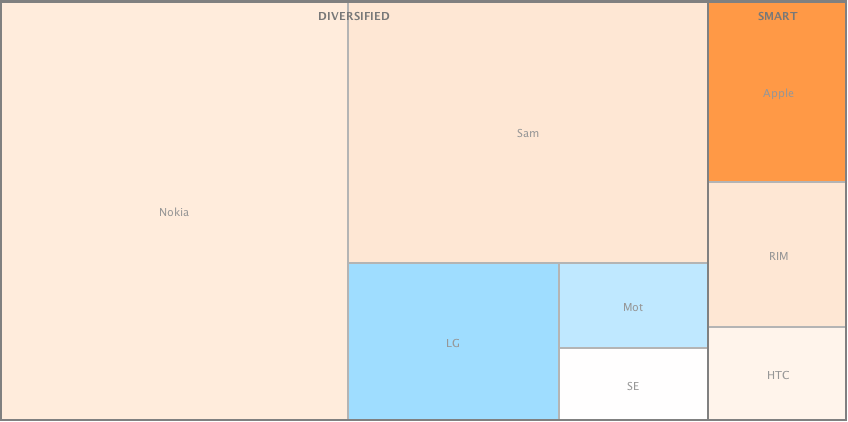
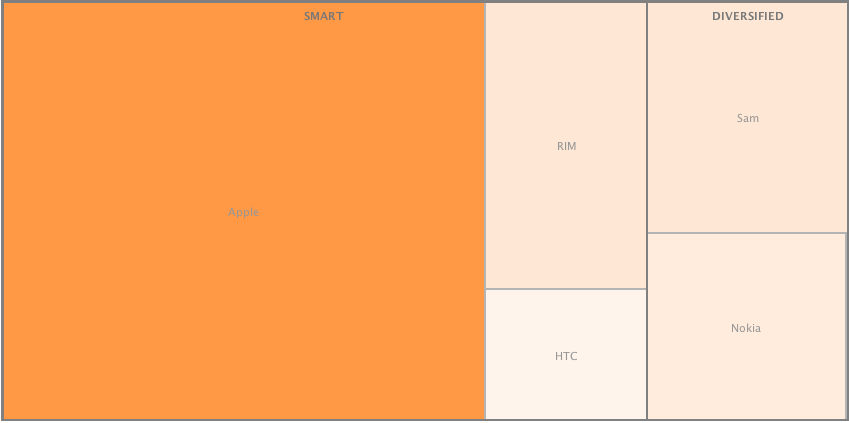
    I produced two alternate views of the primary mobile phone brands in terms of volumes sold and operating profit in Q1.

    These views[1] allow a comparison by categorized competitors. I grouped dedicated smartphone vendors (SMART) vs. diversified and used color coding for profitability (blue colors indicate loss-making vendors).

    The same view is drawn for profitability. Loss-making competitors are excluded.

    This view shows how 16% of the volumes for the smartphone vendors generated 75% of total profits. As smartphone penetration grows, those vendors who maintain a diversified portfolio will continue to see their average price and profitability slide.

    I've suggested before that I don't see non-smart devices being interesting to vendors in the near term. Each additional dumb phone added to a portfolio will decrease a company's operating margin. The market dynamics are such that I think non-smart phones will disappear entirely from branded portfolios in 3 to 5 years.

    ---

    Notes:

    1. These are called "tree views". I used Many Eyes experiment from IBM Research to create these charts.
  5. iPhone share of phone market in Q1: 5% volumes, 20% revenues, 55% profit

    Research · 40 comments

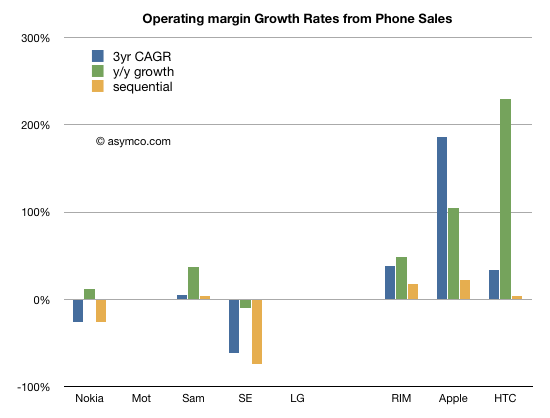
    Operating profits for the eight vendors I track increased at a compounded 25% over three years. As with revenues, the growth is concentrated. The following chart shows operating profit growth across three time frames: three year compounded, year/year and sequential. Loss-making vendors are excluded from this chart.

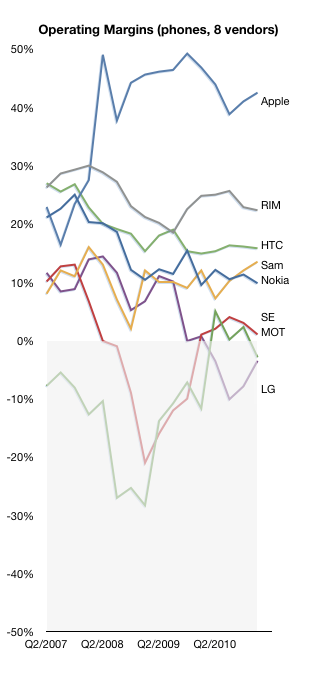
    Looking at individual performance, the following chart shows how each vendor performed over time:

    The mobile industry has historically been unforgiving. Companies that fall into unprofitability tend to stay there or exit/merge. This has claimed many: Ericsson, Siemens, Alcatel, BenQ, Palm, Sony, Toshiba, Handspring, NEC, Hitachi, Casio.

    LG, MMI and Sony Ericsson are all in the same precarious situation. We'll have to watch carefully whether a recovery is possible for any of them and whether Nokia will reach the same rocky position.

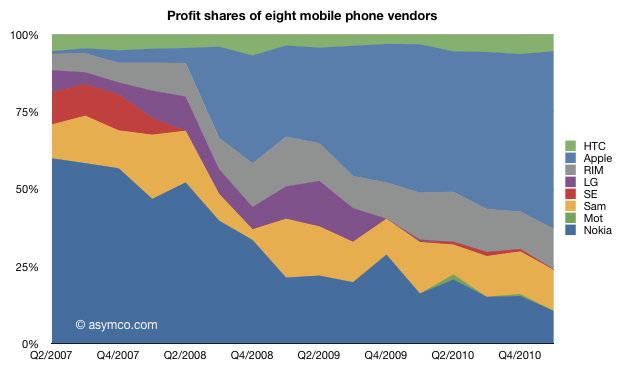
    Looking at operating profit shares, the picture is plain to see. While RIM, Samsung and HTC have maintained profit share, between 2007 and now, profit share has mostly shifted from Nokia to Apple.

    But this does not tell the whole story. Here are the absolute amounts of operating profit from mobile phones. Exactly three years ago Nokia was earning 47% profit share or $2.35 billion. This past quarter Apple's 57% was equivalent to $5.23 billion, more than twice as much.

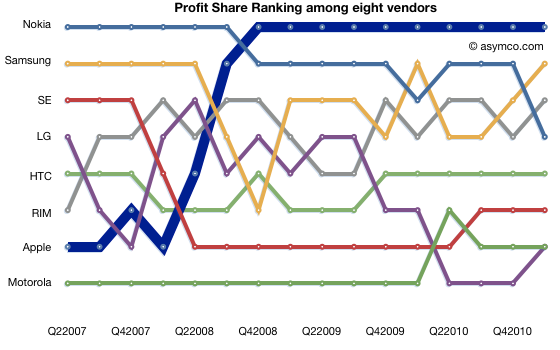
    Finally, the league table shows how Nokia has now dropped from second to fourth in the last quarter. Not only Samsung, but RIM has overtaken Nokia as well.

    It's become routine to see Apple at the top of the list of profit earners from mobile phones.

  6. Did Microsoft pay for the wrong Skype?

    Research · 51 comments

    When a company is acquired, the price paid is usually higher than what the company is worth. This is because there is a "control premium" that needs to be paid so that the acquiring company can control the destiny of the acquired company (while the seller loses that right). So the question has to be what does the premium (or excess cost) buy? What is the value of that control? What will be the new destiny? Whose destiny is changed?

    Clayton Christensen succinctly defined the value in any company as the sum of three constituent parts: resources, processes and business models. Market value can be nothing more and nothing less than these three things.

    An acquisition has to be positioned on one of these targets just like a product is positioned on a specific market. The problem with being deliberate about where the value lies is that once positioned a certain way, the integration team will begin to execute on that plan. This means that the thing you decided was worth most (e.g. resources) gets all the attention and the other potential sources of value (processes or profit models) are discarded.

    This argument reduces to there being three separate companies being available. The buyer pays for all but gets to keep only one.

    When you look at it this way you realize that the reason most acquisitions fail is that the buyer throws away most of the real value in the company.

    For example, when looking at Skype through Microsoft's eyes, they could be valuing it for its resources (employees, management team, customers, or intellectual property.) Or they could be valuing its processes (how it makes software and how it recruits customers) or it could be its business model (viral distribution, very low prices with wide distribution, plan to disrupt telecommunications). Each of these is a separate, mutually exclusive deal with separate integration plan and separate strategic justification. Each is targeting a separate Skype.

    If Microsoft were to pay a premium for Skype's resources then they will probably not make use of the processes or business models. There is some value in this Skype. Microsoft could use the customer base to sustain their existing businesses and to up-sell services.

    But what if the real value is not in resources but in the business model? A model which would allow for Microsoft to disrupt its core business. Perhaps Microsoft could use the Skype approach to creating new customers, eliminating its partner network and expensive direct sales force. This would be a different Skype. It would have the potential to transform Microsoft. Microsoft could become what Skype is now: a communications network or carrier that disrupts the way people use network operators.

    This type of value exists in Skype but its asymmetry with Microsoft's core would make it a very tough sell internally. A recent article pointed out that when Skype was up for sale last time, Google's acquisition was sabotaged internally by people who realized that peer-to-peer would be "incompatible" with the centralized architecture of Google's services. If not for the effort of certain individuals, Google might have ended up with Skype and destroyed it with internal antibodies.

    Chances are that Microsoft paid for Skype's customers and engineers but will not apply the innovations of viral peer-to-peer distribution or disruptive voice pricing. If that happens then perhaps Microsoft will pay $8.5 billion for the wrong Skype and telecom disruption will find another home.

    Notes:

    Adapted from an answer published in Capital.bg. My thanks to Adrian Georgiev for asking the right questions.

  7. Ascent of the entrants: Taking food from the mouths of giants

    Research · 34 comments

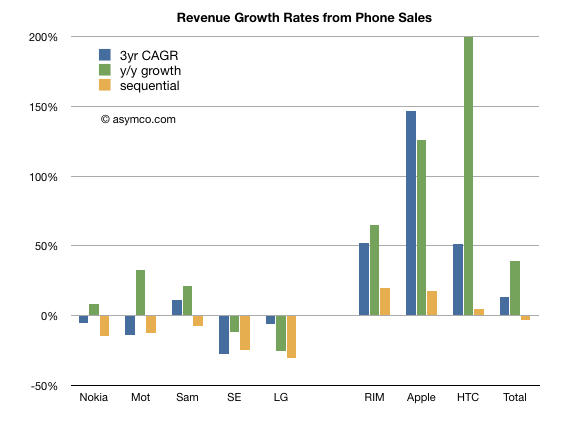
    Revenues for the eight phone vendors I track increased overall during the last three years. The compounded annual growth was about 13%.  However the growth was not evenly distributed. The following chart shows revenue growth across three time frames: Three year compounded, year/year quarterly and sequential quarterly.

    I separated the incumbent companies from the "entrant" smartphone vendors for contrast.

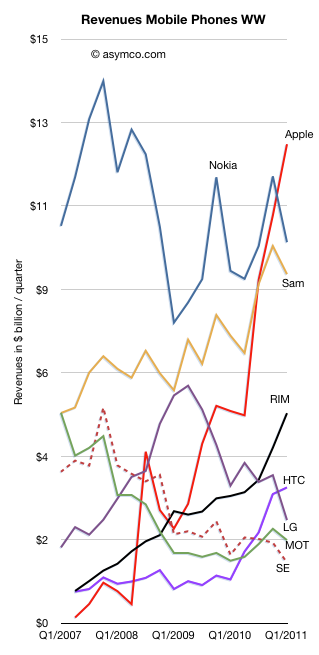
    Looking at individual performance, the following chart shows how each vendor performed over time:

    The share of revenues is shown in the following chart (I highlighted the smartphone cohort):

    The ascent of the entrants is shown in the league table below:

    The headline that Apple became the biggest phone vendor in the world by revenue has already flashed across the feeds of the world. It's another straw on the camel's back. But I'd like to take a moment to note that this is not just an Apple story.

    If you look at the league table, RIM, HTC and Apple were at the bottom three years ago and now they are either in the top or the middle. RIM in particular deserves credit for reaching the fourth spot and staying there. HTC also has shown a late surge to fifth passing LG, Motorola and Sony Ericsson in the process.

    Combined, these vendors went from taking in about one dollar in 20 (6%) in Q2 2007 to nearly half the money (46%) in Q1 2011. As the market also grew, the total amount went up an order of magnitude. From $1.8 billion to $21 billion in three years. Not bad for niche players.

  8. The end of phone vendor tiers

    Research · 25 comments

    It's time to review the mobile phone market at the end of the first quarter of 2011. Before I begin, I'd like to remind that this analysis will span multiple posts and that many details will be published separately due to time and space constraints. Data about platforms, sales, profitability and pricing will be posted separately.

    All data sets and chart data will be available for interaction and download through Asymco Interactive when complete. You can purchase a license to Asymco Interactive anytime and you will have access to any new data sets for next 90 days so don't hesitate to pre-order the report.

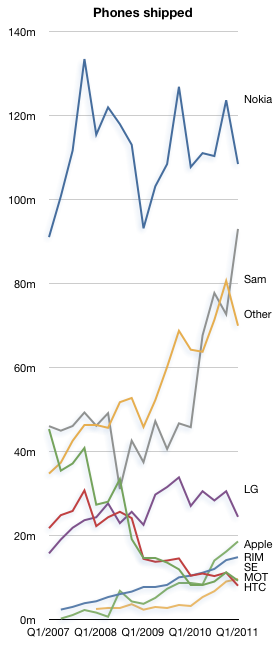
    The overall phone market grew at a compound rate of 9% over three years. The pattern of entrants focused on smartphones and mobile computing growing faster than the incumbents continues. The compound three year unit growth for the tracked vendors in descending order is:

    1. Apple 122%
    2. HTC 55%
    3. RIM 50%
    4. Samsung 15%
    5. Other 14%
    6. LG 0%
    7. Nokia -2%
    8. Sony Ericsson -29%
    9. Motorola -30%

    To give an idea of the split between smart and non smart, Nokia's smart business grew at 18% compounded while its non-smart units contracted at -6% rate.

    In terms of y/y growth the market grew at 26% and the vendor ranking is:

    1. HTC 194%
    2. Apple 113%
    3. Other 103%
    4. ZTE 75%
    5. RIM 42%
    6. Motorola 13%
    7. Samsung 9%
    8. Nokia 1% (smart: 13%, non-smart -2.3%)
    9. LG -10%
    10. Sony Ericsson -23%

    Sequentially, the growth rankings are:

    1. Other 28%
    2. Apple 15%
    3. HTC 7%
    4. RIM 5%
    5. ZTE -10%
    6. Nokia -12%
    7. Samsung -13%
    8. Motorola -18%
    9. LG -20%
    10. Sony Ericsson -28%

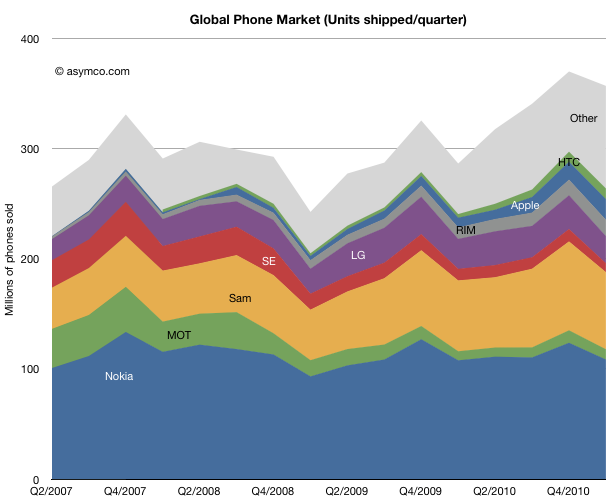
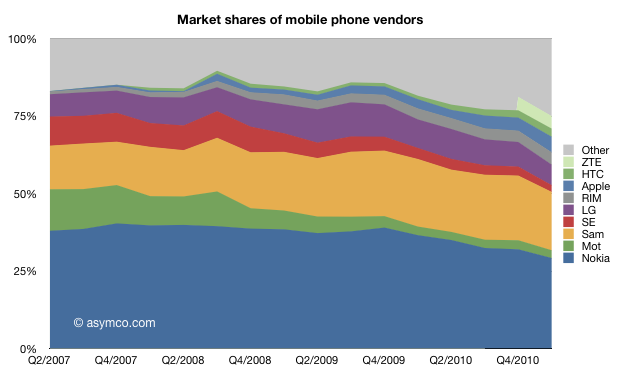
    In terms of market share, the field is becoming more crowded.

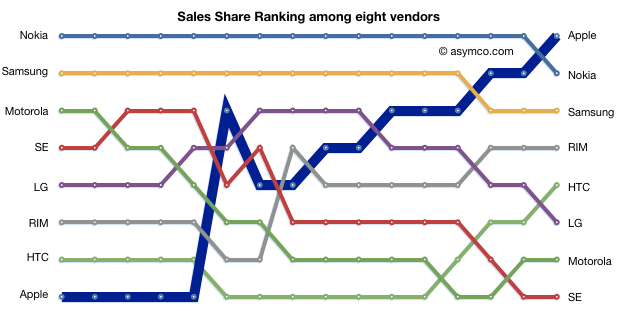
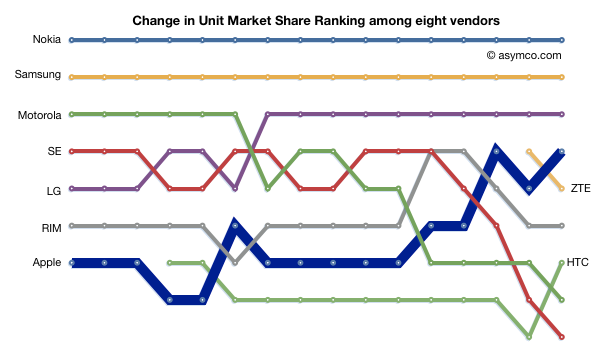
    The ranking of units shows a continuing relegation of Sony Ericsson and the increase of HTC to 7th spot. Apple reclaimed its fourth spot from ZTE.

    As the number of vendors increases and the share of incumbents decreases it becomes harder to identify who is a "top tier" vendor or, in fact, what the tiers are.

    It's pretty clear that on a unit basis there are nine vendors selling significant volumes. The other important observation is that vendors like ZTE are graduating from "other" while "other" is still growing, now at 25% of the market.

  9. Measuring iPhone progress

    Research · 65 comments

    Speaking of boats, there were recent claims that the iPhone is "dead in the water". As someone who has done some sailing I can say that being dead in the water is dangerous. Not only are you not going anywhere but you also don't have steering control. It's movement through the water that allows a rudder to work so being stationary means that you can't orient the boat when waves or wind might threaten stability.

    This implied inability to gain directional control is what makes the accusation so powerful. How valid is it? That claim certainly was not made because the iPhone did not grow. iPhone grew at 113% year on year. It even grew sequentially in a post-holiday quarter and the growth is not slowing materially.

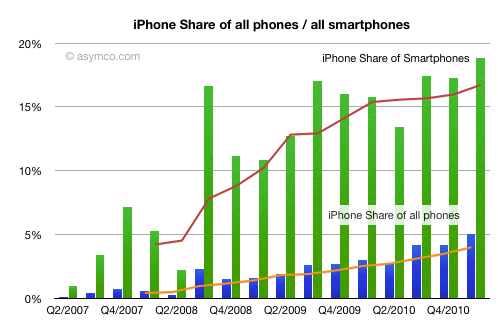
    The claim was made that iPhone was not gaining share. But share of what? If we look at the iPhone share of all phones and share of smartphones, it's still growing. It reached 5% share of all phones sold in the quarter and fourth most popular vendor in the world. Beating RIM, HTC, Motorola, Sony Ericsson and ZTE.

    So what makes the iPhone dead in the water?

    The claim was made relative to the (a) share of (b) mobile platforms (c) installed base (d) in the US. In other words, if one adds all Android phones in use vs. the iPhones in use in the US (while ignoring iOS devices other than iPhone) while the market is growing at nearly triple digit rates, then the iPhone is not gaining (much) share.

    That's the most obtuse way of suggesting a slowing product. If something is dead in the water, it isn't going anywhere or making any progress.

    On a unit basis and one the basis of vendor comparison, iPhone is doing very well. On the basis of value capture and profitability it's doing even better. More about that later.

  10. A rising tide does not lift leaking ships

    Research · 28 comments

    I've often said that the smartphone rising tide has lifted many boats. If you were selling smartphones during the last three years, your business was growing, no matter what phones you made.

    In fact, measuring success and failure was a matter of deciding what growth rate was "not good enough". Growing at 30% was nearly enough to shame some vendors into re-evaluating their strategies.

    But that sort of tidal growth can't last. At some point  ships with holes begin to sink no matter what the tide brings.

    When we look at the data from the last quarter, we should be asking again whether some ships have developed some leaks.

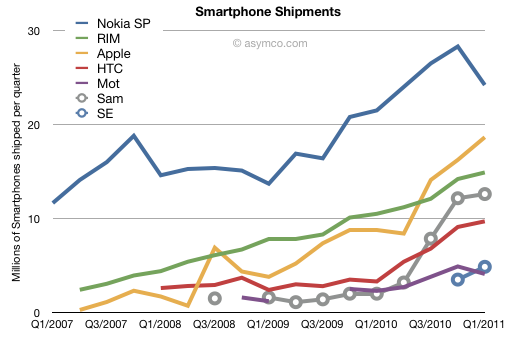
    The challenge is in eliminating seasonal effects. Q1 is usually a sequential drop for many markets. There is an unsettling drop in Nokia and Motorola and a weakening in Samsung and HTC. On a year/year basis the growth rates appear more robust for HTC and Samsung (194% and 530% respectively), but one should note the low bases they started from. Apple maintained triple digit growth (113%) while RIM sustained a respectable 42%. Motorola grew at 78% but looks weak sequentially. Sony Ericsson began to offer smartphone units and they are showing a run rate similar to Motorola but can't gauge their growth rate yet.

    Apple and RIM seem largely unaffected by seasonality but Apple is growing twice as fast.

    But the biggest surprise is the drop in Nokia's volumes. There was a similar drop in Q1 2008 but the phone market was plunging into recession then and the company's smartphones moved in sync to the overall market (one with limited competition). This quarter's drop happened when the overall market is growing. The alarming thing is that Nokia's smartphone performance in Europe seems to be a big part of the problem.

    Data from IDC shows that Nokia's volumes plunged by 15% y/y in Europe while the smartphone market there grew by 76%. Apple ended up with the largest share in a region that had been Nokia's with 70%+ share. That share is now under 20%. Nokia's overall growth was a mere 13% y/y while the market grew 73%. The result is the following picture of Smartphone shares:

    But perhaps the drop should not be a big surprise. Was it due to the public execution of Symbian? Did Europeans stay away from Nokia in droves due to an aging portfolio or because they felt betrayed. Perhaps we'll never know but there is another indicator to mull over. Nokia's brand fell to 81st spot in a recent survey. It used to rank in the top 10.