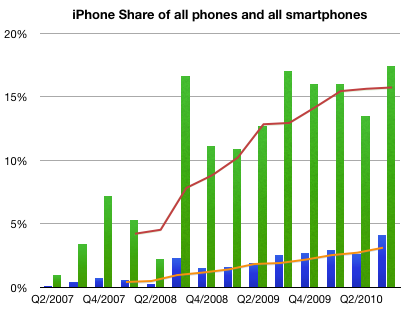
There is some confusion with the latest Canalys teaser press release. The implication is that Apple has lost smartphone platform share due to the Android surge.
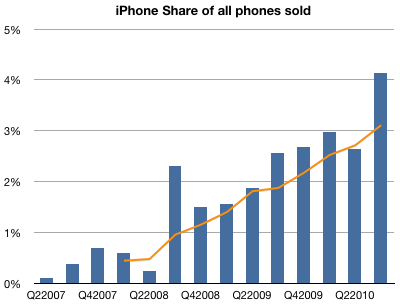
Using the published data, it's easy to see that Apple has continued to increase share in both smartphones and handsets as a whole.
I used green bars to represent quarterly share of smartphones and blue bars to represent quarterly share of all phones.
I used orange line to show trailing four quarters (TTM) share in regular phones and red for smartphones.
Here are the Q2 to Q3 changes in share for the vendors whose data is published:
Nokia 38.4% to 32.7%
Motorola 4.32% to 4.7%
Samsung 5.11% to 9.71%
RIM 18% to 15%
Apple 13.5% to 17.4%
HTC 8.65% to 8.41%
Other 12% to 12%
Sequentially, Nokia lost 5.6% of share, Samsung gained 4.6%, RIM lost 3% and Apple gained 4%, Motorola, HTC and Other remained largely unchanged.
In the mobile phone industry, and indeed, in most technology sectors, price decline is a fact of life. Component prices tend to drop while their performance increases. This rapid obsolescence drives prices down constantly. Competition also plays a part as undifferentiated products are rapidly imitated.
This phenomenon has its own term: price erosion. It's built into most business plans and forecasts.
But how real is it? What are the implications in terms of market share if one accelerates price erosion or reverses it?
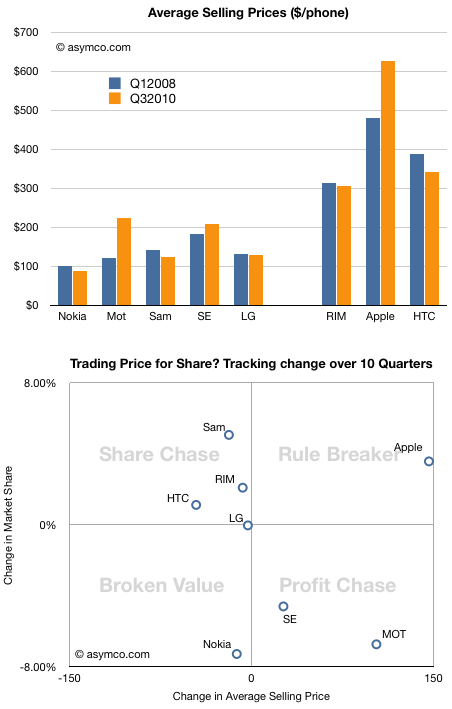
This chart shows the average selling price for all the vendors whose data I maintain over a period of time.
Normally, a drop in price is followed by an increase in share, and an increase in price by a drop in share. To test this hypothesis, I tacked on another chart that shows how share and price have been traded off in the market over the last ten quarters.
Note how prices have dropped for all but three vendors. Two of those vendors (Motorola and Sony Ericsson) have lost share. One, Apple, has gained share. The rest, whose prices did drop, had increases in share, very roughly in proportion to the price drops. Again, we have one exception, Nokia, which suffered both price and share loss.
Except for these two anomalies, the vendors are placed on the -45 degree diagonal that would show expected price elasticity in the market.
I took the liberty of breaking the chart into four quadrants, and gave them names suggesting the strategies of the companies.
Lying along the traditional trade-off axis are either Profit chasing or Share chasing strategies. Anomalies off the axis are either Rule Breakers or Broken Value propositions.
This view of the companies allows us to abstract and think about market evolution.
It would be interesting to think how these players will evolve over time.
It's quite possible that LG will move into the profit chasing model (as they already indicated they would by building more smartphones). These strategies are typical of companies squeezed from the bottom and the top. I once called this group "the biggest losers" and suggested that they are the best target for Android.
It's also possible that Nokia will move into the same quadrant, though their profit algorithm favors share above all else.
The biggest question is whether Apple's rule breaking is sustainable. It's not clear whether they are interested in share as that does not have all that much to do with their definition of "greatness". But a platform strategy begs for volumes.
This remains the biggest puzzle facing observers of this market.
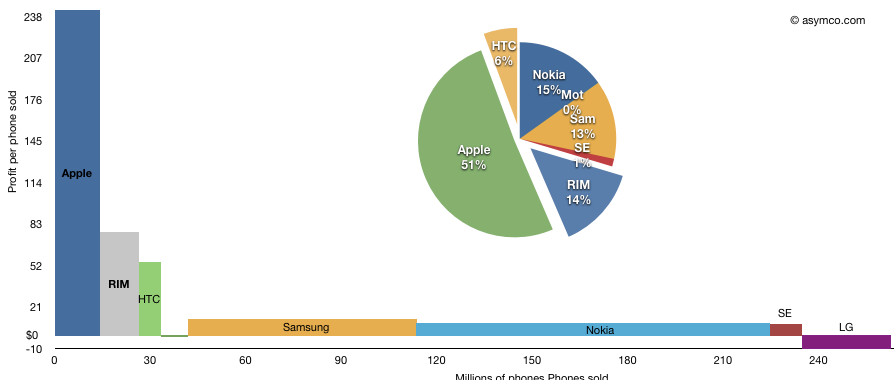
The following chart shows the third quarter's profitability of eight top phone vendors as a measure of phones sold multiplied by profit per phone.
I've added the pie-chart showing the rectangular areas as a percent of available profit in the peer group. Note that LG losses are excluded from the pie chart but included in the area chart.
The total area represents total profit. This representation shows how the largest vendors make relatively little profit per phone but the large unit profit for Apple and RIM gives them a significant share of total industry profits.
Based on a reader query, I tried to find out where, by city, my readership is concentrated. I also sought to break this audience down by operating system.
Here are some observations:
For the last 30 days, here are the top operating systems used to reach Asymco.com, with the number of views from each.
Macintosh 153,768
Windows 101,329
iPhone 78,716
iPad 34,878
Linux 7,262
iPod 5,516
Android 4,869
(not set) 1,236
BlackBerry 447
SymbianOS 396
Looking at each OS, I can list the top cities where readers came from.
Macintosh 153,768
London 6,513
San Francisco 5,316
New York 5,089
Cupertino 4,293
Austin 2,589
Sydney 2,182
Helsinki 2,131
Los Angeles 1,918
Seattle 1,847
Portland 1,482
Windows 101,329
London 3,827
New York 3,275
Helsinki 1,598
San Francisco 1,504
Seoul 1,409
San Jose 1,260
Chennai 1,226
Sydney 1,116
Seattle 1,100
Melbourne 1,035
iPhone 78,716
San Francisco 5,203
New York 4,406
London 4,053
Chicago 2,328
Seattle 1,836
Los Angeles 1,638
Melbourne 1,430
Seoul 1,402
(not set) 1,376
Sydney 1,261
iPad 34,878
London 1,759
New York 1,060
San Francisco 1,020
Chicago 857
Melbourne 739
Outremont 694
Santa Rosa 585
Seattle 555
San Jose 456
Santa Clarita 440
Linux 7,262
San Francisco 376
London 233
Helsinki 180
New York 131
Cambridge 126
Bangalore 109
Nantes 109
Sydney 107
Perchtoldsdorf 93
Paris 86
iPod 5,516
Eau Claire 471
Melbourne 396
Seattle 290
Abuja 248
San Jose 214
Hudson 197
Sydney 195
Budapest 109
Boston 95
London 86
Android 4,869
Seoul 761
(not set) 325
Dallas 248
New York 169
Amsterdam 148
Calcutta 131
San Francisco 81
London 74
Los Angeles 74
Bergen 72
BlackBerry 447
New York 121
(not set) 78
Waterloo 56
London 50
Buenos Aires 16
Hong Kong 9
Oldsmar 9
Fairfield 7
Wappingers Falls 6
Boston 5
Symbian OS 396
Helsinki 216
Kauniainen 23
London 21
Seoul 13
Tehran 10
Frederiksberg 6
(not set) 4
Chennai 4
Krakow 4
San Francisco 4
The first surprise for me is that Seoul is the most popular source for Android views.
The second is that London is so prominent. Although the US is the biggest source of traffic by far, London is a very concentrated source from the UK.
The third is how there seem to be no Blackberry readers in the SF area.
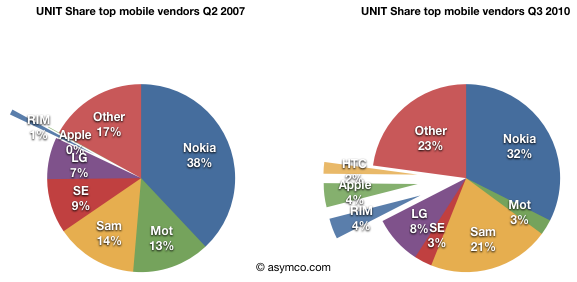
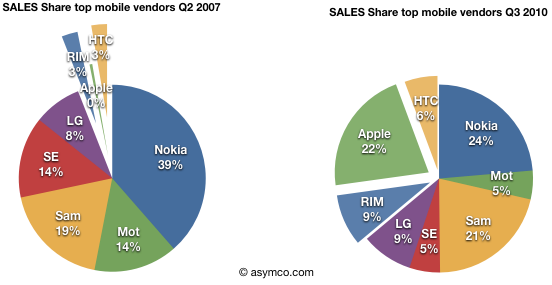
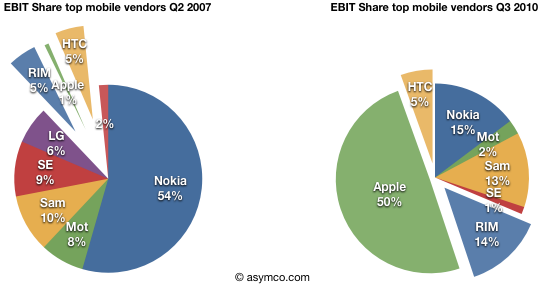
Pie charts showing 13 quarters of mobile phone market evolution between the largest vendors. Pure play smartphone only vendors are shown with exploded wedges.
Apple reached fourth place in ranking of top phone vendors by units sold. I guess that makes it a "top tier" vendor.
So how did it get there?
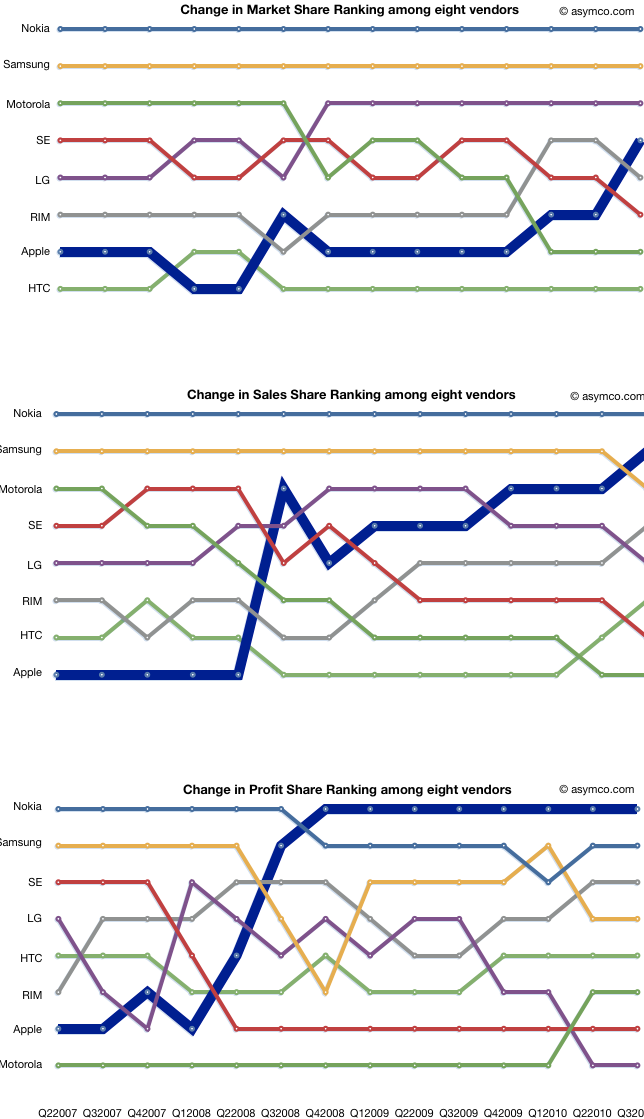
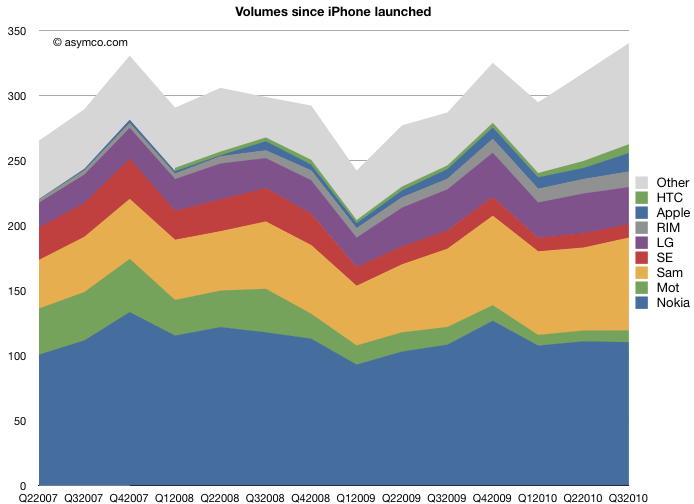
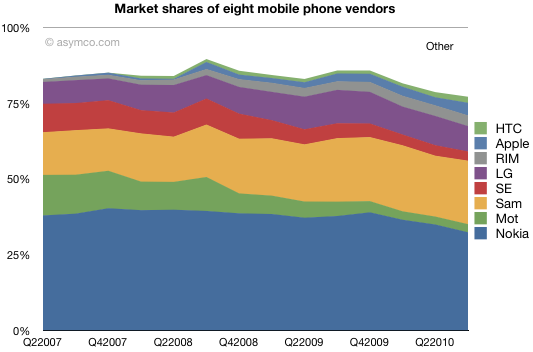
Here is a chart showing how market share evolved since the quarter when iPhone launched:
Units sold and shares.
The chart shows how this cohort of eight vendors has fared over the past 3.25 years. The squeeze on Motorola and Sony Ericsson is plainly evident. What's harder to tell is how the tiny players in the smartphone place fare in the ranking of "top tier".
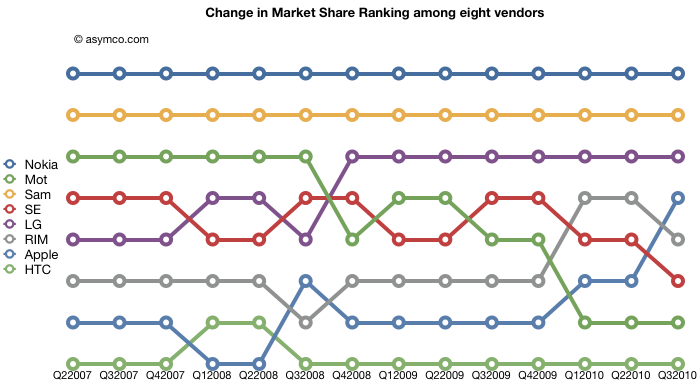
Here are the same vendors with their position in the volume leader league table over time:
Lots of interesting patterns here which I'll leave to the reader to interpret.
I am dead serious. I am now convinced that we have enough data to determine for a fact that Apple will not only see a dramatic decline in quarter-on-quarter sales in units of the iPhone this January-March quarter (which is the predictable pattern and no surprise) but that we will also see a decline in iPhone market share against at least HTC and Blackberry; that would be demoralizing news in itself. I know now that the numbers are clearly stacking up so, that the annual sales level of iPhone units, will result in a decline in iPhone annual market share in 2010.
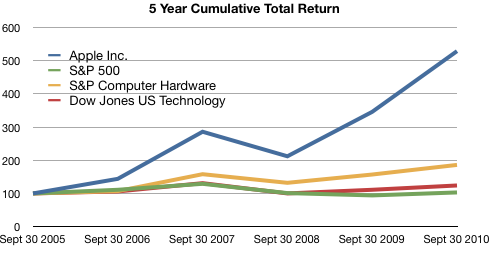
The following graph shows a five−year comparison of cumulative total shareholder return, calculated on a dividend reinvested basis, for the Company, the S&P 500 Composite Index, the S&P Computer Hardware Index, and the Dow Jones U.S. Technology Index. The graph assumes $100 was invested in each of the [securities].
In other words, if you had invested $100 in the S&P 500 in September 2005, you would have $103 now. If you invested $100 in Apple in September 2005, you would have $529 now.
Apple investors should rejoice!
However, in terms of reward for earnings, consider the following graph:
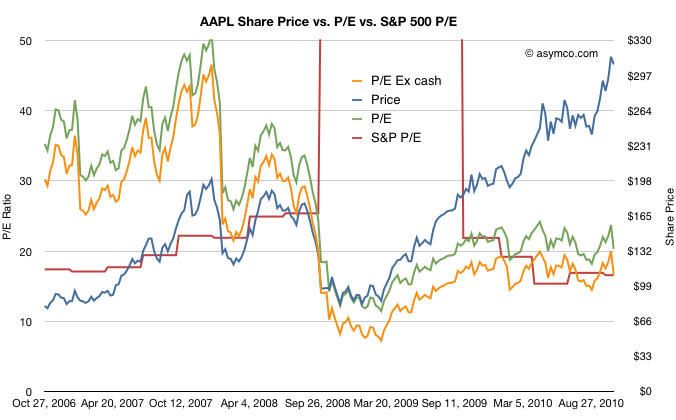
The red line represents the S&P 500 P/E ratio and the green and orange lines represent Apple's P/E ratios depending on whether you include cash in the price.
The reward to investors Apple does not seem so appealing anymore.
Although Apple received a premium valuation to the S&P prior to October 2008, it has traded at a discount or in-line with the S&P since then.
Another way of putting it is that the P/E ratio for large companies has returned to pre-recession levels. The P/E ratio for Apple has not.
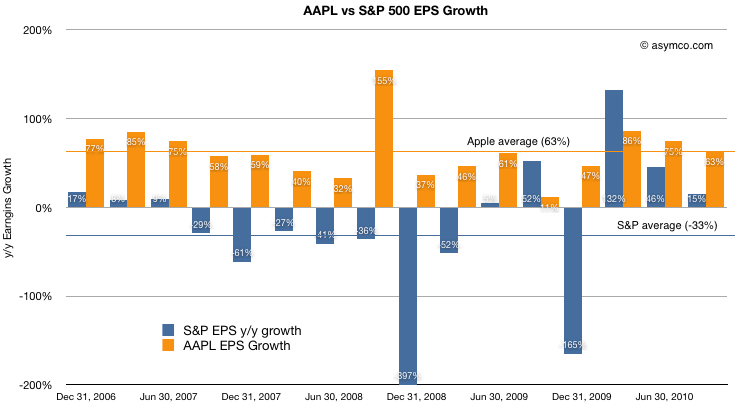
For a final point, a comparison of earnings growth (which should correlate to the P/Es) above shows that while the S&P is given a similar valuation to Apple, growth has been decidedly less spectacular.
Apple's average growth over the period shown was 63% (shown as the orange line) while the S&P has grown at an average of -33%. Nevertheless the market has chosen to reward the two assets with the same multiples valuing their future growth in earnings roughly the same.
At least they are equivalent. For much of 2009 and early 2010, Apple was considered to have a far less promising future than the average large American company.
If estimated warranty expense had remained constant in absolute dollar terms ($150M), GM would have been 38.4% vs 36.9%. If If estimated warranty expense had remained constant in as a percentage of revenue (1%), GM would have been 130bps higher at 38.2%.
Muller spots the culprit in the margin drop. He notes that this is money set aside and may have been in anticipation of returns of the iPhone 4 due to antennagate. Note how in 3Q cost of claims was 155 and accruals were 157, about a 1:1 ratio whereas in 4Q costs were 286 and accruals were 457 about 1:1.6.
It's possible that if the costs this quarter do not materialize then we could see a margin upside surprise.
(Contrast this insight with today's large scale sell-off in shares due to mass media repetition of earnings guidance from the conference call as shocking "news." See also evidence of unlawful trading behavior here.)
LG saw its profit fall apart today as its summer results were hurt by its weakness in phones. Its profit plunged 99 percent, down from $805.6 million a year ago to $6.7 million. The Korean company was dragged down by its mobile group, which had a record loss of $270 million. The company's total phone shipments also dropped, going down 10 percent from year to year at 28.4 million.