Asymco

Asymmetric Intelligence

Horace Dediu

  1. Re-framing the dichotomies: Open/Closed vs. Integrated/Fragmented

    Research · 31 comments

    Google likes to market itself as "Open" in contrast to "Closed" alternatives.

    Apple likes to market itself as "Integrated" in contrast to "Fragmented" alternatives.

    These dichotomies are judgmental and meant to portray "us=good" vs. "them=evil". Neither gets to the point of how the two companies are structuring their businesses relative to the mobile computing value chains and clouds the judgement of observers.

    I propose using a more informative and less judgmental distinction. It's a division defined clearly by Clayton Christensen in his classic "The Innovator's Solution" from 2003.

    He introduced the concept of interdependent vs modular systems.

    Interdependent systems have linkages between elements ranging from product components to the members of a product value chain. Essentially, the pieces communicate or interface via non-public or non-licensed protocols and have only specific partners (e.g. the iPod and iTunes).

    Modular product architectures, on the other hand, are similar to the concept of plug-and-play and resemble building blocks, consisting of standardized interfaces, enabling parts to be easily swapped in and out and multiple suppliers or partners to compete.

    Neither of these architectures is "good" or "bad". They are natural ways to organize according to what business model or point in the evolution of a technology you are at.

    Interdependent architectures are the only way to rapidly and competitively improve the performance of not-good-enough systems. Modular architectures are the only way to squeeze profitability from more-than-good-enough commoditized technology.

    Interdependent systems often lead to higher performance than modular systems because the system is optimized. Engineers can iterate more rapidly to squeeze the maximum performance from sub-systems by connecting them in ways that makes the best complete solution. In contrast, modular systems often lead to lower costs because there are a greater number of suppliers, since interfaces are standardized and pieces can be swapped in and out.

    Interdependency is often required to raise the performance of a new solution. In contrast, modularity is required to lower the cost of an overserving solution.

    Continued interdependency often drives the performance of that solution beyond that which the target market is willing to pay for. The target market then frequently turns to modular solutions which, at that point, often offer good enough performance along with modularity-driven advantages such as lower cost, convenience, or other benefits.

    So the question is not whether one is better than the other but when either one should be used.

    Modular architectures are often the solution when interdependent architectures prove too costly. Interdependent architectures are the solution when modular architectures are not good enough or can't solve new jobs that users discover they need to solve.

    Apple's value systems, priorities and processes are all tuned to interdependent architectures. Google's value systems, business models and competencies are all tuned to modular architectures.

    Apple solves the problems of new markets, Google solve the problems of over-served markets.

    So the winning[1] strategy depends on detecting where a product lies in its march up the performance trajectory. Before it's good enough, interdependent systems win. After it's good enough, modular architecture wins.

    So where is the smartphone on its evolution? If it's still early days, iPhone will keep growing. If it's saturating and improvements are neither valued nor used, then it's time for a modular approach.

    Place your bets now according to your vision.

    ---

    By winning, I mean capturing the bulk of the profits in the industry.
  2. Motorola ships 3.8 million smartphones

    Research · 6 comments

    Sales from its handset business climbed 20 percent to $2 billion last quarter, helping to narrow its loss to $43 million from $216 million a year earlier. The division had an operating profit, excluding some charges, of $3 million. Motorola said it shipped 3.8 million smartphones last quarter.

    via Motorola Profit Tops Estimates on Rising Sales of Droid Phones - Bloomberg.

    Motorola shipped a total of 9.1 million phones. This is down 33% from the year-ago quarter's 13.6 million units but up 10% sequentially from 8.3 million last quarter.

    I'll summarize the top tier vendors' unit volumes, sales value, price and profitability in a few days.

  3. Wall Street's Infinite Loop: How AAPL is valued

    Research · 30 comments

    In the previous article discussing the growth scorecard, I left open the question of how Apple's growth is reflected in its share price.

    The approach to answering this question is to show how the share price correlates to that growth. The challenge for analysts has been that the company switched from subscription to current accounting for the iPhone (the largest component in its income statement). As they re-stated income and thus earnings, any historic review of P/E or other multiples of Earnings have to also be re-computed.

    So this is what I've done:

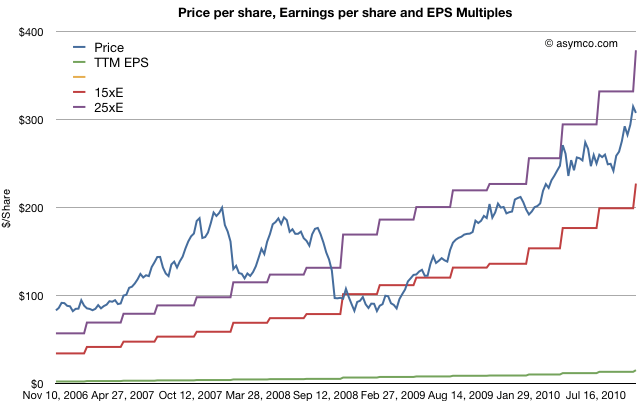
    The first chart shows Apple's price per share (blue) vs. its trailing twelve months earnings (green) and multiples of those earnings (15x and 25x).

    The chart shows how Apple was priced well above 25 P/E before October 2008 and has remained within the 15 to 25 multiple bands since the winter of 2008/2009. This seems fairly reasonable and the stock's rise is a cause of celebration for many, but a cause for concern for some. Is this rise in price matching a rise in value?

    To answer, we need a way to look at the valuation of Apple. One way is to plot the P/E ratio over time. That would show how the market perceives the value of the company (i.e. how many years' worth of earnings is built into the price) The chart below does that.

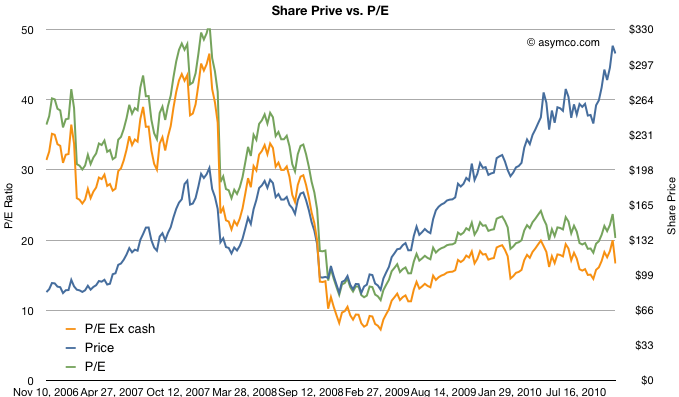
    I took the additional steps of plotting the P/E excluding cash from the price to show "P/E Ex cash" in the orange colored line and I also copied the Share price line from the first chart on this one for contrast.

    What the P/E analysis shows is that as the stock rose, it's P/E ratio fell. This means that the "valuation" of the company is quite a bit lower now than it was in 2006 and 2007. In fact, as a multiple of profitability, Apple's stock is nearly half as valuable now as before the recession.

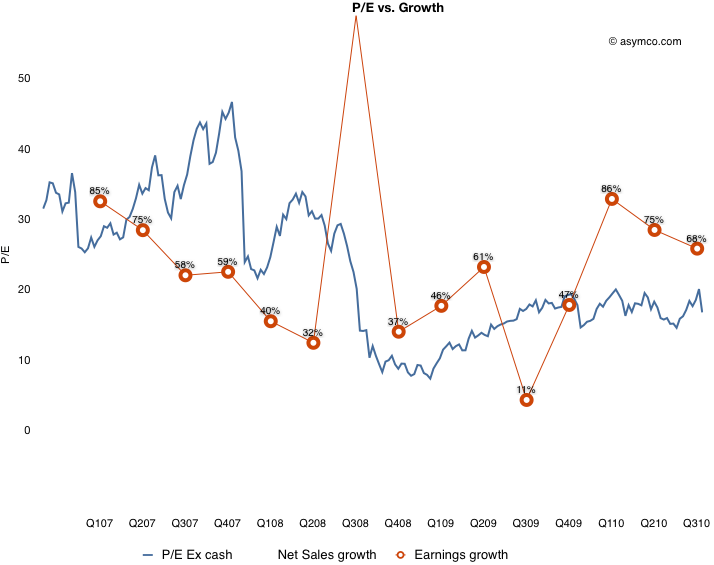
    Since valuation is usually correlated with growth, (P/E is often compared in a ratio with Growth) we need to see whether the P/E in the chart above matches the actual growth of earnings. Fortunately we have just measured growth with the scorecard.  Here are the two charts together:

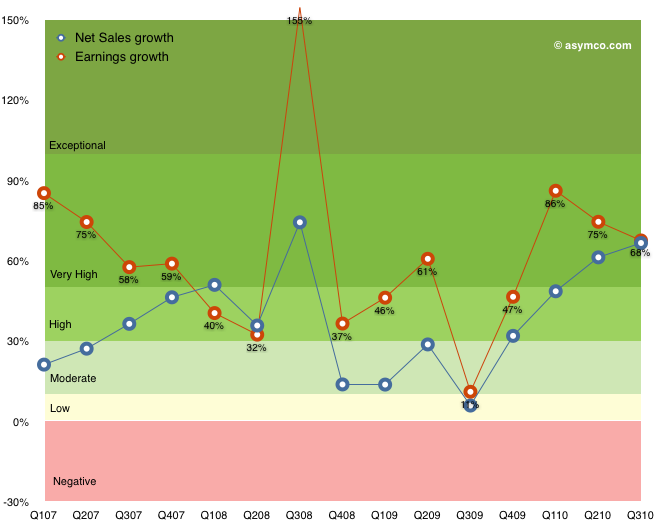
    What this shows is that while earnings growth did slow down in the lead-up to recession (with the hugely anomalous 3G launch spiking growth to 155% in Q308 causing the year-later plunge to 11%), growth picked up again in the depths of recession and has moved back to pre-recession levels. The only difference is that the multiple assigned to the stock has remained near recession lows. This is visualized by the blue line being mostly above the red line pre-crash and usually under it post-crash.

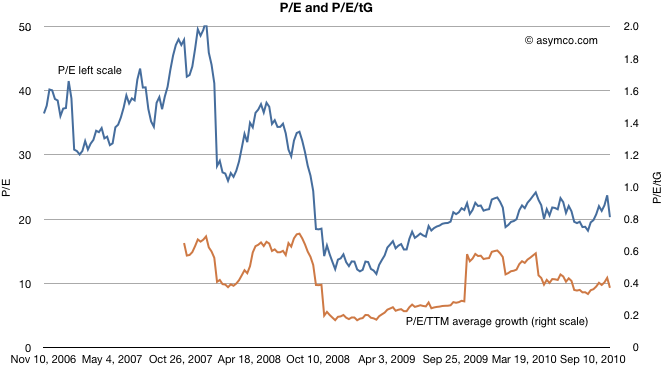
    To put a finer point on this, I plot the ratio of P/E and trailing growth (P/E/tG) in the brown line below:

    It shows that as a measure of valuation with respect to growth, Apple is trending down. A P/E/tG ratio of 0.4 and closer to 0.2 if we exclude cash shows very weak confidence.

    The only conclusion I can draw is that the market does not believe that Apple has significant growth opportunities. A P/E of 20 with consistent 70% growth is, to be blunt, damnation. For comparison, Amazon just reported 16% growth in earnings and was rewarded with a P/E of 68.

    Amazon notwithstanding, is Apple an anomaly? Is the disconnect between earnings growth and the stock price unique to Apple or does it apply to most other equities? Is pessimism about Apple a symptom of pessimism in general? I will suggest a way to answer this in a future article.

  4. Apple's Growth Scorecard

    Research · 14 comments

    Every quarter I try to score growth by top, bottom and product lines. As unforeseen growth is the only driver creating shareholder value, it's of paramount importance to measuring a company's performance.

    For Apple, the analysis is fairly straight-forward. There are relatively few product lines (seven including the iPad). I measure y/y sales growth and try to form a picture that is easy on the eyes and mind.

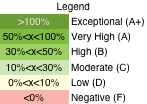
    The method I'm using now is color coding growth for each line according to the legend to the left.

    The table that follows shows each product plus the Net Sales and Earnings lines according to this color coding. I also added an average column for reference.

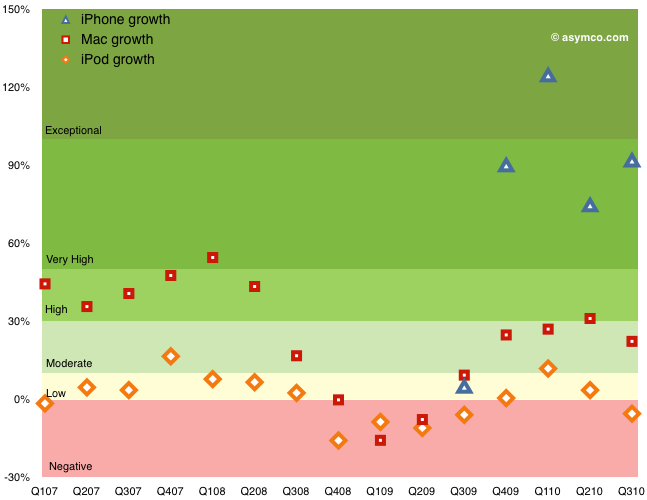
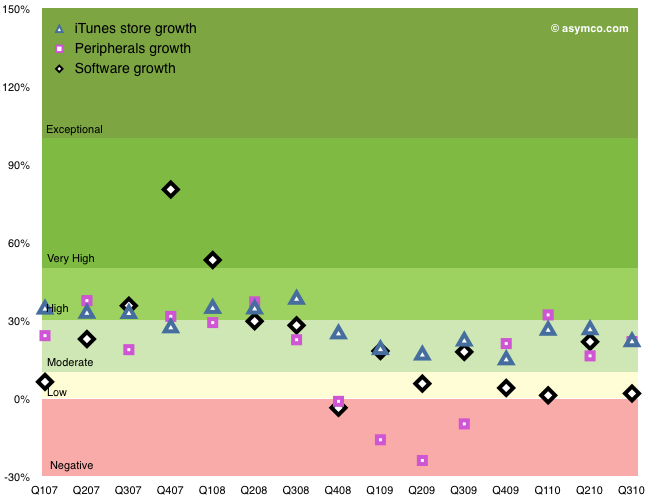
    The following graphs show the same data with color coding for the rates as they change over time. I broke the data into three charts: Top/Bottom lines, Hardware Products, Other Products.

    Discussion

    Hopefully this representation describes the company's growth without requiring too much explanation. Earnings growth, which determines ultimate value created is near all-time highs, well into the "Very High" (A) growth band. Apple have recovered from the Moderate-to-High (B/C) bands during the recession and are near the levels of 2007 when the company was trading at a P/E of 50 (today's P/E for Apple is 20). Sales growth broadly followed earnings growth.

    Within the products, the iPhone again shows exceptional performance. The growth during the first five quarters was (literally) off the scale (above 150%--see table for actuals). The average quarterly y/y growth has been 234%! Last quarter's 92% growth is very near the 100% threshold for exponential growth. This after three years in the market.

    The Mac growth is Moderate (B) and that may be because it was not a launch quarter for portables. The Mac underwent Very High (grade of A) growth for a period of 2008. The iPod shows weakness. The product has been in a Low-to-Negative  (D to F) band of growth since the iPhone launched. Clearly a mature product line but one which has been largely subsumed into the iPhone and iPad. The iPod touch is increasingly a large proportion of the iPod line.

    The non-hardware product lines are Low-to-Moderate growth products. The Peripherals business tracks very closely to the Mac business and dipped negative during the recession.

    Overall, the growth scorecard is in the "Very High" category, or a grade of "A", mostly driven by the iPhone and iPad. Whether this growth will be reflected in the share price is a question reserved for a future discussion.

  5. Sony shares up on speculation of Apple interest

    Research · 28 comments

    TOKYO (Reuters) - Shares of Sony Corp rose nearly 3 percent on Tuesday as traders cited media reports speculating that the Japanese electronics maker could be a potential acquisition target of Apple Inc.

    via Sony shares up on speculation of Apple interest - Yahoo! Finance.

    There's a sucker born every minute. That phrase, (erroneously) attributed to a major benefactor of my Alma Mater, continues to ring true today.

    Although Steve Jobs once admired Sony, the company today contains nothing of value to Apple. A disruptor is unlikely to buy the company he just disrupted. Would Sony have bought Westinghouse? Would WalMart have bought Sears? Would Microsoft have bought IBM in the 1990's?

    When considering an acquisition the chances are that the asset being purchased is going to ask a premium price. So the buyer has to answer this question: what is it about the asset that makes it worth more than the market price?

    There are three (and only three) sources of value that a buyer can buy:

    1. The resources (intellectual, physical, contracts, channels or employees)
    2. The processes (the algorithm of how those resources are put to use)
    3. The business model (the way the assets and processes and applied to create profits).

    A company like Sony has some resources but its processes and business model are obsolete. Should Apple pay a premium for Sony's assets? I don't see a reason why.

  6. Visualizing Apple's Profitability

    Research · 26 comments

    After the last earnings report, many noted that Apple's gross margins dipped. Turley Muller noted in a letter to PED that the cause was probably the aggressive ramp in iPhone 4 production which broke new records at 14.1 million units.

    That may be. My estimate of iPhone margin shows it dropping to about 49% from the more usual 55% (sometimes even higher).  We'll never know exactly how much, but sometimes margins drop. RIM and Nokia are punished for drops in the GM percent so why shouldn't Apple?

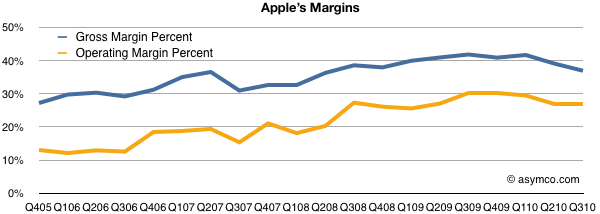
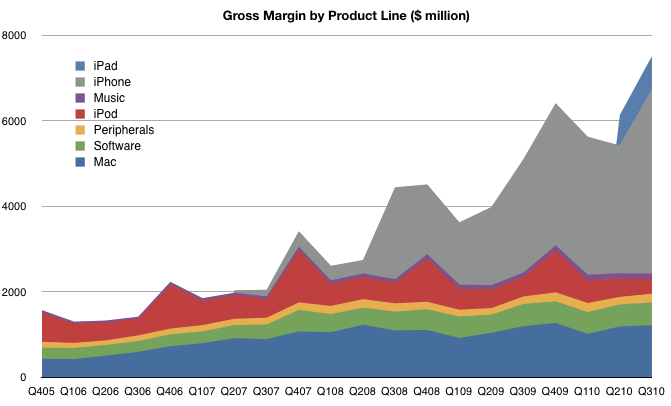
    However, there are some other factors to consider: the overall margin is currently historically very high. As the high-margin iPhone makes up more of the total product mix, the overall margin should be growing. And it is. The chart below shows the trend since 2005. GM was in the high 20's five years ago.

    Note however the other margin: operating margin. After taking the fixed costs into consideration (which we saw to be shrinking as a percent of sales), Apple's bottom line profitability has been rising slightly more rapidly than the GM. It has plateaued recently but not dipped significantly.

    Also note that there have been dips in the past from which GM expansion resumed. One such dip was at the launch of the first iPhone in 2007, though we can't be sure that was attributed to the iPhone itself or to other factors like that most cited by management: components costs.

    However, the bottom line profitability is only part of the picture. It would be instructive to look at which product contribute how much. You won't see this analysis often because the gross margin by product is not published by Apple and it takes quite a bit of guesswork to get there.

    I maintain product-level gross margins and compute the overall GM bottom-up. The product-by-product line profitability is based on several assumptions which I won't detail here, but those assumptions lead to the following contribution chart:

    There are several takeaways here:

    1. The iPhone is huge (57% of gross profits). It is far more important than most people assume. Without it, the company would not have materially grown EPS since 2007.
    2. The "Music" which includes iTunes revenues is tiny. Many people assume that iTunes is a large contributor to Apple's operating profitability but operating margins on the store are 10 percent. Peripherals add more to the bottom line than the iTMS/App Store. The benefit of the iTunes/App Stores is in the hardware sold.
    3. Software contributes more now than the iPod. This is completely under everyone's radar but Apple's software business has been growing and with 80% gross margins (assumed) it's a big part of the profit picture.
    4. The iPad margins are lower than the iPhone. As it grows in volume, the profit share will grow, but it's a long way from being the profit share leader.

    This picture should also be a warning to Apple's competitors. If they seek to grow shareholder value and shift profits away from Apple they need to see just how much of that profit is captured in hardware. At the same time, they need to realize that it's the non-hardware businesses which make the hardware so desirable. Like it's products, Apple's income statement is very inter-dependent.

  7. Supporting Asymco

    Sponsor · 7 comments

    I've received many supportive comments following the Fortune piece. Many also worried that the site is fragile due to a lack of income.  I'd like to put those worries to rest.

    First, I want to state one goal for the site which defines my attitude toward how to monetize it: I intend this site to be a useful resource to the reader.

    From utility comes value. I want readers to obtain value with a high signal/noise ratio. Unless well targeted, advertising drives up the noise factor and lowers usefulness. I would only accept advertising if it improved the value to the reader. Since ad networks will push ads over which I have no control I cannot be sure that they are adding value and not contradicting my content. But as you see in the right-most column, I do accept advertisements (sponsors) whose message I can evaluate and curate. You can be a sponsor (see the sponsorship page for a measure of what value you can gain from exposure through Asymco).

    Second, there is also another way to support Asymco: if you use iTunes, do your music, movies, app or TV show shopping through the affiliate link in my site. It's the App Store logo in the upper right corner. Or bookmark this link: Support Asymco by buying content. I receive a commission of up to 5% from any purchase made through that link. It has already been enough to pay for my hosting.

    Third, there are also indirect ways in which I derive value from Asymco. I offer consulting, data and services to clients directly. If you are interested in any of these feel free to contact me directly by email.

    Thanks to all who read and contribute comments to this site. The biggest value to me is the learning I get from interacting with the readers.

  8. The Mac App Store: can it change the software business?

    Research · 36 comments

    What is it that makes the iTunes App Store so compelling? Will the value the App store added to the iPhone be added by the Mac App Store to the Mac?

    Here are the characteristics I think make the App Stores valuable:

    1. They redefine software as content. The pricing, marketing, discovery and buying process is identical to that for content like music or video.
    2. They redefine the skill required to create a relationship with customers. They allow a new class of less-skilled and less-capitalized developers participate in selling software directly to the buyer. By "skill" I don't mean engineering skill but marketing skill. A developer can create a product that can reach millions without having to acquire with channels and distribution skills.
    3. From a consumer's point of view, they simplify purchasing and lower the price of software.

    These three characteristics of app stores make them disruptive. The disrupted companies are the traditional software publishers. The response from game publishers to the App store were predictable: they condemned it for destroying value, "cheapening" their product, and creating a race to the bottom. They also predicted that it would all end badly as nobody would make any money.

    The truth is that they were disrupted by different cost structures. The entrants did not need to spend on market development, and focused on innovating on the essential novelty of the user interface.

    So the Mac App Store could be disruptive to traditional software vendors. A large new population of software developers could emerge targeting the Cocoa environment and they may bring new apps that move the jobs that the computer is hired for to appeal to new users.

    However there is a problem. The Mac is a small target market relative to iOS. Apple announced that there are 50 million Mac users. This compares badly to the 130 million (or so) iOS users. It won't be long before 50 million iOS users will be added every three months.

    So the first thing that Apple needs to do is grow the Mac installed base. Perhaps the new Air and following updated to the MacBooks will do just that. But the growth rate needs to be an order of magnitude faster. And I suspect price is an obstacle to this growth.

    Regardless of this obstacle, the Mac App Store has the potential to change the appeal of the Mac. As the first personal computer with an App Store, new uses may emerge and create the same app-platform effect.

  9. Nokia's moderate-intelligence-phone performance

    Research · 60 comments

    A complete market overview will follow when all the top tier vendors report the last quarter, but in the mean-time here are some data that are available:

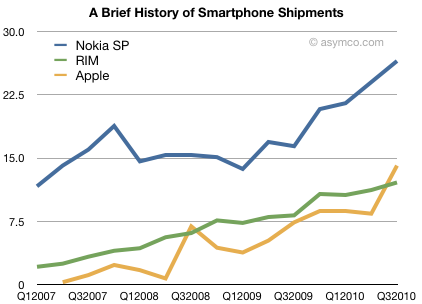
    Smartphone volumes for Nokia, Apple and RIM:

    Whereas Nokia is often criticized for being weak in smartphones, the fact is that they have grown at a decent rate over the last two years. In fact, they've opened a gap with RIM. Apple has increased share but it will take quite a while to overtake Nokia.

    So why is Nokia's smartphone performance so under-valued? Partly it's because ASPs have been dropping. A lower price and lower margin is sometimes seen as a sign of weakness. But Nokia has had a strategy of expanding into more price brackets in their core markets (i.e. outside the US). Half of Nokia's smarpthones are sold through distributors not operators and probably end up being sold unlocked and unsubsidized. Price matters in those markets.

    The other problem that Nokia takes a beating over is that their products don't get used as smartphones. Many are sold without data plans at all which makes one wonder what exactly makes their phones "smart". So many of these 100+ million/yr.  smartphones are really hired to do a feature phone job. They're "overqualified" and thus underutilized. The statistics in terms of app downloads, browser and ad impressions all lag as a result. The ecosystem suffers.

    Lastly, they are all but absent from the US. Due to accidents of history (CDMA) and various mistakes, Nokia never got a foothold in what turned out to be the most important mindshare market. A decade ago the US was a mobile data backwater, with lower data ARPU than Nigeria. It was not a market Nokia felt particularly deserving of investment. In hindsight, this was a big mistake.

    But these knocks against Nokia still should not detract from the fact that they do sell a lot of Symbian phones. Distribution still matters as does having 600 operator customers. And in many parts of the world, Nokia is synonymous with mobile phone. Many of those buyers will migrate to future Symbian devices.

    My mobile platform thesis has been that as long as penetration is not 80% and as long as operators are still in the value chain, mobile platforms will remain fragmented and split shares. The graph above shows exactly how that has evolved among the top three smartphone vendors.

  10. The new king of Apple analysts - Apple 2.0 - Fortune Tech

    Research · 28 comments

    The new king of Apple analysts - Apple 2.0 - Fortune Tech.

    My thanks to Philip Elmer-DeWitt but I think he is not right in proclaiming a King. Credit is due to all the other blogger analysts who inspire and push analysis forward.

    The  lines were nothing but a commercial advertisement, but they very well describe this group that opened the eyes of the world:

    Here's to the crazy ones,

    the misfits,
    the rebels,
    the troublemakers.
    The round pegs in the square holes.
    The ones who see things differently.

    They're not fond of rules
    and they have no respect for the status quo.

    You can quote them,
    disagree with them,
    glorify or vilify them.
    About the only thing you can't do
    is ignore them,
    because they change things.
    They push the human race forward.

    And while some may see them as the crazy ones, we see genius.

    Because the people who are crazy enough to think they can change the world
    are the ones who do.

    "Crazy Ones", directed by Chiat/Day's Jennifer Golub who also shared the art director credit with Jessica Schulman and Yvonne Smith. The familiar voiceover was by Richard Dreyfuss. See the video here.