Asymco

Asymmetric Intelligence

Horace Dediu

  1. Competing effectively against your most potent competitor

    Research · 55 comments

    New market disruptions take root in non-consuming contexts. For instance, mobile phone photography began not because early phone cameras were good. They weren't good at all but good enough when a camera was not within reach. The quality was poor but the photo taken would not have otherwise been taken, making a lousy photo better than no photo.

    The result is that the total number of photos taken this year will be ten times higher than the total number of photos taken before the advent of mobile phone cameras. ((The total number of photos taken in 2014 is likely to be around 880 billion. Prior to 2000 the total number of photos ever taken is estimated at 85 billion.))

    This rush to use the phone as a camera has meant that phone makers are keen to improve their product (so as to compete effectively with it against each other) and as a consequence they overtake the incumbent camera makers in quality as well as quantity.

    The same phenomenon was experienced by fixed component "Hi-Fi" audio products. The quality of mobile music was poor but it was convenient and convenience translated into consumption and consumption translated into quality improvement and eventually the evaporation of usage of the traditional category.

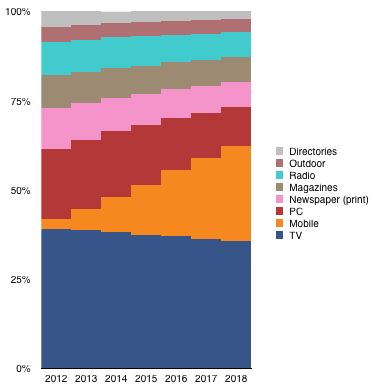
    Now consider how ad dollars are getting spent. The following chart shows the eMarketer forecast for ad spending mix across different media in the US.
    Screen Shot 2014-07-02 at 7-2-8.12.01 PM

    It would appear that the "Mobile" media is competing effectively against the other media types, especially the non-Mobile digital (i.e. PC-based experiences).

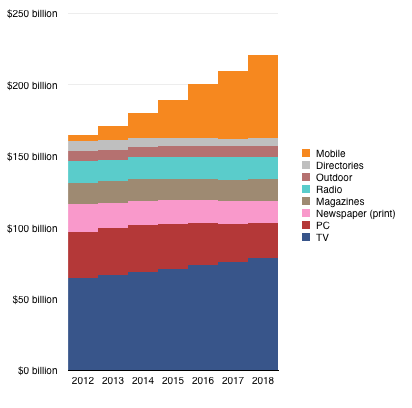
    However, if we look at the absolute spending forecast the picture shows that Mobile is responsible for most of the growth in the overall spending.
    Screen Shot 2014-07-02 at 7-2-8.13.10 PM

    In other words, Mobile is creating new consumption of ad spending. If the forecast is correct, it suggests that if Mobile was not an option, ad spending would probably remain flat.

    Mobile is capturing all the growth but it's also the creator of this growth. The reason for this is that people are consuming mobile (i.e. looking at their device screens) more without necessarily looking at other media much less. Mobile is effectively creating consumption and therefore competing effectively against non-consumption.

    Nielsen data backs this up by also citing that user "app time" on devices increased from 18 hours and 18 minutes per month in late 2011 to 30 hours and 15 minutes in late 2013.

    That's a lot of screen time which results in a lot more "inventory" of valuable ad space becoming available. Of course the ad buyers will buy the inventory. The value it provides is clear and they will increase their budgets to accommodate it. ((Note that the PC does suffer a decline in ad spending but it's not nearly as much ($8.5 billion drop) as Mobile's gain ($54 billion gain) ))

    Note that mobile phone makers did not set out to punish newsprint manufacturers. They did not set out to cause suffering for Canon or Nikon. They did not build devices to crush JVC and Pioneer or the myriad of music, photo, and print industry participants. They just wanted to make better phones.

    Because they focused on a job to be done that was not done well by alternative products they created consumption. They then used that additional consumption to expand into obvious adjacent use cases. The result was disruptive.

    There was no escape for the incumbents. The approach of making a camera into a phone would be doomed as would making an amplifier into an iPod. The outside entrant approach was the only way to "pivot" if such a pivot was even thought desirable.

    This is why non-consumption is such a difficult competitor to those in the business of serving consumers and a pushover for those in the business of doing something else altogether.
  2. Questions for Eddy Cue and Craig Federighi

    Research · 65 comments

    The Re/Code conference begins this week, and Apple executives Eddy Cue and Craig Federighi will be answering questions from Kara Swisher and Walt Mossberg.

    Here are some questions I hope they ask:

    For Eddy Cue:

    1. Why is there no app store for Apple TV? Even though the product is running essentially the same hardware and software as the iPhone and iPad and iPod touch and even though it connects to the iTunes stores, there is no option for developers to build apps for it or for consumers to use their TVs to run iOS apps. I might add that it’s been seven years since the platform launched and that’s a long time to wait.
    2. As Amazon has been granted a monopoly on the distribution of ebooks by the US federal government, why not compete by selling ebooks as apps? Apps were used as ebook containers well before the iBookstore launched and there were tens of thousands of “book apps”. Why not encourage authors and publishers to build apps by offering tools which make it easy to do so? I might add that if you do this for authors, why not do it for musicians and video producers? Why have separate stores for different media when they are all just content?
    3. YouTube is becoming the TV of choice for millions. Before it becomes that choice for billions, what are you doing to encourage user-generated video content distribution through your ecosystem?
    4. Apple’s Services revenues are growing remarkably quickly. The number of users is over 800 million. Do you see an opportunity for services to become a more independent business at Apple? In other words, why not bring iTunes to Android?

    For Craig Federighi:

    1. Marc Andreessen uses the phrase “Software is Eating the World” to describe the disruption that software-enabled businesses are having on those who don’t depend on software. You are the head of software at Apple; what’s on your plate? In other words, what do you see the opportunity for software at Apple beyond enabling device sales? I might add that although you are leading Software Engineering at Apple, Software and Services are part of Eddy’s organization. Does this separation make sense?
    2. It’s likely that iOS will be used by more people than Windows in the near future. What do you see as the obstacles to iOS replacing Windows for what most business users use daily?
    3. If you believe that iOS can replace Windows (at least in some tasks), do you think the iPad will ever replace the Mac?

    This was originally posted on LinkedIn on May 28th.

  3. Who Solved the Capitalist's Dilemma?

    Research · 14 comments

    In The Capitalist's Dilemma, Clayton Christensen and Derek van Bever introduce a powerful new theory which explains the relative paucity of growth in developed economies. They draw a causal relationship between the mis-application of capital in pursuit of innovation and the failure to grow. ((and, indirectly, in the increase in inequality and hence the destabilization of socio-political institutions))

    In particular, they observe that capital is allocated toward the type of innovations which increase efficiency or performance and not toward those which create markets (and hence long term growth and jobs.) This itself is caused by a prioritization and rewarding of performance ratios rather than cash flows and that itself is due  to a perversion of the purpose of the firm. ((That being the creation of customers not shareholder returns))

    For this statement of causality to be confirmed we need to observe whether it predicts measurable phenomena. For instance, we need to see whether companies which create markets apply capital toward market-creating innovations and whether companies which create value through efficiencies or performance improvements hoard abundant capital.

    Over the entire global economy, the pattern of capital over-abundance is easy to see. The amount of cash or securities on balance sheets is extraordinary and unprecedented (estimated at $7 Trillion, doubling over a decade). However, growing cash is not a perfect indicator of inactivity. Cash is the by-product of earnings after investment. So if operating profits are growing and investment is growing, but not as fast, then it's possible to grow cash while still growing investment.

    The better measure is investment in capital equipment or, more specifically, purchases of plant, property and equipment. ((Operating expenditures can also be measured but they cannot grow inorganically due to most of the costs being related to skilled employment which has supply constraints.)) Indeed, on a global scale, capital expenditure as a percent of sales is at a 22-year low.

    CapEx is a good proxy for non-financial "investment". It's also a measure that can be easily obtained as companies report this activity in their Cash Flow Statements.

    So the best method for assessing the theory's predictive power is to look at market creators and measure their investment in PP&E. At the same time we need to look at market sustainers and measure their (probable) lack of investment in PP&E.

    So here is my first attempt:

    Screen Shot 2014-05-27 at 5-27-3.25.43 PM

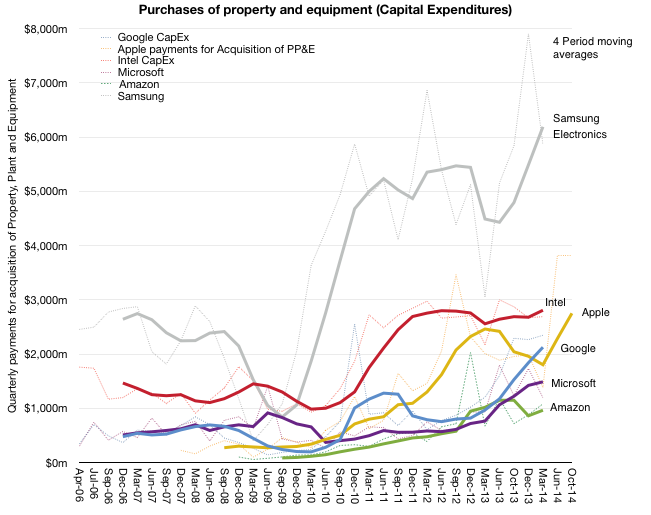
    It's an admittedly small sample of companies that are not that dissimilar. But within this group, over the time frame of about 9 years, we can see how capital expenditures are growing. ((Note that Apple's data extends to the end of their fiscal year and reflects their forecast given last October in the 10-K filing)) This sample shows that for a few companies, the amount spent on capital equipment grew dramatically. Especially since they are in businesses that might be thought of as not capital intensive.

    Consider Amazon: an Internet company if there ever was one. Their purchasing of capital equipment (in which they also classify software) went from 373 million in 2009 to $3.8 billion in last four quarters! The average spending was $84 million in the four quarters ending September 2009 and $964 million in the year ending March 2014. Amazon is investing in data centers and distribution centers and they are growing that asset base with an eye toward future growth.

    In contrast, consider Intel. Intel is in the most capital-intensive corner of the technology industry: semiconductors. They still manufacture their own so their investment in "fabs" continues. But Intel failed to create a market for mobile devices. The number of ARM processors shipped in 2013 was about 10 billion units while the number of Intel processors shipped was around 400 million.

    So despite being an innovator, Intel did not create a market. They still increased their CapEx but only by a factor of 2. Is this because Intel did not invest in market-creating innovations? Had they invested in market-creation, would they be increasing CapEx accordingly?

    Now look at Samsung. Samsung has grown CapEx by a similar factor to Intel (from pre-recession $2.5B/quarter to average of $5.5 during the last three years). Did Samsung create markets? Much of the expenditure went toward supplying components to itself and Apple (and others). In that regard, they did not create the market but filled it and optimized it.

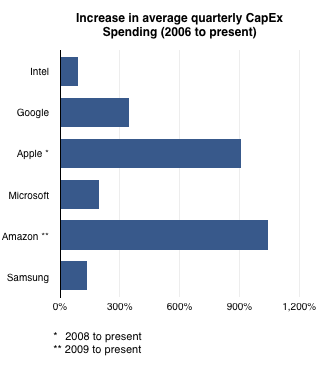
    Then there's Google. Google increased CapEx from an average of $476 million/quarter in 2006 to $2.125 billion in the last four quarters. That's an increase of 347%. Google spends almost all CapEx on data centers and we can see a pattern where CapEx growth anticipates service growth. However, the growth is not as pronounced as Amazon's.

    Microsoft also grew CapEx. Their investment mirrors that of Google: data centers. Microsoft increased from an average of $508 million/quarter (very similar to Google) in 2006 to $1.5 billion today. That increase is about 200%, slower than Google but in the same trend. Did Microsoft create a market since 2006? In terms of cloud computing and software as a services, yes. Their spending growth reflects infrastructure that supports a new business model.

    Finally there's Apple. In this time frame Apple did create the iPhone and iPad and their growth went from less than $200 million/quarter in CapEx to over $2.5 billion/quarter. The increase is nearly 10x over 25 quarters.

    To summarize, the following graph shows the increase in average quarterly spending (over a four quarter period) between 2006 and the present for these companies.

    Screen Shot 2014-05-27 at 5-27-3.10.40 PM

    The degree of "market creation" may be visible to the naked eye: Apple and Amazon did clearly create markets and they show highest CapEx growth while Intel and Samsung did not and they show the slowest CapEx growth. Google is continuing the expansion of a new market as is Microsoft and their CapEx growth is roughly proportional to these efforts.

    At least from this small sample the theory seems to hold. CapEx and market creation are at least correlated.  Much more analysis needs to be done, especially to discover the anomalies, but from the perspective of some of the most valuable and rapidly growing large companies, their commitment to capital expenditures is evident.


  4. Asymcar 13: Pilgrimages and Fundamental Evil

    Research

    IMG_8829

    On continental trips, diesel engines and autobahn speeds, pilgrimages to Porsche and BMW’s brand meccas.

    How to understand the world through toy cars, from Matchbox to Hot Wheels, Siku, Majorette to Tomica.

    On the business of car distribution, “channel stuffing” and the origins of state franchise regulation.

    Reflections on Apple’s routing around now-defunct computer retail channels via its highly successful stores.

    via Asymcar 13: Pilgrimages and Fundamental Evil | Asymcar.

  5. Teenager stores

    Research · 7 comments

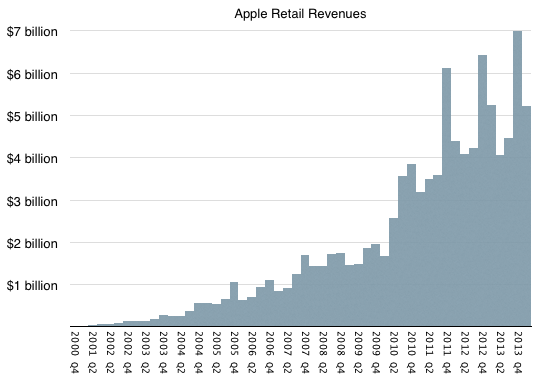
    The Apple stores are now 13 years old. ((The first store at Tysons Corner in  McLean, VA opened on May 19 2001)) In the first full year of operation (2002) the stores generated revenue of $282 million. In the last full year (2013) the revenues were $20.228 billion. Quarterly sales during the last seven years are shown below:

    Screen Shot 2014-05-20 at 5-20-11.16.21 AM

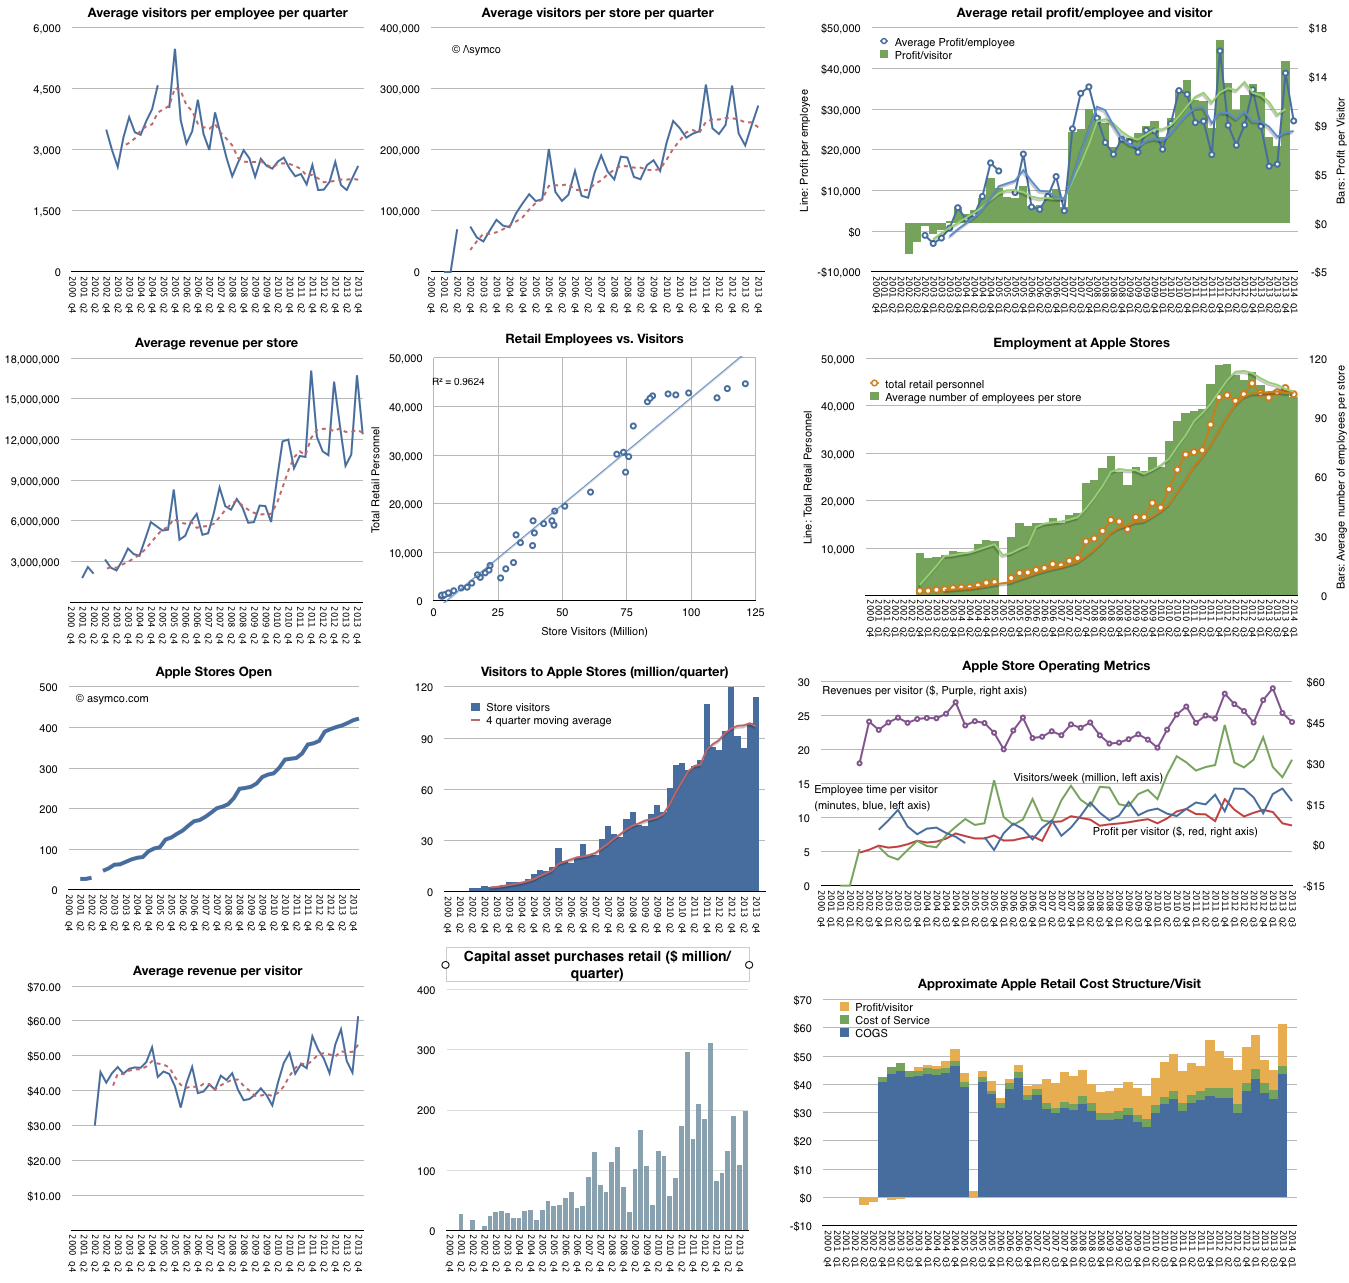
    Additional details regarding average visitors per employee per quarter, average visitors per store per quarter, average retail profit/employee and visitor, average revenue per store, employment and visits correlation, employment per store and in total, stores open over time, visitors over time, average revenue per visitor, capital asset purchases and estimated cost structure per visit are shown below:

    Screen Shot 2014-05-20 at 5-20-11.19.51 AM

    The Apple store concept has reached teenage years and it seems a good time to renew their character.

  6. Categorizing technologies

    Research · 79 comments

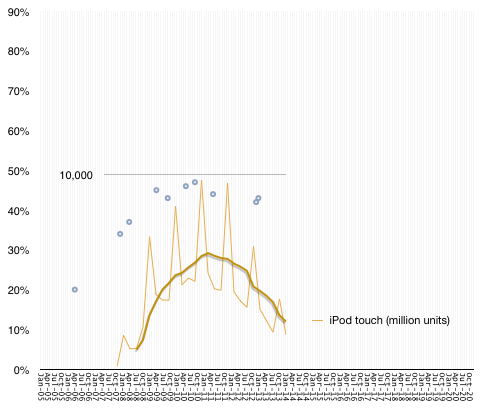
    In the graph below the grey circles represent the US penetration (percentage of households which own) MP3 players.

    Screen Shot 2014-05-19 at 5-19-7.55.22 PM

    Superimposed on this sparse sample graph is a line showing the sales of iPod touch. This second graph has a different scale, shown with a gridline at 10,000, representing millions of units shipped by Apple. To smooth out seasonality I show the trailing four quarter average with a thick line.

    The correlation is fairly evident. As iPod sales grew, penetration grew and "peak MP3" was recorded in September 2010 while peak sales occurred at the end of that year.

    It's not a stretch to say that iPod touch sales are causal to MP3 penetration, especially since the iPod has remained the market share leader in the segment for a long time (at least 70% share) and that the iPod touch is consistently half or more of the iPod.

    The absence of data for penetration beyond 2012 is therefore not a problem. We can assume that MP3 devices have a finite lifespan and, if not replaced, the penetration will decline.

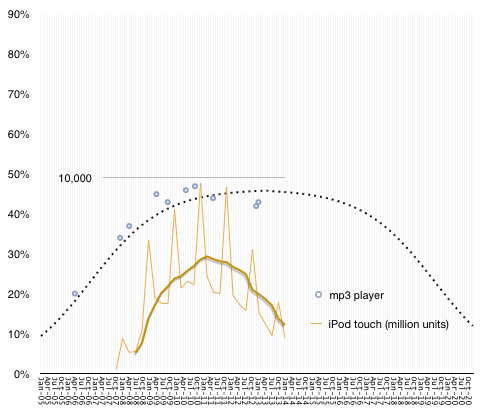
    I modeled both the increase and decline with a diffusion curve as follows:

    Screen Shot 2014-05-19 at 5-19-7.02.40 PM


    As longevity goes, this is quite generous but it's safe to say that fewer than 10% of US households will have a dedicated MP3 player by the end of the decade.

    MP3 players turn out to be a "ballistic technology". Their failure is two fold: first, they did not reach saturation, gaining popularity with only half of US households; second, they were substituted and thus went out of use. Note that I kept the graph's upper bound at 90%, suggesting the limitation of the device popularity.

    There are many technologies which are in this state: camcorders, pagers, VCRs, game consoles.

    On the other hand there are some technologies which prove to be both ubiquitous and resilient. I call these "perpetual technologies". Substitution may occur but it may take decades. Examples are stoves, autos, microwave ovens, refrigerators, radios, vacuum cleaners, TV, telephones (fixed wire and cellular).

    Yet another category exists where the technology does not quite reach ubiquity but is common enough that it's refused by only about 20% of the population. I call these "Inertial technologies". They also have relatively long periods of slower growth and similar lengths of decline, sometimes substituted by services rather than equivalent objects. The Examples are washing machines, the Internet, personal computers.

    Some technologies never reach mainstream use (below 10% penetration). I call these "dud technologies". These failures are very common and can be discerned easily. Examples include the Segway, Google Glass, SPOT watches, PDAs.

    So to summarize:

    • Dud technologies: Never reach 10% penetration, are money losers, do not create an industry.
    • Ballistic technologies: Reach between 30% and 70% penetration but are substituted quickly. They are profitable but only for the duration of their ascent. Generally do not create industries, ecosystems or network effects.
    • Inertial technologies: Have steady growth but never reach ubiquity. They are bound by frictions which impede their broad adoption but also impede their substitution. They do create industries and network effects but suffer from corrosion and monopoly.
    • Perpetual technologies: They reach ubiquity, usually quickly and remain there indefinitely. Substituted only by improvements which supersede performance (e.g. Color TV vs. B&W TV). Usually solve a universal problem everybody has. Create disruptive growth and have world-changing effects.

    Knowing in advance which category a technology will reach can be very valuable. Not only can investment be directed, but career decisions, education choices and fundamental research can be better allocated.

    The question is therefore how to tell early enough where an emergent technology fits in this categorization.

    I'll be discussing a methodology for doing this, the processes for creation and covering at least twenty case studies at the Postmodern Computing Summit in June in San Francisco.


  7. Think local, act global

    Research · 20 comments

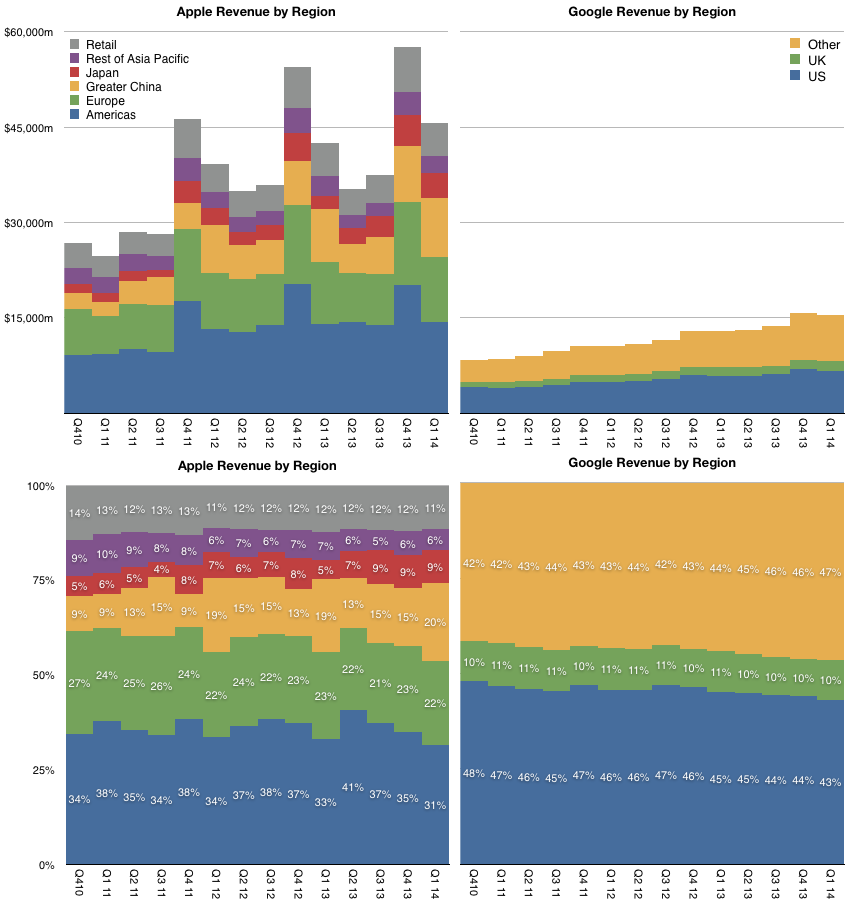
    Three years ago Apple's Greater China Q1 sales were $2.22 billion or 9% of total. This year they were $9.29 billion ((Including China retail, revenues reached "almost $10 billion")) or 20% of total. Over this time frame the growth in China was about 320%. The second fastest growing reporting segment was Japan with growth of 187%. Europe was third with 70% and Americas fourth with 53.5%. Rest of Asia/Pacific had the smallest increase of only 4.1%.

    A graph showing both the absolute and relative sales levels for the reporting regions is shown below.

    Screen Shot 2014-05-19 at 5-19-11.35.17 AM

    As overall sales have increased significantly, the revenues from the Americas and Retail combined (as most stores are in the US) ((60% of all Apple stores are in the US)) went from 51% in Q1 2011 to  42% in Q1 2014. The 11 point increase in share for China can be thus seen as mostly at the expense of the US. As Americas did not decline more appropriate statement would be that China captured much of the growth of the last three years.

    Note that I also included Google's revenue split ((Excludes discontinued operations, namely Motorola)) in the graph above. This is partly to calibrate Apple's mix and to understand if the expansion outside the US is mirrored by other companies.

    Google, in particular, is largely absent from the Chinese market and the only regional detail we have for their revenues is the US, UK and Other. That leaves an analysis of the dependency of each company on the US market.

    Google's US revenue percentage did drop from 47% to 43% but it's worth noting that not only is the drop slower than Apple's, the overall dependency of Google on the US for revenues is higher than Apple's.

    A surprising observation as Apple's concentration of users, measured as market share for various products, is likely to be higher in the US than Google's distribution of users.

    Put another way, Google is broadly popular world-wide (except for search in China, Korea and Russia) but its customers and hence profitability are highly concentrated.

  8. Measuring Not Getting the Cloud

    Research · 137 comments

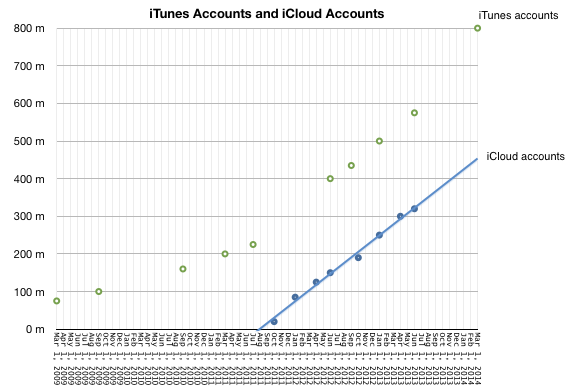
    This is what "Not getting the Cloud" looks like:

    Screen Shot 2014-05-09 at 5-9-3.30.03 PM
    Screen Shot 2014-05-09 at 5-9-4.04.33 PM


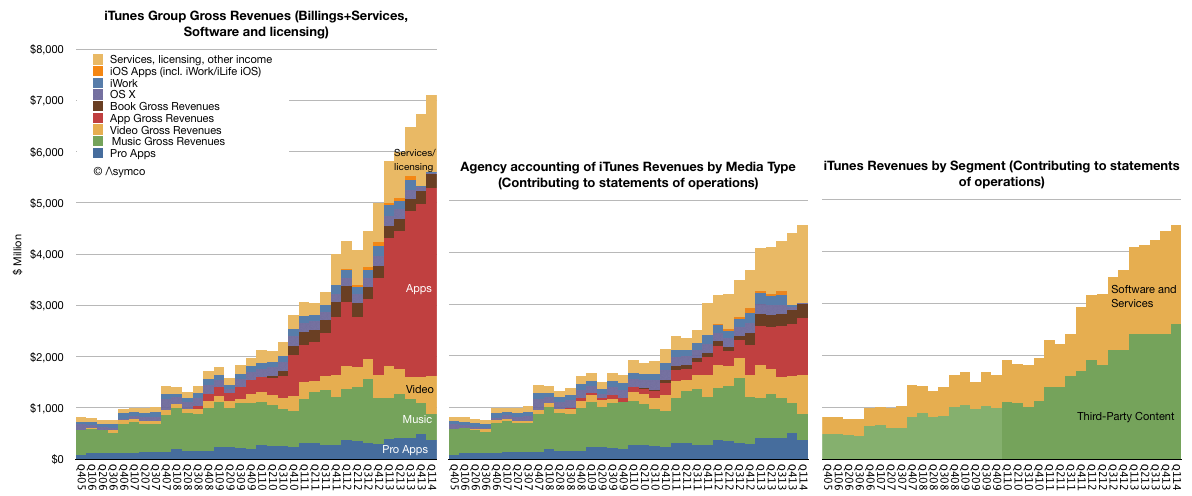
    "Not getting the cloud" means that in the last 12 months Apple obtained:

    • 800 million iTunes users and
    • an estimated 450 million iCloud users spending
    • $3 billion/yr for end-user services plus
    • $4.7 billion/yr for licensing and other income which includes
    • more than $1 billion/yr paid by Google for traffic through Apple devices and
    • $13 billion/yr in app transactions of which
    • $9 billion/yr was paid to developers and
    • $3.9 billion/yr was retained as operating budget and profit for the App Store. In addition,
    • $2.7 billion/yr in music download sales and
    • more than $1 billion/yr in Apple TV (aka Apple's Kindle) and video sales and
    • $1 billion/yr in eBooks sold

    In summary, iTunes, Software and Services has been growing between 30% and 40% for four years and is on its way to $30 billion/yr in transactions and sales for 2014.

    This is what can be deduced from a reading of Apple's financial statements of operations. If there are comparable details for companies which do get the cloud, I'll be happy to tally the comparison so we can calibrate this failure.

  9. How close is the UK to smartphone saturation?

    Research · 23 comments

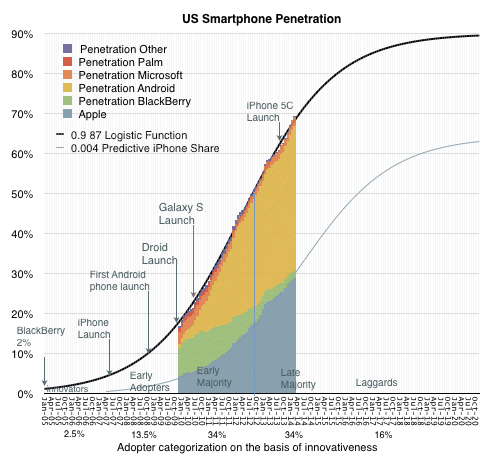
    In How close to saturation is the smartphone I highlighted that the US is not nearly saturated at 68.8% penetration at the end of March. Since the US is not the highest penetrated, one may wonder whether other "developed" countries are far further along.

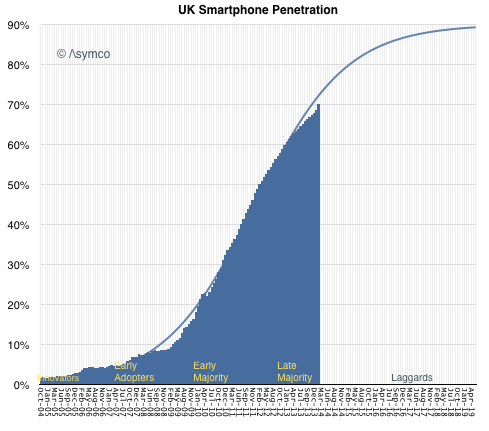
    There is no data on all the countries in the world on the same resolution as that in the US, but thanks to Charles Arthur, Kantar shared data on the UK and we can have a clear trajectory for that country.

    The most recent data for UK was as of February 2014 when penetration was 70%.

    Screen Shot 2014-05-08 at 5-8-6.31.48 PM

    In February the US figure was 68.2%, so the US is 1.8% behind in penetration. The equivalent picture of the US is below:

    Screen Shot 2014-05-08 at 5-8-6.34.23 PM

    Not a significant difference. Both markets are in the "late majority" phase of growth and well before the lagging adopters join.

    Note that I took a crack at forecasting both the US and the UK penetration given the significant amount of data we have so far. The asymptotic penetration value I chose was 90%. If the pattern holds then there is growth in both markets (and by proxy the developed world) well into 2018.