Asymco

Asymmetric Intelligence

Horace Dediu

  1. When Apple reached parity with Windows

    Research · 418 comments

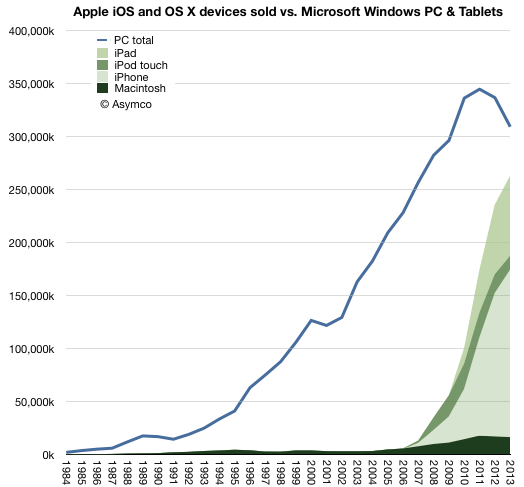
    In 2013 there were 18.8 times more Windows PCs sold than Macs. This is a reduction in the Windows advantage from about 19.8x in 2012. This decline is mostly due to the more rapid decline in Windows PC shipments relative to the more modest decline in Mac unit shipments. Gartner estimates that about 309 million Windows PCs were shipped, ((This figure is not published publicly but can be derived from subtracting Mac shipments from the total PC shipments which are published)) down from 337 million in 2012 (which was down from 344 million in 2011, the year PCs peaked.) I estimate about 16.4 million Macs were shipped in 2013 down from 17 million in 2012.

    The history of PC shipments relative to Mac shipments is shown in the following graph:
    Screen Shot 2014-01-13 at 1-13-3.09.21 PM

    I chose to graph the Mac data as an area with additional areas for iOS devices layered on top.

    When comparing these platforms, the contribution of the Apple mobile platform becomes striking.

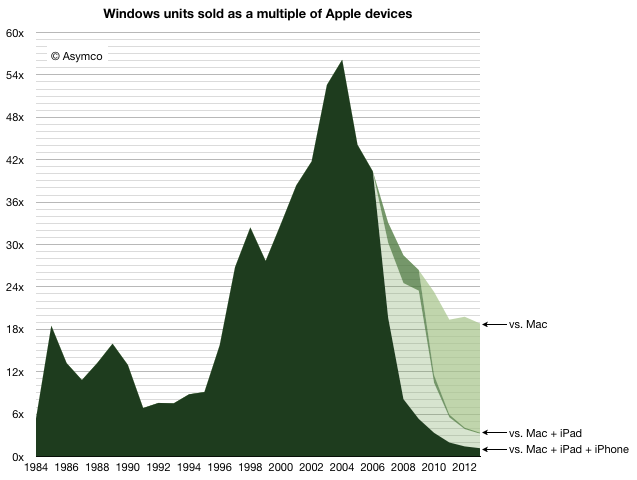
    Nevertheless, it's still important to understand the role of the Mac. In years gone, the advantage of Windows was measured in multiples of Mac sales. That peak occurred in 2004 when there were 56 times more PCs sold than Macs. At that moment, when the Windows advantage peaked, the Mac sold 3.2 million units  into a market where 182 million PCs shipped. This means the Mac had 1.7% market share.
    Screen Shot 2014-01-13 at 1-13-3.09.51 PM

    And yet, remarkably, even with 1.7% share, the Mac did not disappear. The figure of 3.2 million units was not great and below the peak to date ((which was 4.5 million in 1996)) but it was enough to sustain Apple while it developed its next products. At the time the iPod was starting to grow rapidly and development on iPhone/iPad was already underway. The point being that there were new products. 3.2 million was a sufficient volume to preserve the company until such time when they would be ready.

    Today the situation is quite different. The total number of platform products Apple sold in 2013 was about 260 million ((This includes my estimates for Q4. We'll have the exact figure in a few days.)) The total number of users Apple has is above 550 million. ((Possibly 600 million.))

    Note the effect in the graph above. Even if we only consider the Mac, the Windows advantage has decreased considerably, and the platform was certainly not extinguished. The new form factor Mac Pro and the continuing improvements in the thinnest of laptops shows how Mac has not just survived but prospered as the underdog which easily captures the bulk of profits.

    But the bigger story is how Apple's mobile platform has nearly reached the sales volume of Windows. In 2013 there were only 1.18 more Windows PCs than Apple devices sold. Odds are that in 2014 they will be at parity. ((The prediction I made in 2012 was that "it’s safe to expect a “parity” of iOS+OS X vs. Windows within one or two years". The data so far does not change this expectation.))

    But will it last?

    It's important to understand just how the quantities involved here have a quality of their own. The quantities themselves speak of a change. It's not convincing to suggest that what comes around goes around and a reversal of fortune can be reversed yet again when there are several zeros added to the end of the figures involved.

    We have to understand that the Windows advantage itself came from the way computing was purchased in the period of its ascent. In the 1980s and 1990s computing platform decisions were made first by companies then by developers and later by individuals who took their cues from what standards were already established. As these decisions created network effects, the cycle repeated and the majority platform strengthened.

    But it was the large companies who made the core decisions. In the 1980s if the Fortune 500 companies all standardized on Windows then their suppliers and customers would also standardize on it. Add governments and other institutions and 80% of the market is probably decided. There was concentration in decision making. In other words, in the 80s a platform could win by convincing 500 individuals who had the authority (as CIOs) to impose through fiat a standard on the centers of gravity of purchasing power.

    Today, with mobile products there are billions of decision makers. 500 decisions mean nothing. In fact, Apple with at least 500 million loyal and wealthy users is considered to be in a precarious situation. That's partly due to the way other platforms like BlackBerry and Symbian found themselves in crisis with tens of millions of users. ((and hundreds, perhaps thousands, of corporate buyers deciding to support its platform exclusively. What IT does matters for little.))

    The decision making process for buying computers, which began with large companies IT departments making decisions with multi-year horizons, has changed to billions of individuals making decisions with no horizons. Companies have become the laggards and individuals the early adopters of technology.

    The fundamental shift is therefore in the quantity of decision makers and the quality of those decisions. Those who buy are also those who use and their decisions will be perhaps whimsical, maybe impulsive and not calculated, but fundamentally, in the aggregate, wise.

    Ultimately, it was the removal of the intermediary between buyer and beneficiary which dissolved Microsoft's power over the purchase decision. It's not just unlikely that this situation will be reversed, it's impossible. Computing decision making has moved to the furthest edge where use has been for decades. The computer has become personal not just in the sense of how it's used but in the sense of how it's owned.
  2. Asymcar 9. Stasis: Depreciation, Brands, Information Intransigence

    Research · 4 comments

    Horace and Jim discuss shopping online for used cars and how and why the value of cars disappears so quickly. The conversation drifts into information asymmetry, the declining interest in auto maintenance and the perpetual closed-loop auto information model. We hypothesize on the impact of the coming self-monitoring and awareness of the lives of vehicles. Finally we ask whether the dysfunction in the industry is the cause or the effect of the ancient integrated factory model and the sustaining auto eco-system incentives that impede transformation.

    Asymcar 9. Stasis: Depreciation, Brands, Information Intransigence | Asymcar.

  3. Of bits and big bucks

    Research · 89 comments

    Exactly one year ago, on January 7th, 2013, Apple announced that the App Store reached 40 billion downloads ((Unique downloads excluding re-downloads and updated)). Here are additional data points from that release:

    • 20 billion downloads in 2012
    • 2 billion downloads in December 2012
    • 500 million active iTunes accounts
    • 775,000 apps
    • sold in 155 countries
    • 300,000 native iPad apps
    • over $7 billion in developer payments

    This year, on January 7th, 2014, Apple announced a new set of data points:

    • $10 billion spent on the App Store in 2013
    • $1 billion in December 2013
    • 3 billion app downloads in December 2013
    • 1,000,000 apps
    • sold in 155 countries
    • 500,000 native iPad apps
    • $15 billion in developer payments

    The obvious:

    1. 225,000 apps were added in 2013
    2. 200,000 native iPad apps added in 2013
    3. App download rate for December increased by 50%
    4. No new countries were added in 2013
    5. $8 billion was paid to developers in 2013 (more than in all previous years put together)

    The less obvious:

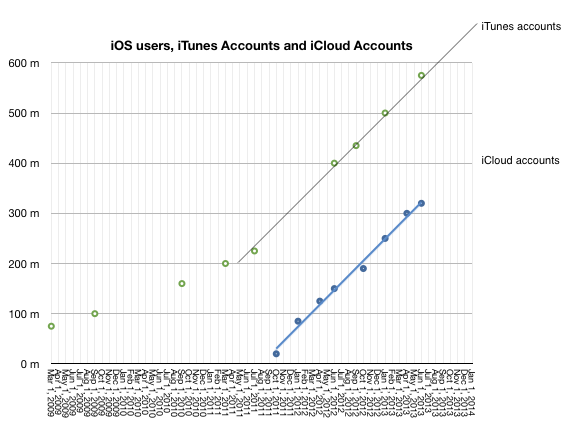
    1.  No update on iTunes accounts this time but there was a mid-year update (June 10th) which put iTunes accounts at 575 million. iTunes accounts have grown linearly since mid 2011 so it's quite probable that the current total is above 650 million. 
    Screen Shot 2014-01-08 at 1-8-9.28.41 AM
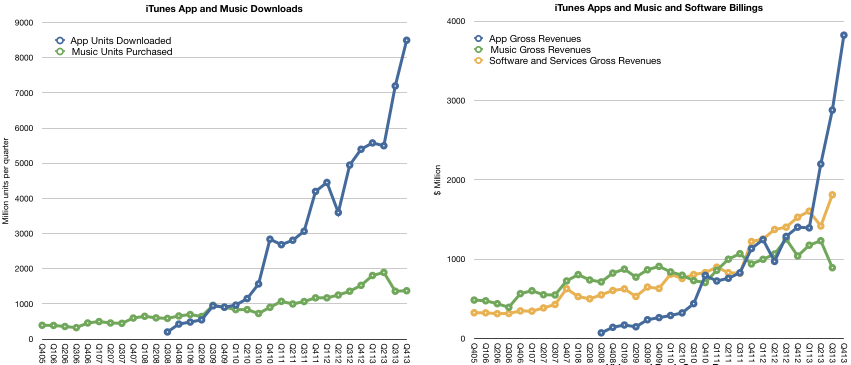
    1. Given mid-year updates to earnings/revenue and the October 22nd update that 60 billion total apps were downloaded and the May 15th update that 50 billion total apps were downloaded it's possible to estimate with confidence that there are now 68 billion total apps downloaded and that were about 27 billion app downloads in 2013. This is an increase of 35% in the yearly download rate. As noted above, the December growth alone was 50%.
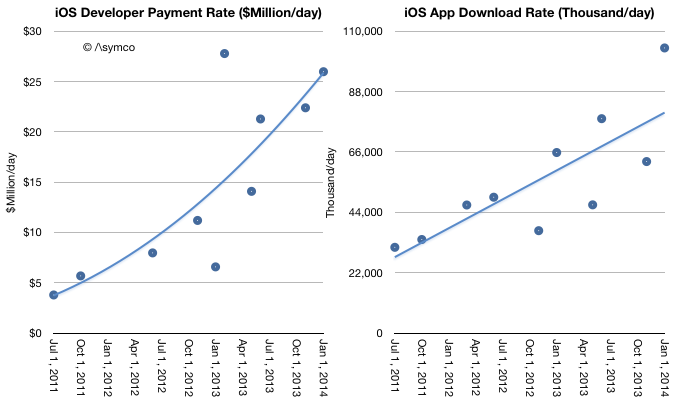
    2. Given mid-year updates on developer payments, and download rates we can estimate revenues per app have increased. As in-app purchasing has taken off it's no longer meaningful to assign a "purchase value" to each download. The rate of payments to developers is increasing faster than the download rate. Currently $26 million is paid out every day while about 100 million apps are downloaded daily. Note that the trend lines below are arbitrary: 
    Screen Shot 2014-01-08 at 1-8-9.41.18 AM
    1. As other reports have noted, there was a decrease in music downloads in 2013. This is also evident when backing into a download total for music given the earnings data and the above evidence of app growth. My estimates below may be overly generous for music unit downloads as they also assume lower pricing. Overall gross music revenues through the iTunes music store ((Excluding new iTunes radio and revenues from services such as Match)) are flat for the year and may even have begun declining precipitously. App revenues are more than compensating for this. 
    Screen Shot 2014-01-08 at 1-8-9.50.37 AM
    1. The iTunes content economy is grossing about $17.5 billion/yr. Apple's own software and services (reported as part of the iTunes segment) add another $6.2 billion/yr. The combined total of $23.7 billion/yr. is slightly lower than what Apple net sales were during its fiscal 2007 year or what Amazon sold in 2009.
    2. A complete report on the iTunes economy and pro-forma iTunes income statement is available for purchase at store.asymco.com.

    So much for the data. What is really happening?

    First, it's tempting to look at music and suggest that music downloads are suffering from streaming, just as it was tempting to suggest that CD buying was suffering from piracy (and later, downloads.) But this is falling into the trap of defining a product's use by the metrics used to measure transactions. These metrics are but a proxy for what consumers are actually doing with their time.

    Consumers have a fixed time budget, a more rigid constraint than their spending budget. Competition for a slice of a consumer's time budget is far tougher than competition for a slice of a consumer's wallet. So what's amazing is that apps have successfully grabbed a share of this time budget. I believe that the reason they succeeded is that they initially fit into niche time slices that were previously unoccupied. ((Interestingly, this was how music, especially digital music as enabled by the iPod, gained traction))

    Downtime or "boredom" was filled with app interaction. This includes some social media consumption. These are not immersive experiences. They are "casual",  inconsequential and trivial. At first anyway. And that's the rub. As apps enter a consumer's world they initially take on non-consumption, which is easy to beat. But as the experiences become increasingly compelling they "move upmarket" and compete more aggressively with existing media consumption patterns.

    For instance, one might allow casual gaming to take root in non-consuming contexts such as commuting, waiting, and escaping time niches. But if the experience becomes addictive, the gaming takes over time previously spent watching TV or using console games. The same can be observed for app-based experiences of social media, shopping and chatting.

    This is the insidious march of a disruptor. It gains a foothold in a context where it has no competition and then relentlessly gets better, eventually displacing the far better suited alternatives. This is what I believe is happening with apps. They are asymmetric in their competition with established media and as a result they are easily ignored and brushed off as irrelevant competition. That is until the incumbent media sees a sudden drop in consumption. Even then, the culprit blamed is not the upstart but some structural issue.

    Music would appear less vulnerable to this app-based substitution because it's an eyes-free experience and can be easily consumed concurrent with another activity. There is however, a subtle de-emphasis and hence devaluation of the experience as it fades into the background. The "job it's hired to do" changes.

    Second, and relatedly, the other meta-observation is that apps are media. They are produced, marketed and priced in ways analogous to other media types. This has implications for the artist/producer/creator. For them movement into apps is natural and effortless. It's how developers moved into them without thinking twice. Trouble is that this transition is not at all simple for those who distribute media.

    I tweeted that the media industry deplored the shift of "digital pennies for analog dollars" ((Original quote was made by Jeff Zucker, president of NBC Universal, in 2008 in reference to the future of TV)) as the packaging of their product changed. The angst and trauma suffered by the media industry when dealing with what could be seen as a trivial change in the encoding of content are the stuff of lore and legend. Moving to apps could be even more troubling. Mainly because there is already a distribution channel in place. And it's owned by a set of companies whose motives and business models are completely different.

    The app economy shows that there are big opportunities in "digital pennies" and that the figures are beginning to match even the "analog dollars". In fact, I suspect eventually digital pennies will dwarf analog dollars. The trouble is that these pennies will not be earned at the same control points. Bits are already big bucks. They're just not the bits we are used to.


  4. When will smartphones saturate?

    Research · 43 comments

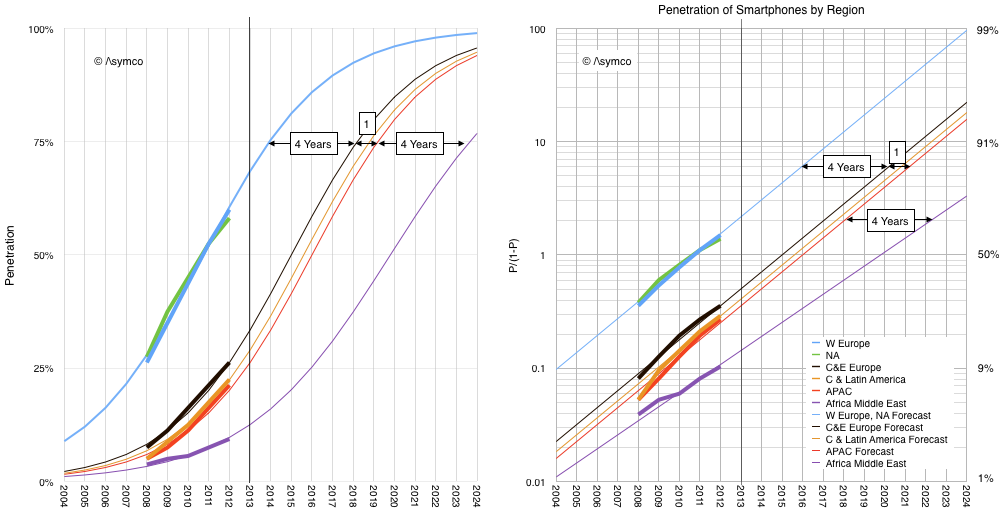
    GSMA Intelligence reports provide valuable statistics on the growth of mobile networks. One in particular shows the history of regional smartphone penetration.

    I took the historic data and plotted it as follows:

    Screen Shot 2014-01-07 at 1-7-1.43.56 PM

    Note that I chose to model using the same logistic function that I have used to describe the US market (as measured by comScore) and the global Internet user market (as measured by the ITU) and the stove, landline phone, Electricity, automobile, consumer radios, washing machines, refrigerators, TVs, dryers, air conditioning, dishwashers, microwaves, VCRs, PCs, cellphones.

    It's also the same model used to show the rise and fall of energy sources, canals, railroads, roads and air travel.

    If we believe that smartphones in parts other than US and Europe will behave the same way as all the other technologies listed above then the forecast penetration is likely to follow the thin lines in the graphs above. ((This is a big if, and, judging by their forecast, one which the GSMA Intelligence team seems not to believe will happen.))

    With the exception of Africa and Middle East, note that the primary difference between regions is not the rate of growth in penetration but rather the delay in adoption. I marked this delay as 4 years between US/EU and Central & Eastern Europe. An additional one year delay to Asia Pacific region and 4 years more to Africa/Middle East adoption.

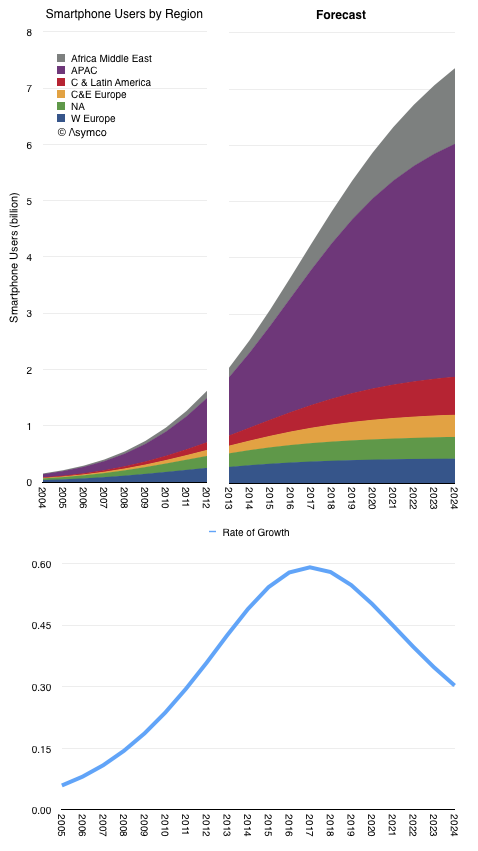
    The resulting smartphone user forecast is shown below.

    Screen Shot 2014-01-07 at 1-7-1.36.39 PM

    Although 2013 was often cited as the year when smartphones saturated ("everybody that wants one has one"), the total population of users will likely take another decade to reach maximum. The point of inflection in global growth could be expected in 2017.

    What most observers sensed was the point of inflection in growth in North America and Western Europe. Those regions are 11% of the world's population.

  5. On the future of the Internet and everything

    Research · 56 comments

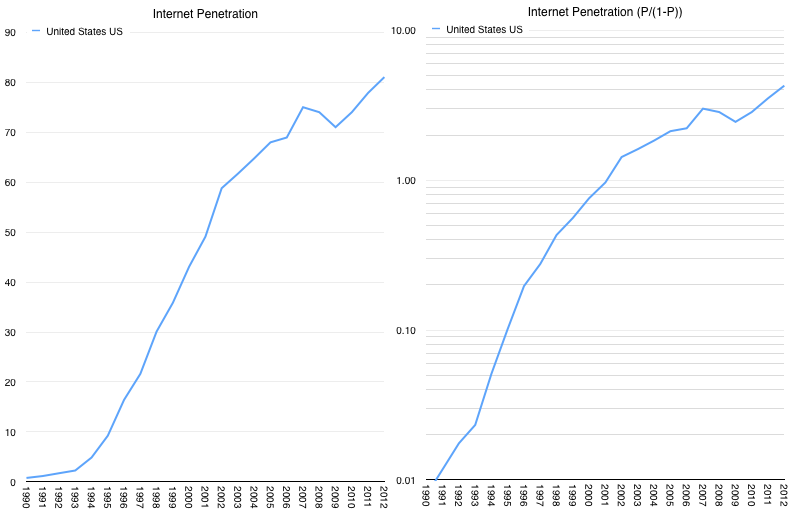
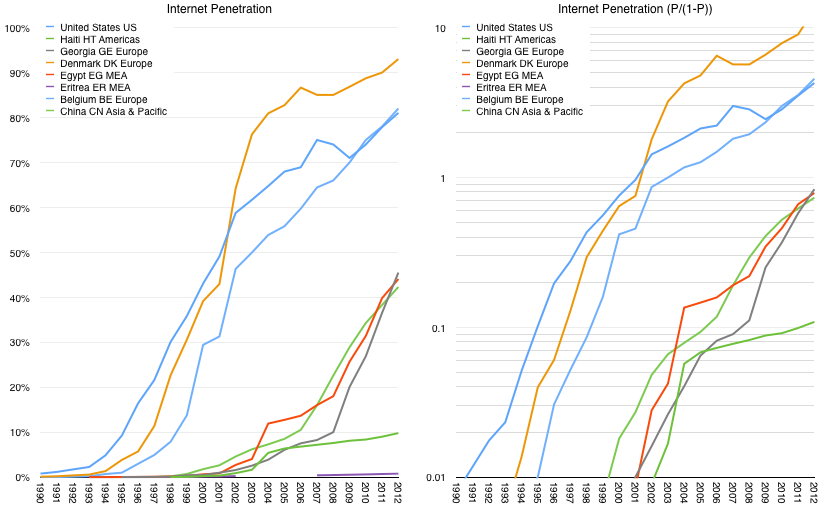
    According to ITU data, Internet usage reached about 2.2% penetration in the US (2.2 users per 100 residents) in 1993. The figure in 2012 was 81%. The history of penetration is shown in the following graphs.

    Screen Shot 2014-01-03 at 1-3-12.17.41 PM

    Similar graphs can be drawn for other countries (data is available for 193 countries/territories.) I chose the following set of countries arbitrarily:

    Screen Shot 2014-01-03 at 1-3-12.26.25 PM

    When looking at all countries, the patterns are fairly self-evident. They nearly all behave the same way with respect to the impulse to move online. The pattern is approximately logistic (observed as linearity in the right-side graphs). ((Those that don't are anomalies which should be inspected individually and might provide insights into the constraints for systemic state health.)) The main difference is one of timing.

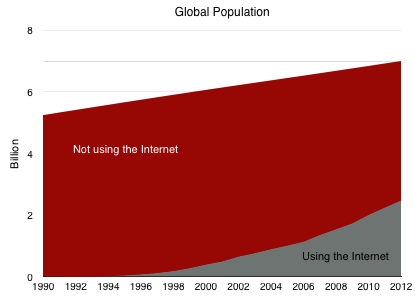
    The global picture should therefore not be surprising. In absolute terms, the penetration was 35% at the end of 2012 or 2.5 billion individuals. The graph of global population divided into Internet consumers and Internet non-consumers is shown below followed by penetration.

    Screen Shot 2014-01-02 at 1-2-3.44.11 PM
    Screen Shot 2014-01-03 at 1-3-12.55.17 PM

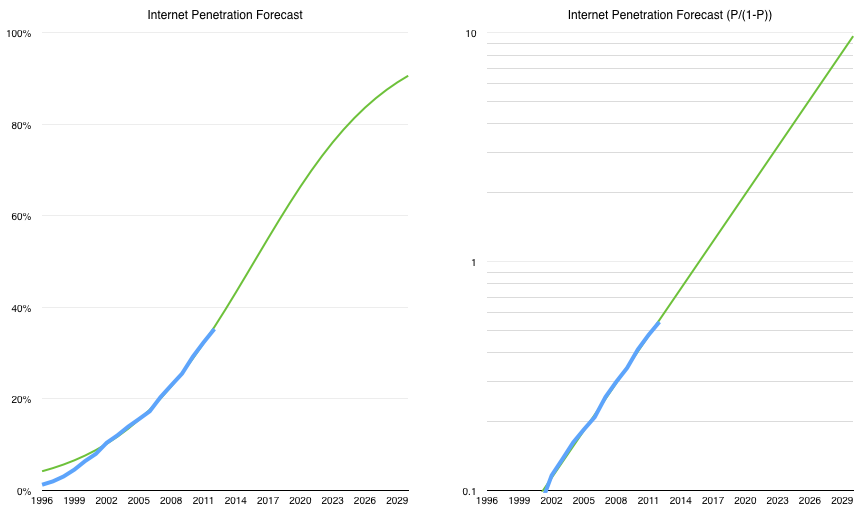
    The linearity in the blue line above is consistent after 9% penetration is reached (P/(1-P) ~= 0.1) suggesting logistic growth (far more smoothly than individual country data). Note that I also took the step of projecting the logistic curve that describes the internet's growth forward a few years.

    Based on this history, it becomes possible to project that 2013 penetration reached around 39% or 2.78 billion individual users.

    It also suggests that "saturation" could come between 2030 and 2035. ((The curve is defined as having a half-period of 19.7 years from 1996))

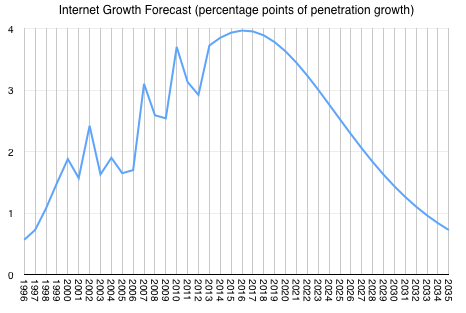
    If we look at growth, ((Derivative of logistic curve)) the inflection point comes in 2016. Thereafter internet user growth will slow.

    Screen Shot 2014-01-03 at 1-3-8.33.34 PM

    Overall, the growth pulse of the Internet will be approximately 40 years long. ((More likely 35 years as saturation dynamics will be erratic.)) We are therefore nearly half-way through.

    It might seem an interesting but benign fact, however I must caution that as we've seen with smartphones, once the point of inflection is reached, investors tend to flee the sector. That in itself may not be a bad thing but investment flight has deep effects on "ecosystem" participants.

    Venture investments tend to feed entrants disproportionately and they are remarkably sensitive to the valuations of public companies (and IPOs). These investment might therefore be in danger in two years. Plan accordingly.

  6. The China Mobile iPhone MOQ

    Research · 38 comments

    "BEIJING and CUPERTINO, California—December 22, 2013—Apple® and China Mobile today announced they have entered into a multi-year agreement to bring iPhone® to the world's largest mobile network. As part of the agreement, iPhone 5s and iPhone 5c will be available from China Mobile's expansive network of retail stores as well as Apple retail stores across mainland China beginning on Friday, January 17, 2014.

    China Mobile & Apple Bring iPhone to China Mobile’s 4G & 3G Networks on January 17, 2014 - Yahoo Finance

    January 17 seems to be an auspicious date. ((January 17 is a lucky day in Chinese numerology: 1+7=8 is a multiple of number 8, which is the most auspicious number.  Joe Zou @zzbar via Twitter))

    Precisely a year prior to that date, on January 17, 2013, I wrote The iPhone MOQ.

    Within that post I showed the activation rates for US operators as a percent of total users. Figures ranged from 10% to 19% by year or operators. I further assumed the figures would be toward the high end of that in Japan based on statements by the president of NTT DoCoMo.

    The last phrase I used was:

    "The MOQ figure as percent of subs for China Mobile would also be an interesting point of debate."

    My assumption would be that CM would start at a base significantly lower than the US or Japan. I would not be surprised to see an MOQ of 4% of user base for 2014. In the press release above China Mobile states that they serve 760 million customers. That implies a minimum order of about 30 million iPhones.

    In the absence of any other data it's best to be conservative.

  7. Airshow 2014 World Tour: Coming to a City Near You

    Conference · 3 comments

    Screen Shot 2013-12-19 at 12-19-3.48.45 PM

    In a world where everyone needs to present, few know the power that lies under their fingertips.

    Whether one-on-one or in front of millions on TV, presentations are the primary means of persuasion in business.

    Have you ever cringed at text-only slides or puzzled over graphs that made no sense? Steve Jobs saw "PowerPoints" as "rambling and nonsensical" and had them banned internally. But he used visuals for all his keynotes. What made them tolerable, even persuasive?

    The problem is that most people receive no training in how to compose the most crucial images they project to an audience and the tools available do not take advantage of motion, touch, processing power, mobility and high resolutions.

    • Airshow teaches principles of visual persuasion using techniques of cinematography and visual storytelling.
    • Airshow shows how tablets create a new stage for your performance.
    • Airshow applies Aristotelian rhetoric, Cinematographic theory and Cinematic storytelling as well as Tufte design principles into a new medium.

    You’ll learn how to:

    • Persuade with logic, empathy and credibility.
    • Present rich data as compelling and emotionally engaging
    • Get hands-on experience with modern tools of persuasion including tablets and interactive, touch-based interfaces.

    You have the data. You have the audience. All you need is a story and a screenplay. How do you build them?

    There are techniques which are proven to work. They’ve been used by writers, performers and playwrights for centuries. Professional presentation coaches will teach you far less and at greater expense.

    • Airshow is better and less expensive, especially in terms of time.
    • Airshow is an intimate experience. Audience size is limited.
    • All the tools and techniques needed in one day of intense, inspirational and engaging training.

    Airshow could be coming to a town near you but to make it happen you need to act now.

    Here's how it works: For every month in 2014 an Airshow event will be hosted. The location for that month will be locked-in when the first 20 registrations for that city will be recorded. Any registrations that take place before the location is locked-in will be half-price.

    In other words, early registration means you get half off! ((If your registration is not part of a quorum (fewer than 20 total) then it's automatically re-issued for the following month. You may also request a refund.))

    Now is the time to learn presentation skills for the post-PC era. Just like there is no writing which does a movie justice, I can't write here how it's done, you have to see it live.

    Register now.

    HERE'S WHAT PEOPLE SAY ABOUT AIRSHOW

    “Airshow was amazing. Business stories with cinematic impact made easy with perspective”
    — Paul Brody, Global Business Leader, IBM

    “Airshow has fundamentally changed how I give client and industry presentations. It is an important tool in my toolbox which allows me to showcase my data and my story in ways that help audiences gain deeper insight and perspective.”
    — Ben Bajarin, TIME, TabTimes, Techpinions

    “Nobody brings numbers to life like Horace Dediu does.”
    —Philip Elmer-DeWitt, Fortune/CNN

    “The unhurried nature of Airshow is just terrific and in contrast to many other events. Anyone who goes will gain their own purposes.”
    —Steve Crandall

    “Airshow is a treat [...] showing how to make the audience wonder.”
    —Bertram Gugel

    “Airshow is surpassing my expectations. Very interesting deep content.”
    —Ryan Singer, 37signals.

  8. Moonshot

    Research · 63 comments

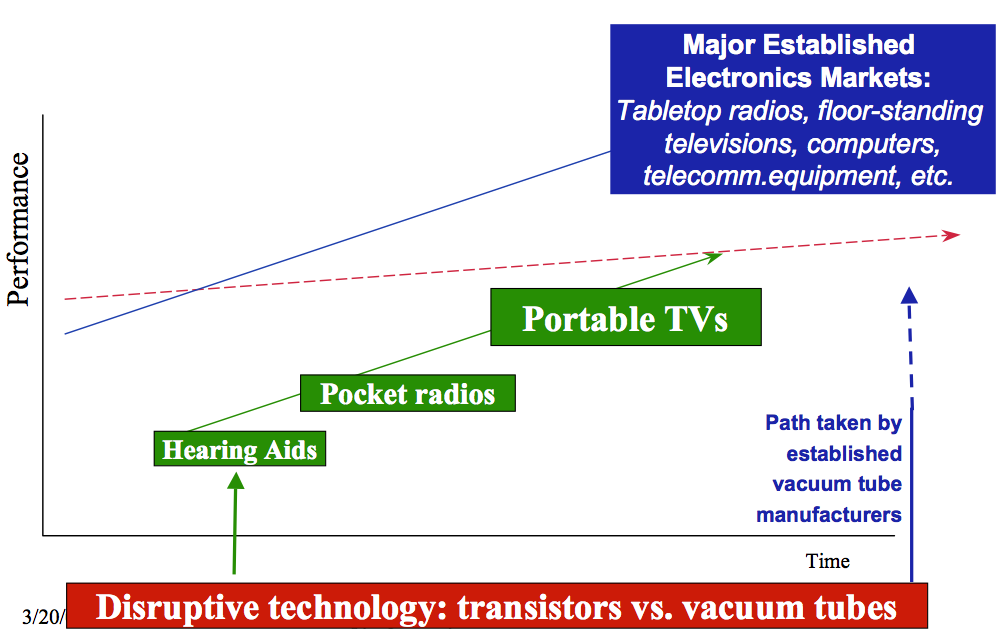
    When describing the process of disruptive innovation, Clay Christensen set about to also describe the process by which a technology is developed by visionaries in a commercially unsuccessful way. He called it cramming.

    Cramming is a process of trying to make a not-yet-good-enough technology great without allowing it to be bad. In other words, it's taking an ambitious goal and aiming at it with vast resources of time and money without allowing the mundane trial and error experimentation in business models.

    To illustrate cramming I borrowed his story of how the transistor was embraced by incumbents in the US vs. entrants in Japan and how that led to the downfall of the US consumer electronics industry.

    Small upstarts were able to take the invention, wrap a new business model around it that motivated the current players to ignore or flee their entry. They thus successfully displaced the entrenched incumbents even though the incumbents were investing heavily in the technology and the entrants weren’t.

    In the image below, the blue "path taken by established vacuum tube manufacturers" is the cramming approach vs. the green entry by outsiders who worked on minor new products which could make use of the rough state of transistors at their early stages of development.

    Screen Shot 2013-12-17 at 12-17-3.04.59 PM

    The history of investment in transistor-based electronics shows how following the money (i.e. R&D) did not lead to value creation, quite the opposite. There are many such examples: The billions spent on R&D by Microsoft did not help them build a mobile future and the billions spent on R&D by Nokia did not help them build a computing future.

    There are other white elephant stories such as IBM's investment in speech recognition to replace word processing, the Japanese government spending on "Fifth Generation Computing" and almost all research into machine translation and learning from the 1960s to the present.

    But today we hear about initiatives such as package delivery drones and driverless cars and robots and Hyperloops and are hopeful. Perhaps under the guiding vision of the wisest, most benevolent business wizards, breakthrough technologies and new infrastructures can finally be realized and we can gain the growth and wealth that we deserve but are so sorely lacking.

    But the failure of crammed technologies isn't rooted in a lack of wisdom. It was the wisest of minds which foresaw machine learning, advanced computing, mobility and convergence coming decades before they came. It was their wisdom which convinced others that resources should be spent on these initiatives. And it was the concentrated mind power of thousands of scientists which spent hundreds of billions in academic and government research.

    What failed wasn't the vision but the timing and the absence of a refinement process. Technologies which succeed commercially are not "moonshots." ((It could be said that the space and nuclear weapons programs during the Cold War were the original "moonshots" and they succeeded. But although successful in their goals, those goals were not commercial value creation and we are left with little to show for it. See also Concorde.)) They come from a grinding, laborious process of iteration and discovery long after the technology is invented.

    The technology is one part of the problem to be solved, the other is how to get people to use it. And that problem is rooted in understanding the jobs people have to get done and how the technology can be used defensibly. That's where the rub is. An unused technology is a tragic failure. Not just because it has no value but because the resources (those beautiful minds) used in making it could have been applied elsewhere.

    Building usage means imparting and retrieving learning through a conversation with the customer. That conversation is best spoken with a vocabulary of sales and profits. Without profits the value is unclear. Nothing is proven. Without economic performance data, the decision of resource allocation becomes a battle of egos. ((This is how most research is allocated today.)) The decision may be right but going by past history the odds are low.

    Incidentally, timing is the other element that is key to success. It might seem that timing really is a matter of luck. But timing can be informed by the same conversation with the customer. As you observe adoption you can also measure how long it take for a technology to be adopted. You can do A/B tests and see what is faster.

    The most reliable method of breakthrough creation is not the moonshot but a learning process that involves steady iteration. Small but profitable wins.  A driver-less car might be achieved but first a driver-assisting car might teach the right lessons. An electric car might be achieved but first a hybrid car might teach the lessons needed. A delivery drone might be achieved but first a programmable UPS truck might be a better way to learn.

    And finally, Android (née Linux) in 2005 might have been foreseen as the future of mobile operating systems but it took the learning from iOS to shape it into a consumer-friendly product. Even when you see a moonshot work, you realize that a lot of learning had to have taken place. It's like the story of an overnight success that took a lifetime of perseverance.

  9. Bundling and Pricing Innovation

    Research · 84 comments

    This was initially posted on LinkedIn December 16, 2013.

    Innovation comes in many forms. Many times innovation is thought of as technological improvement or as invention. We can all cite examples of inventions which turned into industries which re-defined civilization. The steam engine comes to mind but there were many others before and after. Inventing something is certainly a way to create value but it's not as common or as reliable a method as it might seem. Creating Intellectual Property is one thing, finding a defensible market and business model is quite another.

    More often companies innovate in terms of processes or the "algorithms" which are used to deploy existing resources. Wal*Mart was immensely innovative in the way it organized itself and laid out a low-cost business model. More recently Amazon has innovated in distribution and fulfillment based on the ability to dispense with showrooms for products and sell directly online. There is little in terms of technology which Amazon "invented". Rather, it deployed off-the-shelf technology in a novel way.

    But what I want to address is a more mundane sort of innovation: marketing innovation, specifically pricing. Few would consider a price model to be an innovation but in fact it's a core lynchpin to many breakthrough innovations. It was pricing which permitted Henry Ford to build an industrial empire. He could have built cars for those who could afford them as cars were defined in 1907 but he chose to build a car around a price point which was around the median of the population. A car "so low in price that no man making a good salary will be unable to own one." His business logic began with a price and the product and process followed.

    Another aspect of pricing innovation is "bundling" where products which might sell poorly independent of each other sell very well when coupled with complements. Consider the original Microsoft Office. When introduced vis-a-vis Lotus 1-2-3 and WordPerfect as separate products, it handily won the market for spreadsheets and word processors. Bundling is also the way TV is sold. Cable companies don't offer channels a-la-carte. It even took root in the car business. Automakers are now selling upgrades as "equipment packages", a method proving far more popular (and profitable) than the menu system of old.

    But there are cases where bundling has been rejected by users. iTunes broke the bundle of the "Album" where the only way you could get a single was to buy a dozen other songs. Once broken, the album bundle shows no signs of a come-back. Many are questioning whether TV channel bundling is also ripe for such a break-up.

    And there is yet another looming bundle question. For as long as the market existed, mobile carriers sold their service bundled with a device. This harks back to the days when AT&T (known then as the Bell Network) did not permit users to own their own landline phone. They argued that the device is a part of the network and choice in the matter would compromise security and safety of a crucial infrastructure. The argument played well with regulators for decades.

    This tie between the device and the service persists today but the connection has been preserved not though regulatory fiat but through incentives in pricing. Arguably, the low price of devices, and hence cost of entry, has meant that penetration skyrocketed. Cellular service now reached saturation in the US in near-record time. The upgrading to smartphones is now about 60% complete and looks to saturate a mere 8 years after reaching 10% of the population.

    So in a way, the "innovation" of the carriers has been in bundling and creating a package that was irresistible to consumers. They went from not consuming mobile networks to consuming them universally. The amount being spent by consumers on mobile services is above $1.3 trillion world-wide--a market that did not even exist 20 years ago.

    So now the question being asked, even within the industry, is whether this bundling can long last. The way I would answer the question is by following the logic from the consumer's point of view. If the bundle is valuable, then it's likely it will be tolerated, even preferred. In the case of software and car options the model works. Even in the case of TV the model is still preferred as few consumers are defecting to the IP-based unbundled alternatives. In the case of music, the consumers prefer the unbundling because there were things in the bundle which they did not need or want. They wanted a song, not a song and others which they might like.

    But in the case of network service and device, the split is more subtle. A service is useless without a device and a device is useless without a service. The bundle makes sense from the point of view of co-dependency of modules. The broader question is one of choice. The premise of unbundling might be that users can choose service and devices separately and change them arbitrarily.

    There is a fundamental problem with this however. A service that can be switched on or off easily by consumers is economically challenging for network operators. The economics of networks are such that financing them requires steady cash flow and every operator desires stability. So incentives will be put in place for consumers to stick around, and these incentives (read innovations) work. But isn't the device itself such an incentive?

    We end up back where we started. The business model and economics of operators world-wide is such that the device is a critical part of the incentive structure which preserves the network's economic balance.

    It may be an illusion, but a cheap phone (with a long-term contract) is a fundamental innovation devised by telco operators even before the phone became mobile. Operators have come to love it and no matter how many technology generations go by; how many family plans, bucket plans, weekend minutes, rollovers, and data packages; no matter how many tweaks and re-brands the model gets, it will persist. There simply isn't sufficient win-win value in alternatives.