Fresh off of back-to-back AirShows, Horace discusses the future of his "cinematographic" presentation style and announces Airshow World Tour. We also look at episode #103's prescient prediction of Amazon's move into delivering their own products.
If you want to know more about Toyota's secret sauce, why GM could not make an electric vehicle and how decisions are made in the auto industry then you should listen.
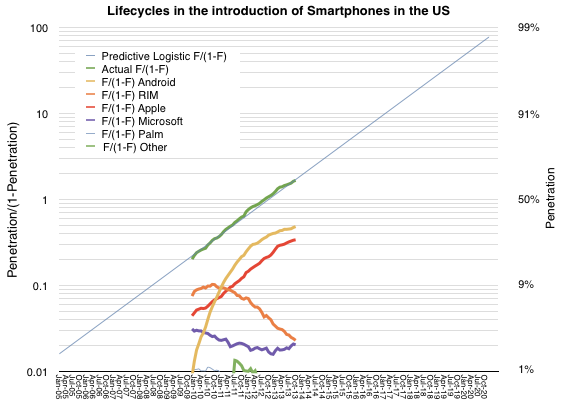
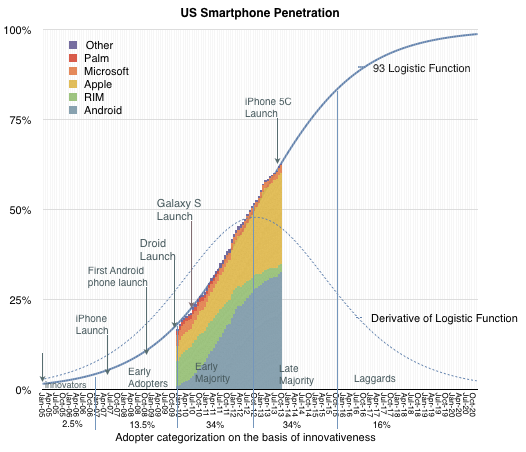
As previously noted, the US smartphone market has followed an almost perfectly logistic growth. The measured data (via comScore, in green below) follows a predictive logistic function (thin blue whose formula is discussed here).
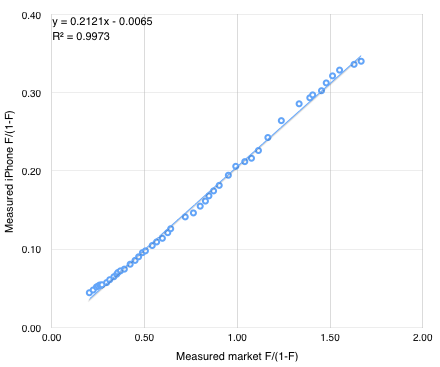
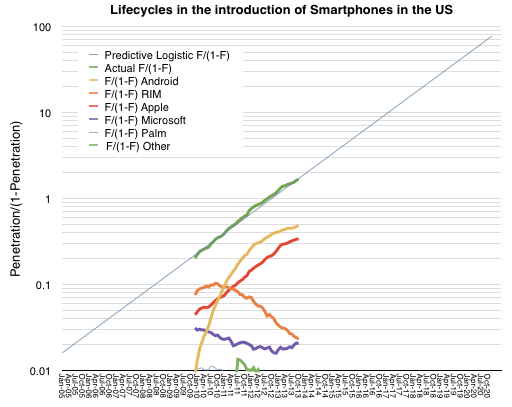
The other notable market observation is how closely the iPhone follows the same pattern as the market. The red line representing the iPhone above is almost perfectly parallel to the green and blue lines which represent the overall market. The reason for this seems to be that consumers are absorbing the product in similar way to how they are absorbing the technology. ((Note that this pattern of adoption has happened even though the product has been at least partially unavailable to the entire market until quite recently.)) The "learning model" which underpins logistic models could offer clues as to the cause. It suggests that there is a direct communication that happens between the product and the consumer.
Incidentally, the reason other platforms do not follow this pattern is that they are not communicating value with the consumer but with manufacturers or distributors of the product. These alternative communications could create faster or slower growth than the overall market as they are not subject to the same large population imitation/learning models.
If we believe that the iPhone can be modeled behaviorally then it may be possible to forecast its growth. One can simply draw a line extending the existing red segment above and read the F/(1-F) figure at any point in time. Solving for F results in a measure of penetration and hence number of users (if population is known.)
An alternative is to use the following formula derived from the linear interpolation of the two measured market shares. iPhone market share is y/(1+y) where y=0.21x and x = F/(1-F) and F is the expected market penetration of smartphones.
So if F = 91%, x = 10, y = 2.11 and therefore the iPhone market share = 68%.
We also know from the plot of the market that F = .91 is reached around February 2017. So we can suggest that at 90% penetration (approximately saturation) the iPhone will have 68% market share of users in the US. Forecasting the addressable market (US population aged older than 13) at about 266 million that implies 180 million US users of the iPhone by early 2017.
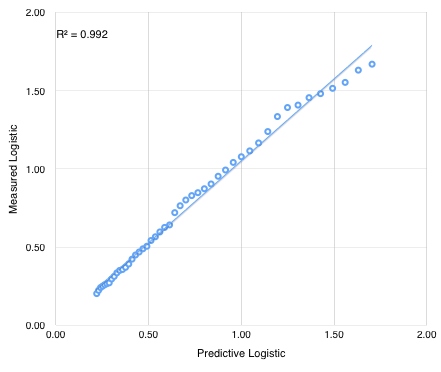
The latest comScore US smartphone survey showing three months' ending October data has been released and there were no surprises. Smartphone penetration grew to 62.5% representing 149.2 million users. I made a slight adjustment to the predictive logistic function parameters (p1 = 93, p2 = 22.5).
The correlation between predictive and actual logistic function (P/(1-P)) is shown below.
90% penetration (P/(1-P) = 9.23) is now expected by December 2016 when about 230 million users will be using smartphones in the US.
Individual platforms adoption curves are shown as colored areas above and as lines on a logistic plot below:
The parallel behavior of iPhone and the overall market remains unchanged.
A history of retail as a series of innovations in transportation. How to think about Amazon in a continuum of changing consumer behavior. The source of Amazon's market power and its hypothetical disruption. What would Amazon do and not do to improve its business.
A history of Cinema as seen through disruptive lenses. How did the medium evolve from novelty to experimentation to establishment of a predominant business model to concentration of power, regulation and ultimate stagnation. How to measure "performance" of a medium via the median age of the audience and how that affects the advertiser's calculus.
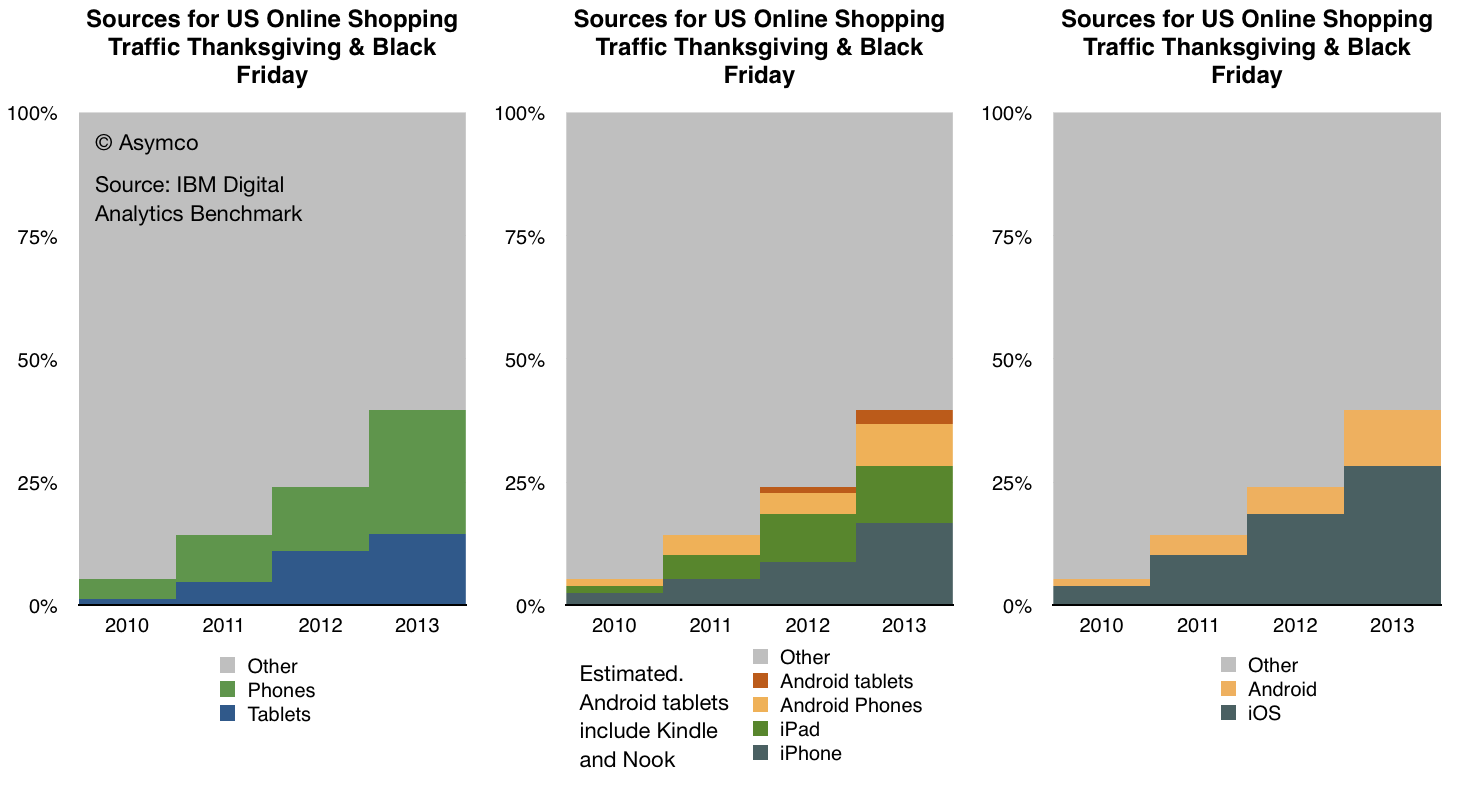
IBM Digital Analytics Benchmark (report is here) has published, for the fourth year in a row, US online shopping traffic data with a split between mobile and fixed online traffic. It reveals a pattern of consumer behavior which is quite startling: people seem to prefer to shop using mobile devices.
The data is shown below:
In terms of sources of traffic, mobile devices (including tablets) have increased from about 5% of all online traffic to 40% in four years. Last year the volume was 24% implying that 16 points of share were gained in one year. If that is extrapolated to next year then more than half of holiday shopping traffic in 2014 will be on mobile devices.
Put another way, next year less than half of users will hire a PC for the job of online shopping.
If this conversion from PC-based shopping to device-based shopping follows a logistic substitution curve then the conversion to devices will probably be 90% complete in another 5 years or by 2018 or 2019. I see no reason why this particular job to be done (shopping) should not be considered a proxy for other jobs as well. Therefore it's not a stretch to imagine that the transition to post-PC consumption will also be practically completed by 2020.
Within the data there is also a significant amount of detail beyond the mobile/non-mobile split in behavior. There is a distinction drawn between tablet and phone traffic and a further distinction between Android and iOS devices. ((The split between Android and iOS for tablets and phones was not published for 2013 but I extrapolated from previous years and assumed that 80% of tablet traffic was sourced from iPads vs 88% in 2012 and 99% in 2011. Note also that non-iPad traffic is assumed to be Android but that includes the Kindle and Nook products which are using partial and unsanctioned versions of Google's Android.))
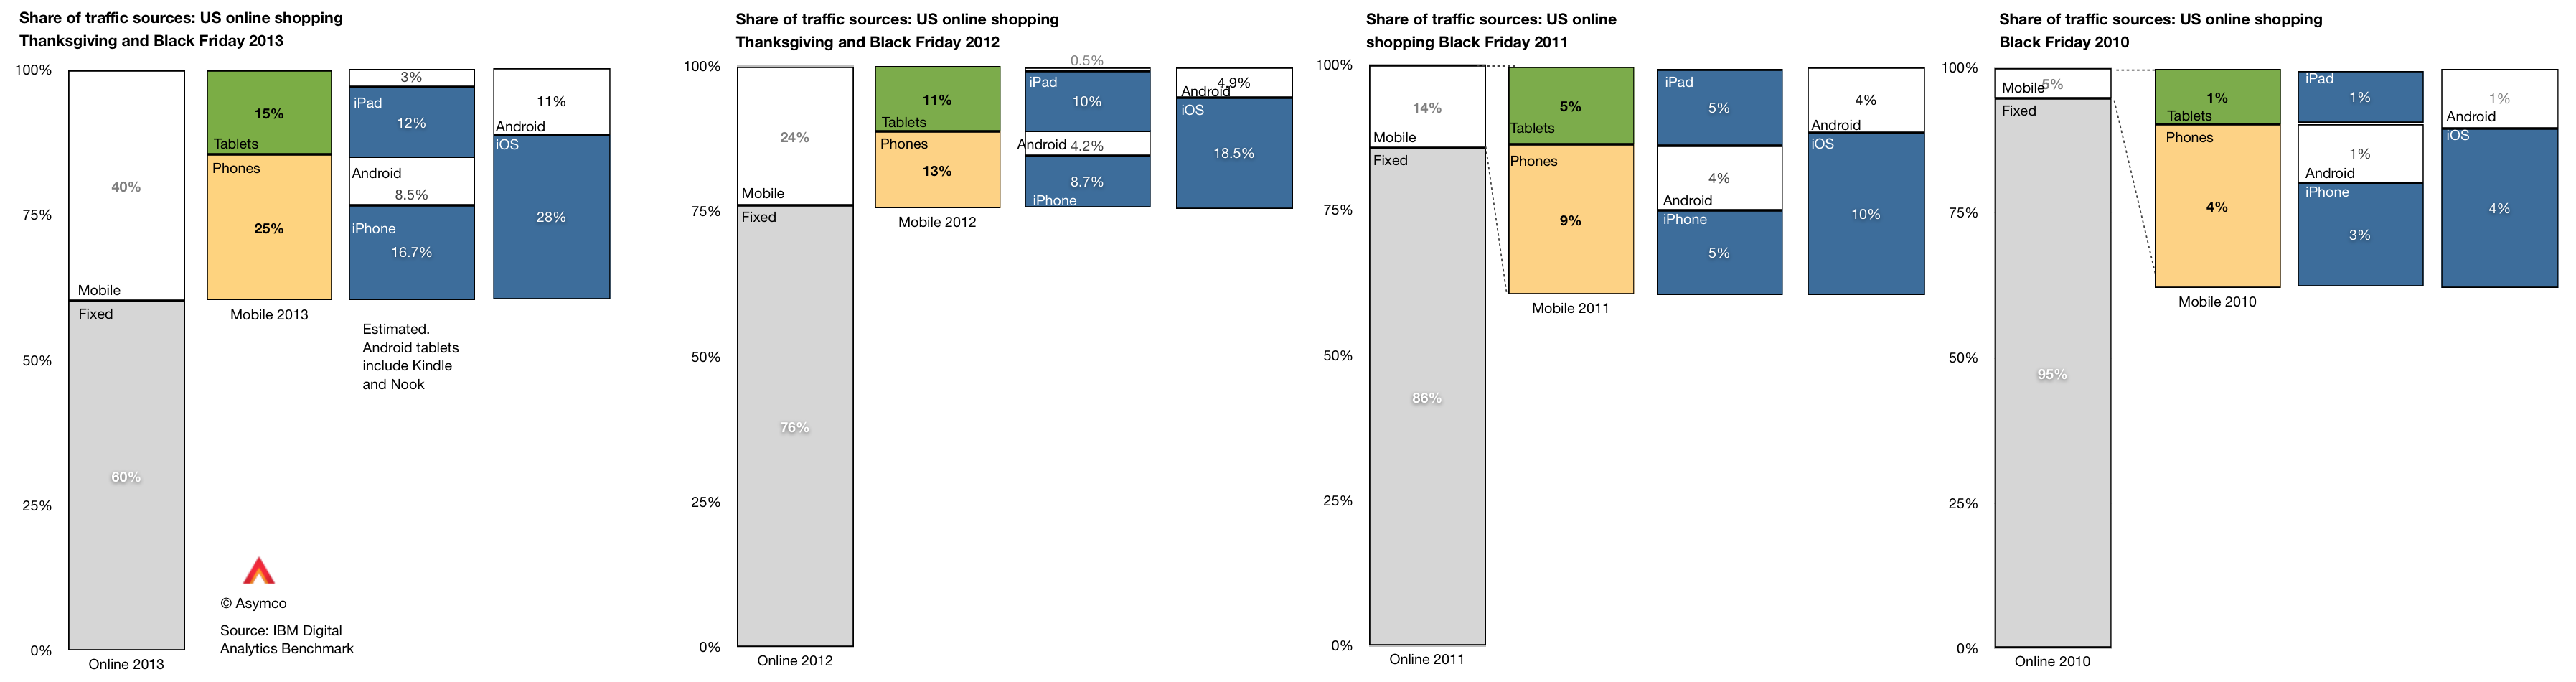
This more detailed view of the traffic is shown in the following diagram:
A few observations:
The pattern of slowing tablet growth is likely due to the slowing growth in iPad sales. This itself is due to the lull in product launches as the shift to fall only iPad releases took place in 2012.
The consequence is that iPad traffic contribution only increased by 2 percentage points, from 10% in 2012 to 12% in 2013. Compare this with the doubling the previous year (from 5% to 10%).
Among phone users, both Android and iOS grew their contributions to traffic by roughly 100%. Android phone traffic increased from 4.2% of all traffic to 8.5% and iPhone traffic increased from 8.7% to 16.7%.
As we also know the approximate number of phone users for each platform (via comScore) then we can also determine the per user contribution of traffic of each platform. ((Note that this is phones only.))
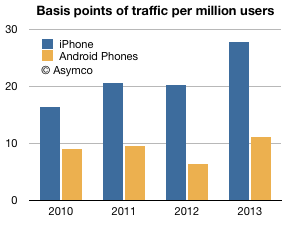
The measure is "basis points of traffic per million users" and it is the result of taking the traffic data (in percent of total online traffic) and dividing by the population of users of a particular platform. The result is shown below:
The way to read it would be that each million iPhone users generated about 28 basis points of traffic while each million Android users generated about 11 basis points of traffic.
A way to compare these audiences would be to define the ratio between traffic usage by platform user. That ratio was
1.83 (iOS:Android) in 2010
2.16 in 2011
3.15 in 2012
2.51 in 2013
So, as far as phones are concerned, US iPhone users are about 2.5 times more likely to shop online than US Android phone users. The data is reliable: with the US population now over 65% penetrated with smartphones, these populations of users (totaling over 130 million) are vast and representative. As the technology is reaching deep into the late adopter segments the difference in behavior between iOS and Android usage is becoming easier to explain. We have to eliminate quirks of demographics or income or other possible causes.
The platforms themselves are becoming the last remaining suspects as causes for differences in the behavior of their users.
It may seem preposterous to suggest that a platform can affect shopping behavior but let's remember that the PC, the subject of this article, is a platform in itself. The migration of usage away from the PC to alternatives can only be explained by the alternatives being superior at the particular job that needs doing. The argument is naturally extendable to each alternative individually.
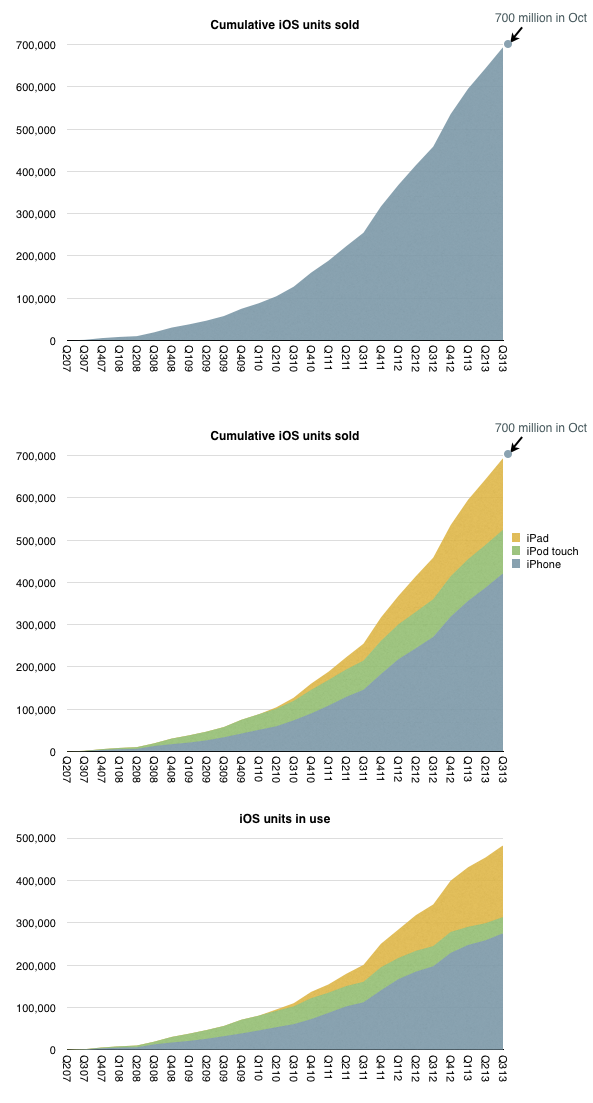
iOS unit sales crossed over 700 million units last month. That is a significant milestone but the total number of units in use is likely to be lower. My estimate based on device replacement assumptions is that about 500 million are still in use.
The estimated break-down of units sold and in use by device type is shown below:
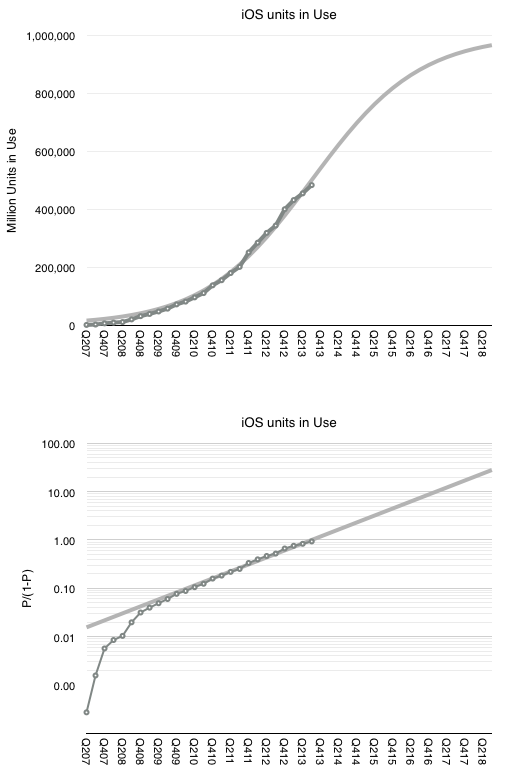
When I looked at the penetration of iPhones in the US (as a part of smartphones in total) the surprising pattern was that it followed a logistic curve (while other platforms didn't.) If this is indicative of a particular learning process to be observed in the market, then can we extend the logistic growth pattern to iOS overall?
I tried it with the assumption that at 500 million, iOS is at the half-way point in its growth. This assumption comes from growth being near an inflection point. It could be that iOS might accelerate further in which case peak penetration could be higher than 1 billion, but might take longer to reach.
The 500 million as 50% penetration point assumption fits the model as shown below.
The fit is pretty good for the period after the iPhone 3G launched. This assumption would therefore imply (nearly) one billion iOS devices in use by the end of 2018.
Note that this does not mean one billion iOS users. The attach rate for iOS devices per user could well reach 2 by then placing total user base at 500 million. Note that this size of audience is very nearly the existing total Apple audience already (counting iTunes/iCloud accounts).
This means that we already have "existence proof" that Apple can reach half-a-billion users. Apple does not need to discover a large new set of non-consumers. The idea of 1 billion iOS devices is simply the projection that each current user could some day use two devices.