Asymco

Asymmetric Intelligence

Horace Dediu

  1. Cubed Episode 010: The Process of Innovation

    Podcast · 1 comment

    I joined Benedict Evans and Ben Bajarin on their Cubed podcast to discuss innovation and cultures that breed innovation. We also discuss some updates on our thinking of the curious case of the android tablet ghosts toward the end.

    Show Notes

    The Meaning of Really Cheap Android

    The Innovators Curse

    Dark Matter

    Android as the Platform For Commodity Electronics

    Harvard Business Review – How Pixar Fosters Collective Creativity  (subscription required)

    via Cubed Episode 010: The Process of Innovation | Cubed Podcast.

  2. Dark Matter

    Research · 84 comments

    Benedict Evans explains well the problem with measuring Android tablets. There are no reliable data collected because many of the devices are invisible through the regular, measurable channels:

    • There are no firms which report their shipments
    • They are not sold through retail chains which normally are sampled in the US and Europe (NPD and GfK respectively.)
    • They don't show up in browsing or ad transaction data
    • Google Play statistics are missing most of the activations since they are not sold as bona fide Google-sanctioned Android.

    The only measured statistic happens to be component shipments. Items such as screens, CPUs or perhaps memory might be visible to market analysts. It's therefore tempting to add up tires manufactured to determine what's getting sold in auto dealerships.

    But it's also hugely problematic.

    Before we go into that rat's hole, I want to re-visit my original criticism for market analysis based on device attributes. When the iPad was new it was famously labeled a "media tablet" by Gartner and excluded from being counted (and hence compared) with PCs. This created an implicit signal to the analyst's clients to ignore the entrant as irrelevant.

    That actually accelerated their demise (and the revenue prospects for the analyst).

    In contrast to that exclusion--of a clear and present danger based on an arbitrary definition of form factor--the analyst who defines categories of products purely on the definition of their components is guilty of the same sin.

    Snowing the audience with irrelevant comparisons is just as bad as withholding relevant comparisons. This is explicitly asked of witnesses: to tell the truth, the whole truth and nothing but the truth. The "nothing but the truth" means the exclusion of irrelevance.

    The correct approach is to identify which devices are comparable (and thus in the same category) based on the jobs they're hired to do. If a tablet overlaps considerably in the work it does with a PC (e.g. browsing, email, media play, and other applications) then they should be considered comparable. If a tablet does nothing that a PC does or nothing that an iPad does (e.g. no browsing, email, apps or ecosystem activity other than piracy) then they should not be considered comparable.

    Which brings me back to the question of what these dark matter "Android tablets" actually do.

    To answer I want to recall another "dark matter" technology that seems to have gone largely unnoticed but was exceptionally popular. This was the VCD or Video CD. It was an alternative to the DVD without the licensing and DRM overhead it entailed. It was extremely popular in Asia as a way of not only buying but also sharing video content. The cost of content was a fraction of sanctioned versions, essentially taking the role that mass-copied VHS had in previous years.

    The "job to be done" was to enjoy video content cheaply and conveniently for the equivalent of pennies a day. A job very similar to what we think of as cable TV today.

    These devices and discs were largely invisible mainly because they did not exist in economies which adopted protected DVDs and because the content consumed did not hit against any databases that tracked consumption. Nevertheless there might have been hundreds of millions of these devices sold and billions of discs viewed.

    Now we are in a situation where devices whose primary purpose is to watch video content (cheaply and conveniently) are being counted. By their counting, their implicit competitiveness is asserted. But it means nothing if they are not hired for the same jobs. In fact it misdirects attention.

    Sometimes these "low end" devices do grow up to swamp the higher-powered alternatives with good enough functionality. That is the innovator's dilemma for low end disruption. But in some cases they don't because other factors are at work. Because ecosystems have complex multi-sided markets and because regulations and channels and consumer behavior conflict with the technical specification.

    For this reason the VCD did not "disrupt" DVD or grow up into a Blu-Ray equivalent that caused Hollywood to crumble. It faded away as an anomaly.

    Whether the dark matter Video-only Android device will come to swamp the iPad will depend not on just volume shipments in select geographies. It will depend largely on the ecosystems built around it. The ecosystems of VCD were largely unsustainable because there was no value placed on the content itself. The value chain did not strive to sustain the technology. When something better came along, it got dropped.

    In contrast, content-based value chains sustain technologies which keep the revenues coming. And we can measure this revenue.

    You don't need to look too hard for that in tablets. Apple states it quite frequently: total payments to developers.

  3. Seeing What's Next

    Research · 62 comments

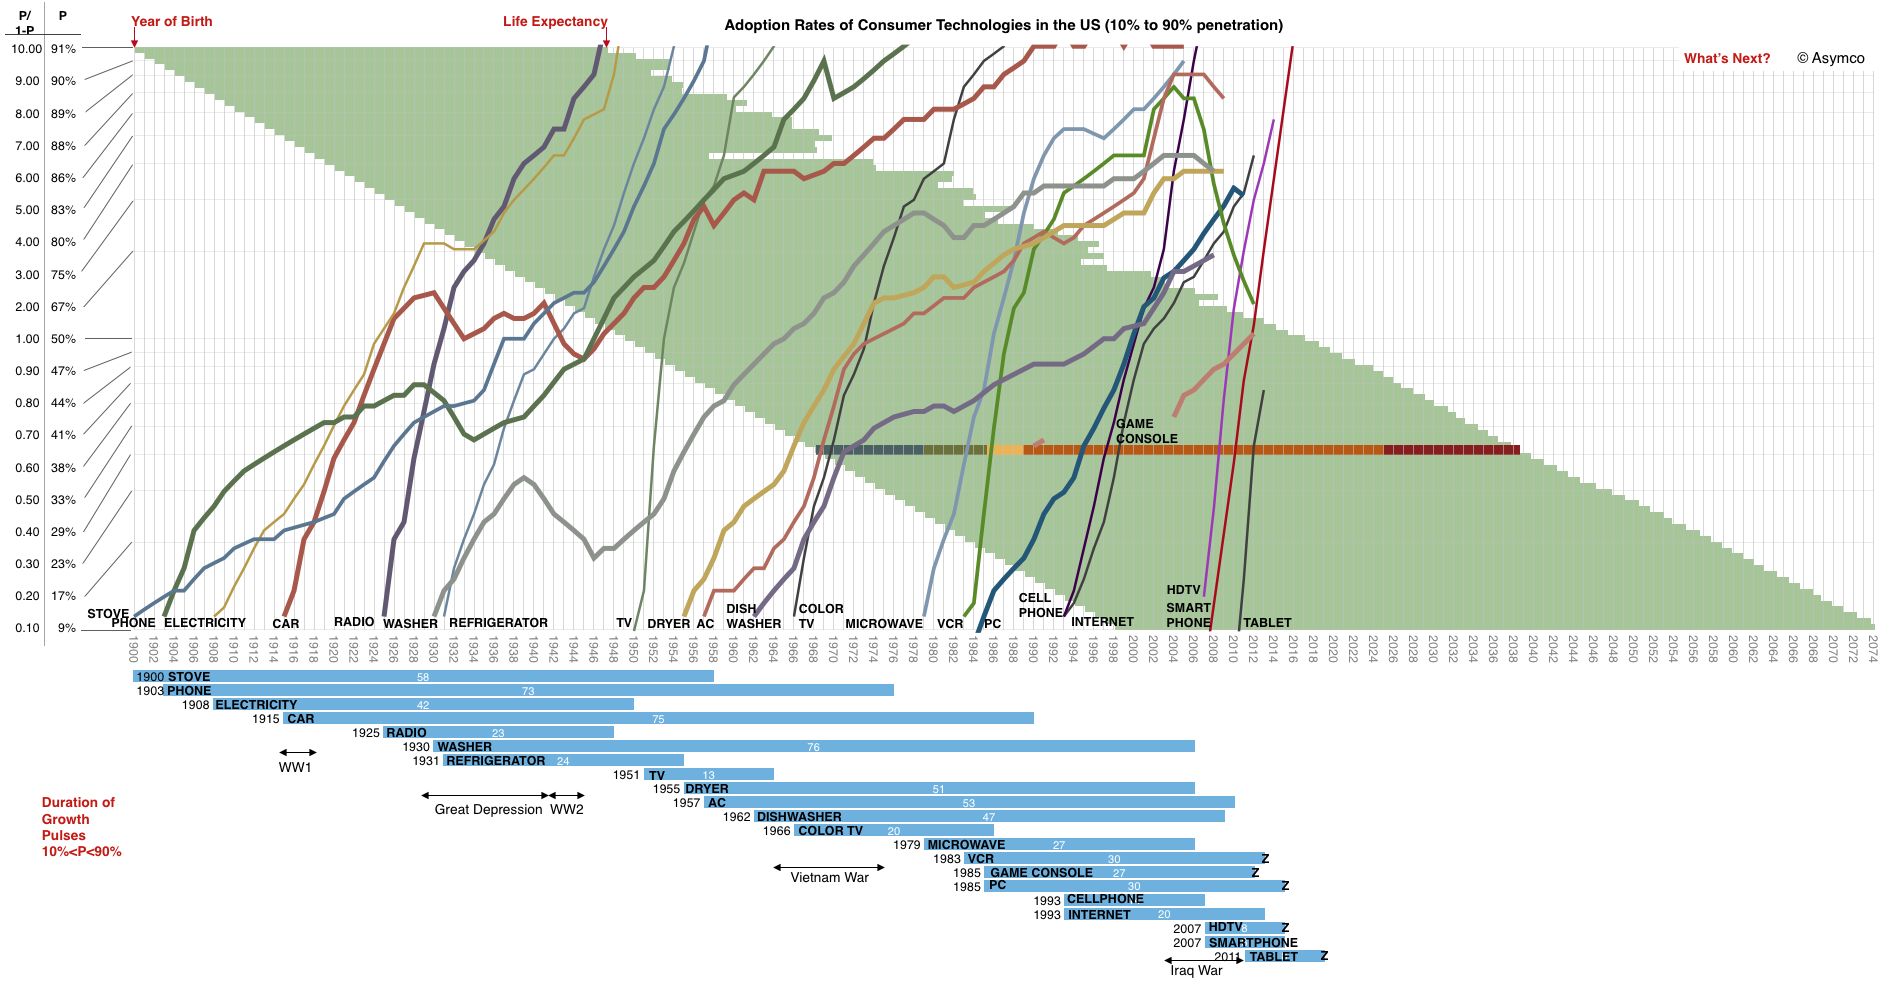
    The adoption of smartphones in the US is on track for reaching 90% of the available audience by August 2016. This is a mere eight years after smartphones reached 10% penetration. As far as technologies go, that's pretty fast. To get an idea of how rapid, I plotted a few other technologies and the time they took to grow within the US market.

    Adoption Rates of Consumer Technologies

    A few things to note:

    1. The time scale has a yearly resolution spanning 1900 to 2074
    2. The penetration scale is logarithmic and shows the ratio of Penetration/(1-Penetration) allowing a linear view of logistic growth.
    3. The blue bars summarize the growth pulses and give a starting year and duration in years.
    4. Note some traumatic events are marked on the time frame. They partly explain innovation gaps or decreases in adoption.
    5. The life expectancy of Americans born from 1900 to 1998 is also shown as green bars. This allows the reader to trace which technologies emerged during the lifetimes of people they might have living memories of. I overlaid one specific lifetime beginning in 1968 and color coded with Childhood, Adolescence, Higher Education, Work live and Retirement as a guide. You can note how the PC emerged when that person would have been in college.
    6. Some technologies have not yet saturated and may never do so. They are marked with a "Z" on the bar graph. It might be instructive to understand why.

    You'll also note that the time frame does not end today but that the technology curves do. The time frame includes the expected lifespan of someone born in 1998.

    What will they see?

    There is a lack of visibility or certainty among observers that anything worthy of inclusion on this graph will ever emerge.

    And yet, when glancing at this graph, it would seem that the addressable market, the rate of introduction of new technologies and the speed of adoption have all increased. The area to the right of 2013 looks inviting to a plot of many lines.

    Indeed, for the canvas to remain blank would be the riskiest of bets.

    What would you put upon it?

  4. A yardstick for capex

    Research · 21 comments

    us-navy-ford-carrier.si

    Photo credit: Wikipedia, CVN-78

    I've been writing about Apple's capital intensive operations for some time. The difficulty has always been in explaining the scale involved. I've compared the spending to that of Samsung, Microsoft, Google, Intel and Amazon. But these numbers still can't be easily grasped. You can't point to any comparable objects when you try to explain the figure. I struggle to create a less abstract notion than that of a "sea of tooling and servers."

    Instead, I've used the analogy of US aircraft carriers. Historically, Nimitz class aircraft carriers have cost a less than $5 billion. The USS Ronald Reagan, christened in 2001, cost $4.5 billion. Therefore I was comfortable saying that Apple spends the equivalent of about one Nimitz class aircraft carrier every six months (and that the Navy takes about six years to put it together.)

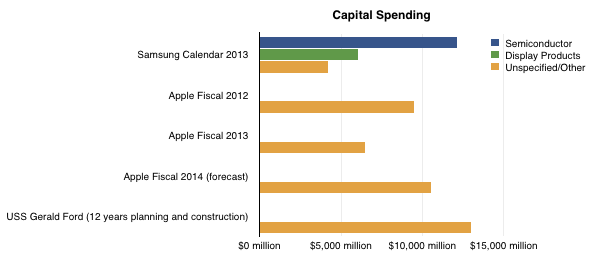
    Unfortunately, costs for aircraft carriers have gone up. The USS Gerald Ford will take about $13 billion to complete. That places Apple and Samsung capital spending in the following context:

    Screen Shot 2013-11-12 at 11-12-12.29.32 PM

    Note however that planning and construction for the latest aircraft carrier takes 12 years, rather than the 12 months spending schedule for the companies shown. Note also that Apple's spending is unspecified and included several categories while Samsung's categories are partially specified.

    Due to this inflation in aircraft carrier costs, my denomination of capex is beginning to be strained. Nevertheless, the question of what Apple spends $10 billion a year remains knowing what that could buy the Navy (or Samsung.)

  5. What's an Active User worth?

    Research · 86 comments

    Apple has sold 700 million iOS devices. Google claims one billion Android device activations. Microsoft has about 1.5 billion Windows users and Facebook about 1.19 billion. LinkedIn has 259 million users and Twitter has 232 million. Amazon has 215 active account holders and PayPal 137 million.

    Markets place a value on these users implicitly when company shares are priced. For example, Twitter whose users are worth about $110 or FaceBook's $98 and LinkedIn at $93.

    This consistency suggests a universally accepted value per social media user but what is the value of an ecosystem user? Apple, Google, Microsoft and even Amazon aspire to enable ecosystems which should be seen are more valuable than mere communities. Ecosystems enable a higher level of economic activity because they are unbounded by the medium itself. Any number of media can be created. Or so the theory goes.

    If we could determine a value for an ecosystem user we could test it against the going value of a social media user. Fortunately we have enough data to do so.

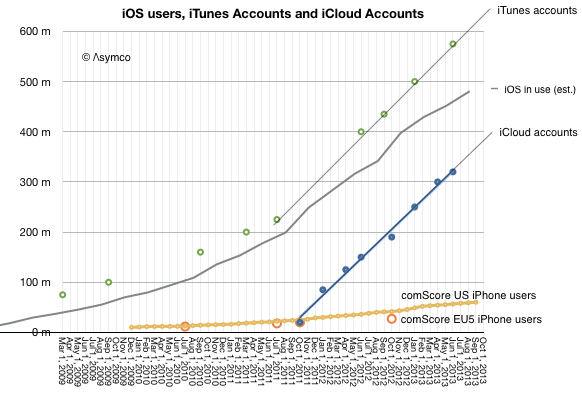
    The total number of iOS devices sold per quarter allows us to measure the install base of device users. With some assumptions regarding the retirement and attrition rate we can get the following history:

    Screen Shot 2013-11-11 at 11-11-11.52.34 AM

    Since the total number of iTunes accounts is updated with some regularity I've added it to the graph. I've also shown on the same graph the total number of iCloud accounts. For calibration, I included survey data showing the number of iPhone users in two regions (US and EU5).

    These combined graphs give us an upper bound of active users (iTunes accounts) and a lower bound (iCloud) calibrating our device-based estimate. The regional iPhone data offers some additional test on growth.

    The result is "about 500 million" ((482 million by my count but with quite a bit of margin of error)) with a growth of about 11 million per month.

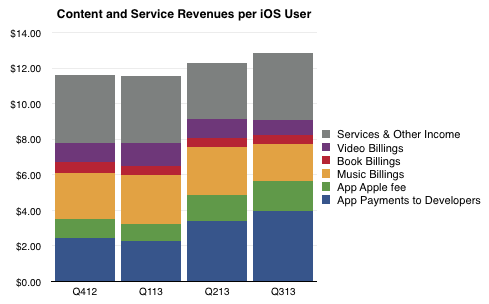
    So if we know with some confidence that there are about 500 million active users as part of the iOS ecosystem, how do we know how much value they generate? The answer is in the consolidated iTunes revenues as reported by Apple: $4.26 billion/quarter. With some attention to the reported media retail and purchases, the following picture of the average iOS user's quarterly spending emerges:

    Screen Shot 2013-11-11 at 11-11-11.50.23 AM

    The bottom line is that in the last 12 months the average iOS user contributed  about $48/yr to the ecosystem via Apple's own properties. They also bought the device and paid for cellular service in most cases. They may also have engaged in quite a bit of browsing and online purchases which fed other ecosystems. But as far as Apple is concerned, it transacted about $48 per user.

    As Twitter revenues last year were $317 million, the Twitter user today generates about $1.36 of revenue per year or one thirty-fifth of what an iOS user generates through iTunes and iCloud alone. And note that the number of iOS users is about twice that of Twitter.

    Of course one could argue that the iOS user's participation is not profitable for Apple. It does obtain massive cash flow from iTunes which finances its fashionable data centers and bandwidth but it does not presume to value itself primarily through this revenue.

    Or at least the market doesn't think so. We don't hear much about how Apple is worth so many dollars per user. ((I suppose the corollary to this is that Apple users are disloyal or fickle or fleeting, and quite contrary to observed behavior.))

    The paradox is that while the device which enables this commerce is where Apple guides the consumer's perception of value, markets discount devices and bid up services. In other words, users continue to pay for the devices which delight them enough to participate in services (especially the monthly billable kind) but markets walk right by these shiny baubles and and shower money on services which have negligible sales and even fewer profits. There must be some serious misdirection going on here. The question is who's being fooled.

  6. The Critical Path #100: Fin de siècle

    Podcast · 3 comments

    The closing of one and the onset of another era. In this hundredth episode of The Critical Path we look back to some of the big questions we asked and ask them again with hindsight and foresight. They are:

    1. What happens to entertainment in the era of pervasive connectivity and computing?
    2. What happens to privacy when citizenship requires divulging all your secrets to commercial entities?
    3. What happens to the structure of computing when diffusions of innovations are instantly global?

    via 5by5 | The Critical Path #100: Fin du siècle.

  7. My guest appearance on 350 Third podcast Episode #62 – Rocket Science

    Podcast · 4 comments

    Episode #62 – Rocket Science | 350 Third.

    Horace Dediu joins us for a discussion about the history of the space industry and its more recent commercial direction. We touch on the history of governmental and private investments in space as well as possible asymmetric strategies for the future including a railgun and the ever elusive space elevator. Does the commercial exploitation of space fit within a timescale business is able to accept?

  8. The newly integrated company

    Research · 25 comments

    During the first quarter of fiscal year 2014, we changed our organizational structure as part of our transformation to a devices and services company. As a result of these changes, information that our chief operating decision maker regularly reviews for purposes of allocating resources and assessing performance changed. Therefore, beginning in fiscal year 2014, we are reporting our financial performance based on our new segments; Devices and Consumer (“D&C”) Licensing, D&C Hardware, D&C Other, Commercial Licensing, and Commercial Other.

    The previous reporting segments were:

    • Windows & Windows Live
    • Server and Tools
    • Online Services
    • Microsoft Business
    • Entertainment and Devices
    • Unallocated and other

    The new are:

    • D&C Licensing: Windows OEM licensing, Consumer Windows, Consumer Office, Windows Phone (including related patent licensing)
    • D&C Hardware:  Xbox 360, second-party and third-party video games, and Xbox LIVE subscriptions; Surface; PC accessories
    • D&C Other: Resale, including Windows Store, Xbox LIVE transactions, Windows Phone Marketplace; search advertising; display advertising; Subscriptions including Office 365 Home Premium; Studios including first-party video games; retail stores.
    • Commercial Licensing: Windows Server, Microsoft SQL Server, Visual Studio, System Center; Windows Embedded; volume licensing of Windows; Microsoft Office for business (Office, Exchange, SharePoint, and Lync); Client Access Licenses;  Dynamics, Skype.
    • Commercial Other: Enterprise Services, including Premier product support services and Microsoft Consulting Services; Cloud Services, comprising O365, other Microsoft Office online offerings, Dynamics CRM Online, and Windows Azure.

    From Microsoft's FY14 Q1 10Q via Microsoft Investor Relations - Press Releases

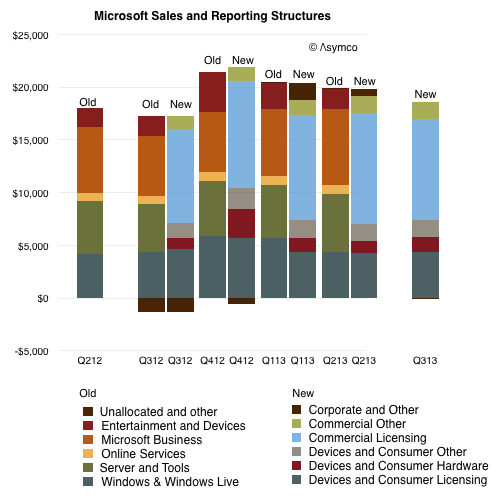
    The mapping between the old and new is not straight forward. There is overlap between D&C Licensing and the old Windows and perhaps between Entertainment and Devices and D&C Hardware but there are many gaps. There is also some overlap between the old "Business"/"Server" segments and the new "Commercial" but, again, they cannot be matched.

    I show the difference between the two structures in the way revenues are allocated below, using color to try to show similarities.

    Screen Shot 2013-10-25 at 10-25-11.25.07 AM

    Given the re-stated quarters it's possible to compare one year's historic performance at a segment level. For example, the company states that "Devices and Consumer revenue grew 4% to $7.46 billion" while "Commercial revenue grew 10% to $11.20 billion".

    Since we don't have data older than one year, our ability to assess the company over longer time periods will be drastically reduced and a new picture will take a long time to emerge.

    There is however one aspect of the new structure that needs to be appreciated right away: the allocation of costs has changed fundamentally. The company explains:

    Cost of revenue is directly charged to the D&C Hardware segment. For the remaining segments, cost of revenue is directly charged in most cases and allocated in certain cases, generally using a relative revenue methodology.

    We do not allocate operating expenses to our segments. Rather, we allocate them to our two segment groups, Devices and Consumer and Commercial. Due to the integrated structure of our business, allocations of expenses are made in certain cases to incent[sic] cross-collaboration among our segment groups so that a segment group is not solely burdened by the cost of a mutually beneficial activity as we seek to deliver seamless experiences across devices, whether on premise or in the cloud.

    [my emphasis]

    In that brief paragraph Microsoft has formally and in a financially binding way declared itself to being a functional organization. ((Welcome to the club.))

    The mechanism seems banal: operating costs are no longer assigned to product divisions but to two large buckets. In practice this means that profitability (P/L) cannot be assessed or assigned to individual managers. The lack of P/L responsibility means that incentives from top to bottom have to be re-engineered. If this goes wrong, the Assets ((read: people)) of the company could evaporate.

    If the assets go, then processes and priorities are for naught.

    In other words, what the company is undertaking is a priority shift (to a  functional structure to create integrated experiences) which requires a process change (whereby employees work according to new incentives) while preserving the fragile assets the company depends on (a motivated and skilled base of employees.)

    This makeover is as ambitious as a re-org gets and the context, scope and target are as difficult as they can be. This is, after all, the largest software company operating the the most dynamic industry whose multi-sided markets are notoriously volatile due to disruptive forces.

    The challenge also suggests why Ballmer left and who should replace him. A priority transplant operation requires a different set of skills than those held by the manager who created the processes for the previous set of priorities. That's the manager's dilemma: even if you foresee the changes needed and push for them to be enacted, your reward might be to be replaced by someone who can make the changes happen.

    Those who envision and persuade for change are rarely allowed to enact it.