In How close to saturation is the smartphone I highlighted that the US is not nearly saturated at 68.8% penetration at the end of March. Since the US is not the highest penetrated, one may wonder whether other "developed" countries are far further along.
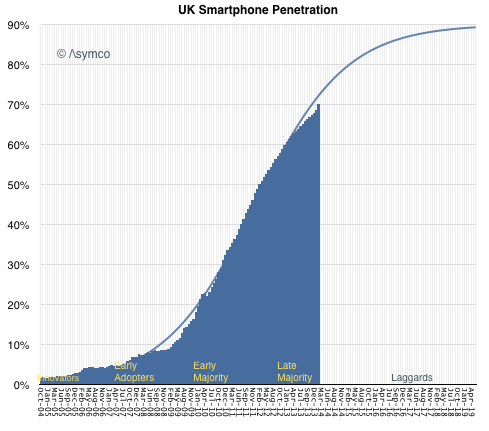
There is no data on all the countries in the world on the same resolution as that in the US, but thanks to Charles Arthur, Kantar shared data on the UK and we can have a clear trajectory for that country.
The most recent data for UK was as of February 2014 when penetration was 70%.
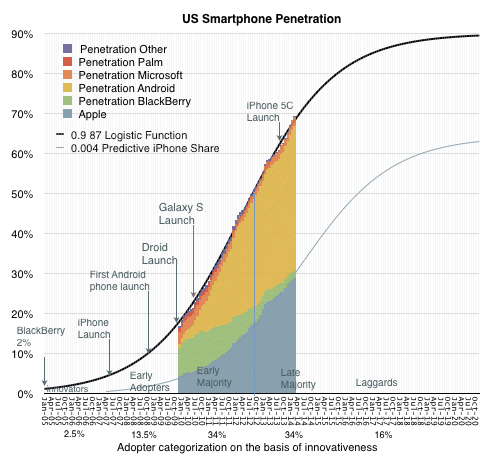
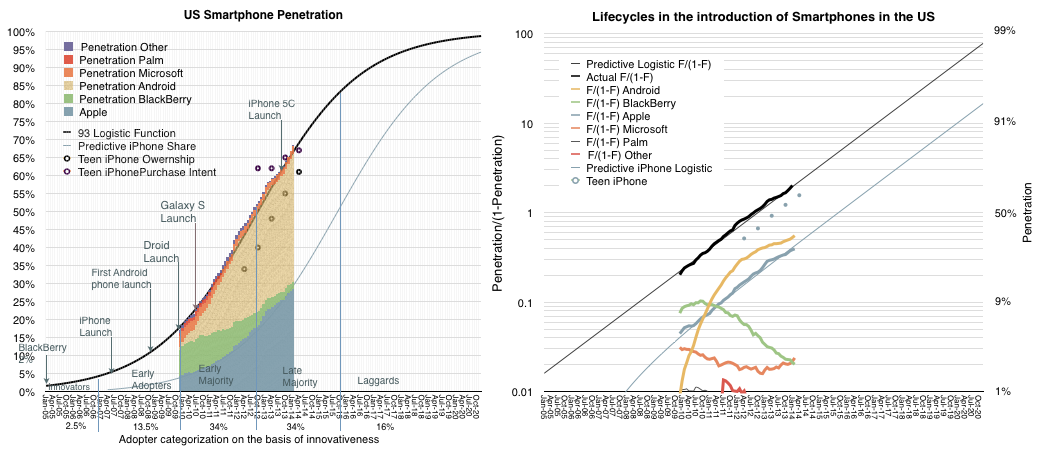
In February the US figure was 68.2%, so the US is 1.8% behind in penetration. The equivalent picture of the US is below:
Not a significant difference. Both markets are in the "late majority" phase of growth and well before the lagging adopters join.
Note that I took a crack at forecasting both the US and the UK penetration given the significant amount of data we have so far. The asymptotic penetration value I chose was 90%. If the pattern holds then there is growth in both markets (and by proxy the developed world) well into 2018.
The US is not the market where penetration is highest. However, it is the largest market where we have reliable penetration data (from at least two sources) and the one where penetration is near the top of the range.
The graph showing the US ranked against others as of a year ago is here. The US was cited at 56.4% at the time. I keep track of comScore's data and it showed 58.2% at the end of March and 55.3% at the end of January, making the figure very believable.
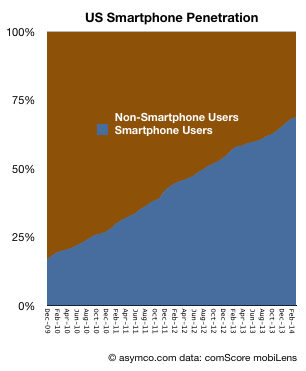
The most recent data from comScore shows penetration at 68.8%. In order to understand what the limits of that growth could be it's important to see the longer-term pattern. It would show whether there is a clear point of inflection and thus a predictable "saturation" around an asymptotic value.
The following graph shows the percentage of smartphone users/non-users since late 2009.
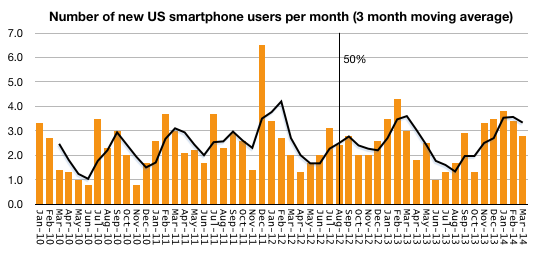
The following graph shows the rate at which users are being added to the smartphone ranks (measured as new users per month.)
To summarize, the conversion of users from non-smart to smartphone usage is fairly constant. The March '14 period saw 2.8 million new-to-smartphone users. the March '13 period saw 3.0 million, the March '12 period saw 2.0 million and March '11 saw 3.0 million. There is no discernible slowing of adoption.
Note that I added a trailing three period average in new users which fluctuates somewhat predictably due to seasonality. Finally, note that the figure of 50% penetration was reached almost two years ago and no noticeable change of adoption has happened since. Cellular phone ownership in the US is still rising (though very slowly) and it now about 90%.
The only conclusion is that even at the current 68.8% penetration, we are not anywhere near "saturation" of smartphone users in the US, and the US is a leader among "developed markets" so there is little to suggest that saturation has happened anywhere with significant populations.
iPad sales were unexpectedly slow in Q1. Tim Cook explained it as follows:
iPad sales came in at the high end of our expectations, but we realized they were below analysts' estimates and I would like to proactively address why we think there was a difference. We believe almost all of the difference can be explained by two factors.
First, in the March quarter last year we significantly increased iPad channel inventory, while this year we significantly reduced it.
Second, we ended the December quarter last year with a substantial backlog of iPad mini that was subsequently shipped in the March quarter whereas we ended the December quarter this year near supply demand balance.
We continue to believe that the tablet market will surpass the PC market in size within the next few years, and we believe that Apple will be a major beneficiary of this trend.
Tim Cook went on to say "over two-thirds of people registering an iPad in the last six months were new to iPad"
In a later discussion, Luca Maestri said:
As Tim explained earlier, our iPad results and the comparison to the March quarter last year were heavily influenced by channel inventory changes. Specifically, this year we sold 16.4 million iPad into our channel and sold through almost 17.5 million, reducing our channel inventory by 1.1 million units.
Last year, we sold over 19.4 million iPads into our channels and sold through 18 million, and therefore increased channel inventory by 1.4 million units. As a result, the year-over-year sell through decline was only 3% compared to the sell-in decline of 16%.
We exit the March quarter with 5.1 million of iPad channel inventory which left us within our target range of four to six weeks. iPad continues to lead all other tablet by far in terms of user engagement, size of ecosystem, customer satisfaction and e-commerce.
In a later Q&A:
Steven Milunovich - UBS Securities: Tim, I understand that the iPad is not as weak as it appears on a sell-through basis, but still it's relatively flat over the last year in terms of sell-through. What are your thoughts in terms of why that is and can that accelerate with Office on the iPad going forward?
Tim Cook - CEO: It's a good question. Let's talk about iPad a little more than we did in the comments.
When I backup from iPad, here is what I see. It absolutely has been the fastest growing product in Apple's history, and it's been the only product that we've ever made that was instantly a hit in three of our key markets, from consumer to business including the enterprise and education.
And so, if you really look at it in just four years after we launched the very first iPad, we've sold over 210 million, which is more than we or I think anyone thought was possible at that period of time. It's interesting to note that that's almost twice as many iPhones that we'd sold in a comparable period of time, and over seven times as many iPods as we'd sold in the period of time.
So, I think it's important to kind of to put that in perspective. We've come a long way very, very quickly. Looking at it by market a bit, which I think is important. I think Luca mentioned a little bit of this in his comments. In the education market in the U.S., we have a 95% share. So the focus in education is on penetration, is on getting more schools to buy and my belief is the match has been lit, and it's very clear to the educators that have studied it is that student achievement is higher with iPad in the classroom than without it. So I'm confident we've got a really great start in education far beyond the U.S. now. This is happening in many, many parts of the world.
In the enterprise market, we're seeing virtually all, 98% of the Fortune 500, they're using iPad. We're seeing – according to Good Technology who looks at activations of tablets – the latest data we have from them is that 91% of the activations of tablets in enterprise were iPads. So this is also an astonishing number and many of those enterprises are writing apps that are key proprietary apps for running that business, and this is great for that company because they're more productive as a result of that. So once again, just like in education in a way, what we have to do in enterprise is focus on penetration, it has to be deeper and broader.
But in terms of having people begin the process, beginning writing apps, we're doing a pretty good job of that. In the retail market, if you look at the U.S. as a proxy, the NPD numbers for March just came out a few days ago and we had 46% share and embedded in that 46%, there's a lot of things in there that I personally wouldn't put in the same category as iPad, and that are weighing the share down. It's certainly a market we wouldn't play in and in a type of product you would never see an Apple brand on. So, we feel like we're doing well there.
Office; I believe does help. It's very unclear to say how much. I believe if it would have been done earlier, it would have been even better for Microsoft frankly, there is a lots of alternatives out there from a productivity point of view, some of which we brought to the market, some of which many, many innovative companies have brought. But I do see that Office is still a very key franchise in the enterprise, in particular. I think having it on iPad is good, and I wholeheartedly welcome Microsoft to the App Store to sell Office. Our customers are clearly responding in a good way that it's available. So, I do think it helps us particularly in the enterprise area.
The other things you look at on iPad that are just blow away its customer [satisfaction], is 98 [percent]. There is almost nothing in the world with a 98% customer sat and the intention-to-buy numbers look good with two-thirds of the people planning to buy a tablet or planning to buy an iPad. The usage numbers are off the chart, far and exceeding Android tablets, four times the web traffic of all Android tablets combined.
So, when I backup from all of these, I feel great. That doesn't mean that every quarter, every 90 days is going to be a number that everybody is thrilled with. But what it means to me is that the trend over time – over the arc of time, that things look very, very good, that iPad has a great future. And of course the thing that drives us more than any of this are the next iPads if you will, the things that are in the pipeline, the things that we can do to make the product even better, and there is no shortage of work going in on that nor any shortage of ideas.
So when I backup from all of this, I can't help but still be extremely excited about where we are. I think we did a reasonable job of explaining what we think the disconnect was between what we had expected, which we hit it at the high end of our expectation and the street's view of this one. I believe the vast majority of it is that first thing was just channel inventory that maybe we should have been even clearer on last quarter to take into account. But I'm very bullish on iPad.
That's quite a long set of explanations for was essentially was a flat quarter for the iPad. I can't add more to this, but I do want to focus on the bold part of the quote above. "But what it means to me is the trend over time – over the arc of time, that things look very, very good".
How can we see the long arc of time?
The tool I've used for this is the measure of penetration. Historically products which become "mainstream" or widely adopted follow an S-curve during that adoption. The curve is remarkably predictable given a limited set of points. I've discussed how the adoption of smartphones is predictable in the US, EU5 (( And UK specifically and several broader global regions)) and how even particular platforms might be predictable in the context of rates of adoption.
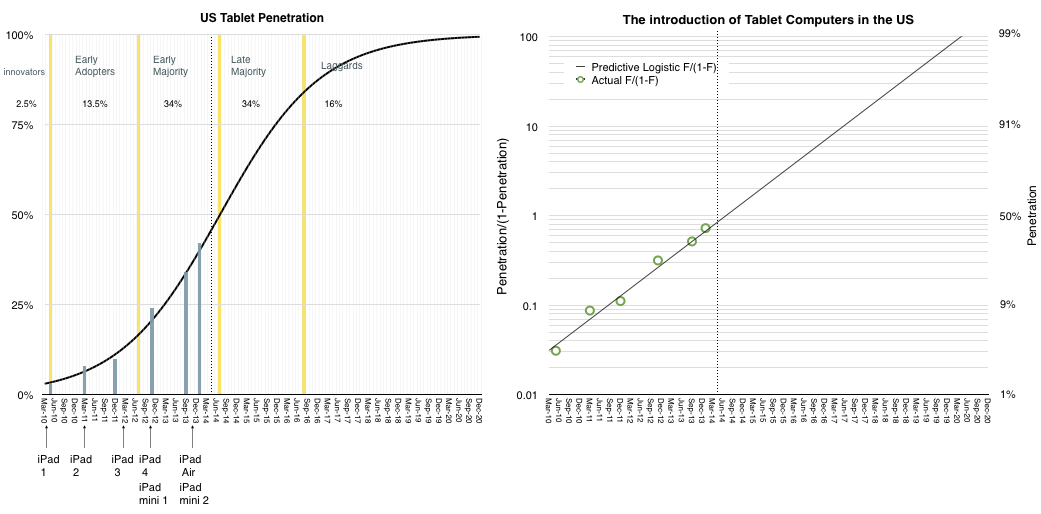
We are fortunate that data also exists for tablets. The Pew Research Center's Internet & American Life Project has published a short history of tablet adoption in the US. I've plotted this data and imposed an S-curve on the data which fits it rather closely.
The results are shown below:
In the graph on the left, the blue bars represent actual measurements of penetration (18+) while the black curve represents a best fit for the adoption rate.
Note that I've added the launch dates of all the iPad models and sectioned the curve into adopter categorization on the basis of their willingness to adopt.
I've also drawn a dotted line on the point where we are in the present.
In the graph on the right I've also duplicated the data using the transform of penetration to log scale penetration/(1-penetration). This shows the relative fit of the data in a more visually comfortable way.
The usual caveats apply:
This is US only
These are adults only
The iPad is not the only competing product
Nevertheless, this is a fairly strong proxy for the market. First, because the US has been leading adoption of almost all consumer product categories in history. Second because adults are a representative sample of users and third because iPad is market share leader.
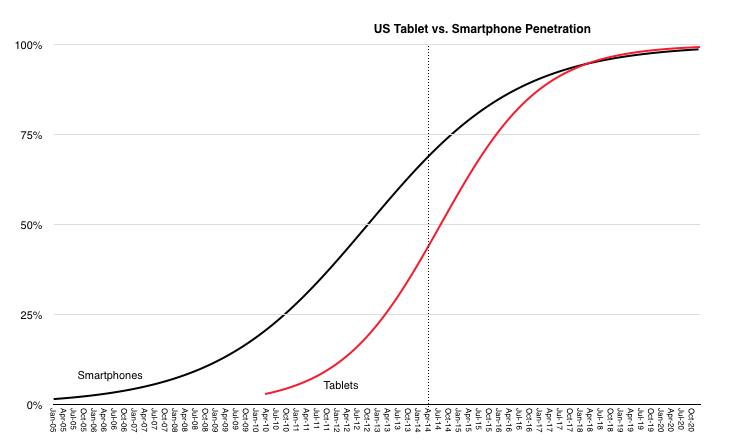
What the penetration data shows is an extremely rapid rate of penetration. In comparison with the smartphone, the tablet is rising much faster. This is shown below:
They are likely to saturate at around the same time but the tablet started much later.
So how does this explain the slowing iPad sales?
It's possible that saturation for tablets could come well below 100% and that we are on a different curve than the model above. However, the ubiquity of the product and broadness of appeal, even within non-consumer (i.e. education and enterprise) makes it difficult to reconcile. In addition, the penetration data is self-evident. It's improbable that penetration goes to 42% as it just did, and then stops suddenly. These decelerations of adoption have been observed historically but they are usually explained by cataclysms such as wars and economic contractions, neither of which are affecting the US right now. If a product solves an important "job to be done" then it gets adopted in a predictable way by a given population.
The anecdotal evidence provided by the company and others coupled with the survey data collected for the population of US users implies that the iPad is solving numerous important jobs and is therefore continuing on a predictable trajectory and that a discontinuity has not occurred.
Management started by saying the iPad sales volume was not surprising to them and that they have not changed their long-term expectations. The penetration data seems to support their confidence.
In the postmodern computing world that we live in, the measure of success isn't revenue or profit or units sold but the number of users that an ecosystem can attract. Therefore the monthly active user (MAU) unit of performance seems to be in vogue right now. E.g.:
Facebook claims Messenger has more than 200 million MAUs
WhatsApp has 500 million MAUs, 48 million of whom are in India
Line last month announced that it had 400 million users (active or not)
WeChat claimed 355 million MAUs
Viber claims 105 million MAUs
Startups are aggregating these millions of MAUs in order to obtain valuations for raising capital ((It's been said that it's difficult to get funded with only 10 million MAUs)) and the faster the growth in MAUs the more "successful" the company is considered.
When companies are acquired it's common to take the transaction value and divide it by MAUs to get an idea of "what an user is worth". This is because there are no revenues to measure and MAUs are taken as a proxy. However, the process by which a MAU becomes a dollar of profit is, to put it kindly, circuitous.
For most (all?) it's not yet clear how it happens especially since not all MAUs are created equal and MAU loyalties can change rapidly and if we added all the projected revenues each MAU will contribute to each app on her device we might reach some absurdity. In actuality, today, for the companies listed above, there are no revenues at all directly from their services.
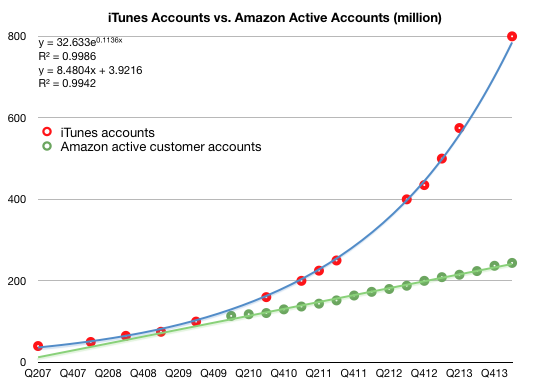
In violation of this convention, there are some companies which manage to obtain revenues from their users. Two such are Apple and Amazon. In the last quarter Apple reported having 800 million iTunes accounts. ((adding, for some unknown reason, that most of them have credit cards.)) These aren't MAUs since the activity level is not noted, but we do know how much is spent on iTunes and services. In addition, Amazon cites 244 million active customer accounts representing accounts which generated purchases within the last 12 months.
This allows us to compare Apple and Amazon in terms of accounts, revenue per account, and, via some analysis, even profitability per account.
The following graphs tell this story. First, the total number of accounts:
Note that I added trend lines to both graphs and their formulas.
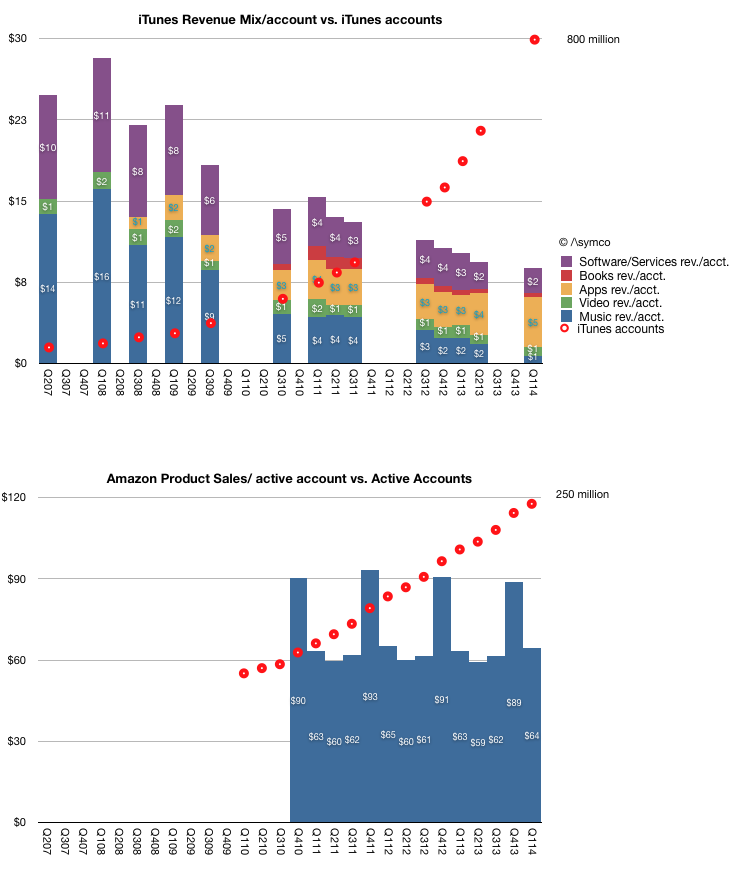
The following are the revenue per account for iTunes (further broken into estimated iTunes segment revenues per account.) and for Amazon. Note that the vertical scales are different.
This view shows just how different the economic value of users can be. In the case of Apple, it's growing its user base at (literally) exponential rates. The revenues per user does, understandably, decline. This is because new/later users don't spend as much as early users. There might be some stability toward the later stages of adoption in revenue per user. The other point about iTunes data is how the mix of revenues has shifted from music to Apps and Services pointing out how users can be migrated across revenue sources over time.
In the case of Amazon it's growing its user base at a linear rate (note equation). The revenue per account remains very steady however.
Broadly speaking, it would seem logical that the speed of user growth has an effect on the quality of those users. This relationship should guide further thinking about the quality of hundreds of millions of users acquired within a few months.
Apple's user growth is a function of expanding its device portfolio and distribution. Apple has shown that there are limits this type of growth. Achieving 830 million or so iOS device sales within 7 years is an amazing feat and one can forgive not having achieved billions more since they managed to obtain significant hardware and service/content revenues from most of them and that those who reached higher figures more quickly didn't manage the same revenue per user.
Amazon's user growth is a function of expanding its logistics and merchandise mix. This is also not easy to do globally. Arguably, Amazon cannot scale in the exponential rates seen by Apple or the other MAU aggregators because it has to depend on trucks and roads and regulators to complete most of its sales.
I suppose, in conclusion, that there is no "right" or "wrong" business model for a user base. Both Apple and Amazon are doing well in building their customer bases and creating loyalties which will serve them well in the future. However whereas there is no right or wrong revenue structure per user, it seems to me that there ought to be some such structure. In most cases this remains a matter of faith rather than reason.
“Innovation” is one of those words that, through casual overuse, has come to signify a wide array of distinct concepts – in some sense, the word is literally losing definition, like an out-of-focus photograph that manages to become blurrier every time you look at it.
These days, anytime anyone does something vaguely new, or a new feature gets added to some gadget or other, the innovation word gets flung about. Indeed, the word is used with the same reckless abandon as those other favourites of jargon-loving MBA types, “solutions” and “disruption”, rendering it increasingly meaningless.
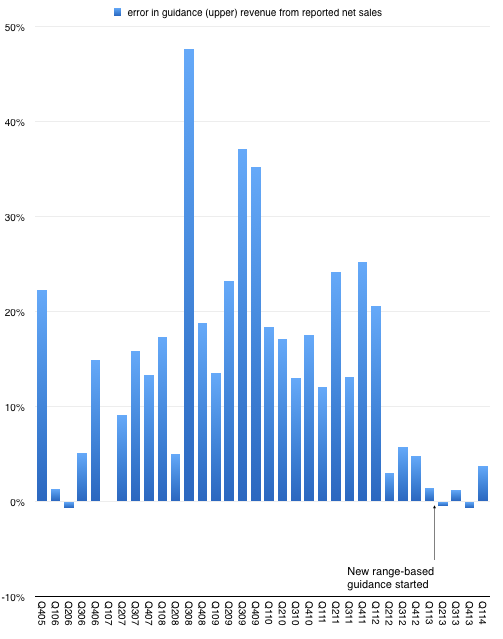
After n quarters of predictability, Apple surprised with sales performance that was 3.74% above the top of their guidance. This may not seem significant but since instituting a new range-bound guidance method in Q1 of last year the company reported revenue within about 1% of the top of the range.
This is in stark contrast to the wide variance in prior years. The following graph shows the "error" in guidance as the percent difference between reported sales and guidance ((Upper end of range in quarters where a range was given.)).
So prior to last quarter we were lulled into thinking that guidance was very nearly perfectly predicting the company. As I tweeted, it took the "sport" out of trying to do any forecasting. All an analyst had to do is tweak the main product growth figures to hit the sales target and then subtract the (generously provided) operating expenses and (also provided) tax rate to get the earnings. Only unknown to getting to an estimate of EPS was how many shares would still be outstanding. ((The company itself would not know shares outstanding as their buying was opportunistic during the quarter.))
Knowing Apple also means that average selling prices are also very rigidly set in stone so the degrees of freedom in analysis were becoming highly constrained.
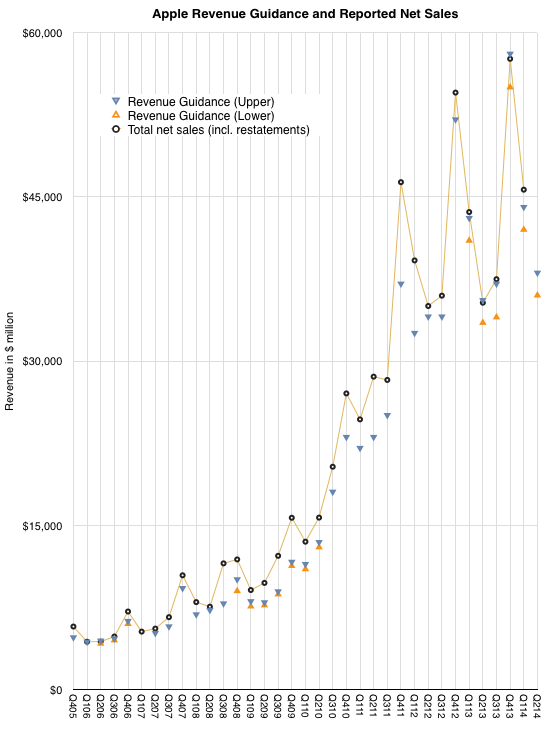
But just when you think you spotted a pattern, it changes. The company surprised with performance outside the band. The following graph shows the estimate ranges it has given and the actual revenues delivered. ((Next quarter is also pencilled in.))
So what happened?
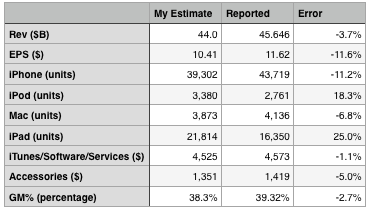
The answer seems to be better iPhone performance. The following table shows my expectations, which were tuned to return revenues exactly at the top of the guidance range.
On product shipments/sales I underestimated the iPhone and Mac and overestimated the iPad and iPod. I estimated iTunes accurately and underestimated accessories by 5%. I also generally got the blend of margins fairly close, being 1 point too low on gross margin.
The bottom line was that the Revenue and Earnings surprise could be accounted for through a significant outperformance on iPhone which offset a less significant underperformance on the iPad.
The iPhone grew sales by 14% which more than offset a drop of 13% in iPad sales and was enough to allow net sales to grow by 5%. Since the company guided nearly flat growth, that 5% was a big surprise.
Now one could ask whether 14% growth in the iPhone revenues is a meaningful change in the long-term evolution of the category. This is a difficult question. The way the iPhone is positioned makes it a great success in the premium segment of the market but it does not place it in competition with the perhaps 80% of the market which seems to be defined by a lower price point.
However let's not forget that pricing is correlative to the market but it may not be causal. Purchase decisions are complex and price is one aspect of that decision. But there are many others. Availability, channels, service, brand all play parts. The error of many analysts is to conclude that price and price alone is causal to behavior. That may be so with commodities, but let us not forget that these products and their uses are newly created and how value is perceived has been changing rapidly. Buyers follow a learning curve in terms of discovering the uses and value of products. These learning curves can be modeled and usually show several years (sometimes decades) for most populations between early and late adoption.
We don't know where the iPhone is on the learning curve for any particular region and that means we can still be surprised by how it grows.
In Part 1 of a look at Google's future I showed that Google's revenues have been highly correlated with the population of Internet users in the markets it serves. If there were a causal relationship between population of users and revenue growth then the company would face a growth inflection point when that population becomes half penetrated.
In Significant Digits Episode 1 (Part 1) I showed data which suggests that the inflection point will come in 2016. Essentially the argument is that Google's growth is ultimately limited by the population of users and that itself is a predictable number. I also used the example of the PC and smartphone penetration curves to show how the perception of the fortunes of companies whose revenues are based on those technologies were affected by inflections in their respective adoptions.
However, correlation is not causation. These users we count are not the customers who pay for Google's services. Users (or usage) is therefore only a proxy. It may be a good proxy and intuitively it makes sense that it's a driver of growth but fundamentally the company lives on a stream of revenues paid by advertisers ((This is true to date and certainly it could change but hints of how that might change are still not visible to me)). In order to really evaluate the opportunity we need to "follow the money" and track down where it comes from.
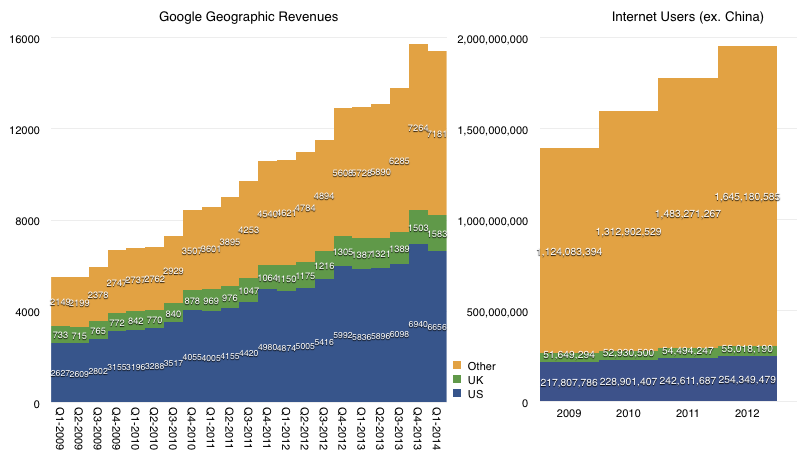
We don't have visibility into the exact sources of these revenues but we have a top-level geographic segmentation (shown below.)
The data shows that in the most recent quarter 53% of Google's revenues came from the US and UK. Five years ago the proportion was 61%. Clearly then about 10% of the mix shifted to non US/UK.
If we exclude China, US and UK, in 2009 there were 1.07 billion Internet consumers. By 2012 there were 1.59 billion users in those same territories. The growth is therefore almost 50%, and this excludes 2013. The corresponding growth in the US/UK was 15%. We should also note that in the same time frame, there were almost a billion Android activations but the number of new users in the US ((as measured in comScore)) was only about 70 million (or 7%).
It's therefore clear that whereas the population of Internet users and the ways they might access Google exploded in the last five years, Google revenues have come disproportionately from US/UK consumers. Or, at least from US/UK advertisers, which we are assuming are primarily targeting local users.
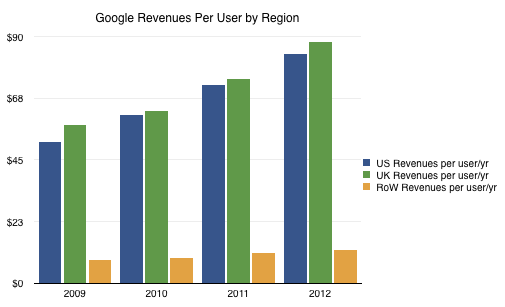
The result is the following revenue per user per year based on where the users reside:
The disproportionate weight of US/UK income and the low growth of income from rest-of-world vs. the far faster growth of usage outside the US/UK means that the toughest nut for Google to crack is not penetration but emerging market monetization.
The disparity is enormous. US/UK revenue is on average $86/user/yr (2012) and rising. The rest of the world only manages $12/user/yr. That Rest Of World includes many wealthy countries such as all of Europe and Japan. So the problem for Google is that it has an order of magnitude less income per user in the part of the internet which remains unpenetrated and the trends show that they are not narrowing the gap. ((The ratio between average US/UK and RoW revenue per user/yr was 6 in 2009, 7 in 2010, 7 in 2011 and 7 in 2012))
Google's R&D efforts seem to be oriented around creating consumption (Making it Rain) but the problem is that the quality of that consumption and the indigenous sources of income are unaddressed. These problems are structural and based on social constructs which don't change at the pace of technology adoption.
Illiteracy is the inability to read and write. Though the percent of sufferers has halved in the last 35 years, currently 15% of the world has this affliction. Innumeracy is the inability to apply simple numerical concepts. The rate of innumeracy is unknown but chances are that it affects over 50% of us. This tragedy impedes our ability to have a discourse on matters related to quantitative judgement while policy decisions increasingly depend on this judgement.
But there is another form of ignorance which seems to be universal: the inability to understand the concept and role of innovation. The way this is exhibited is in the misuse of the term and the inability to discern the difference between novelty, creation, invention and innovation. The result is a failure to understand the causes of success and failure in business and hence the conditions that lead to economic growth.
My contribution to solving this problem is to coin a word: I define innoveracy as the inability to understand creativity and the role it plays in society. Hopefully identifying individual innoveracy will draw attention to the problem enough to help solve it.
"Lastly, nationally circulating tabloid Ilta-Sanomat gets a look at Nokia’s fabled tablet computer that was developed nine years before the iPad hit the market. According to the paper, Nokia had its own innovative tablet device ready in 2001, but unfortunately it never made it to the shops. A former Nokia expert Esko Yliruusi says that the project was suspended a heartbeat before the tablet hit the market because it was thought that there was insufficient demand for such a device." ((A video showing the device is here, in Finnish.))
To explain what's wrong with this usage we need some definitions.
The definition of innovation is easy to find but it's one thing to read the definition and another to understand its meaning. Rather than defining it again, I propose using a simple taxonomy of related activities that put it in context.
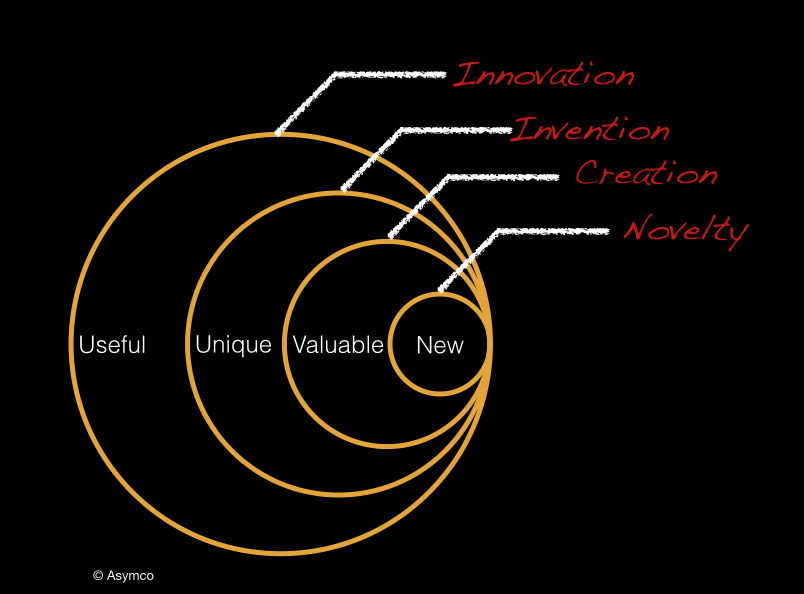
Novelty: Something new
Creation: Something new and valuable
Invention: Something new, having potential value through utility
Innovation: Something new and uniquely useful
The taxonomy is illustrated with the following diagram. The position of the circles shows the embedding of meaning ((The size of the circles also suggests degree of effort required and potential reward. Note that this is not a Venn diagram.))
To illustrate further, here are some examples of the concepts.
Novelties: The choice of Gold as a color for the iPhone; the naming of a version of Android as "Kit Kat"; coining a new word.
Creations: The fall collection of a fashion designer; a new movie; a blog post.
Inventions: Anything described by a patent; The secret formula for Coca Cola.
Innovations: The iPhone pricing model; Google's revenue model; The Ford production system; Wal-Mart's store design; Amazon's logistics.
The differences are also evident in the mechanisms that exist to protect the works:
Novelties are usually not protectable but since their value is very limited the copying is not seen to cause harm.
Creations are protected by copyright or trademark but are not patentable since they lack utility.
Inventions can be protected for a limited time through patents but can also be protected indefinitely by being kept secret. Their uniqueness may also be the means by which they can be kept a secret.
Innovations can be protected through market competition but are not defensible through legal means.
Note that the taxonomy has a hierarchy. Creations are novel, inventions are creations and innovations are usually based on some invention. However inventions are not innovations and neither are creations or novelties. Innovations are therefore the most demanding works because they require all the conditions in the hierarchy. Innovations implicitly require defensibility through a unique "operating model". Put another way, they remain unique because few others can copy them.
To be innovative is very difficult, but because of the difficulty, being innovative is usually well rewarded. Indeed, it might be easier to identify innovations simply by their rewards. It's almost a certainty that any great business is predicated on an innovation and that the lack of a reward in business means that some aspect of the conditions of innovation were not met.
The causal, if-and-only-if connection with reward is what should be the innovation litmus test. If something fails to change the world (and hence is unrewarded) you can be pretty sure it was not innovative enough.
Which brings us to the quote above. The fact that the Nokia tablet of 2001 not only did not succeed in the market but was not even released implies that it could not have been innovative. The product was only at the stage of perhaps being an invention (if it can be shown to be unique) or merely a creation (if it isn't.) Furthermore, if the product is so poorly designed that it is literally unusable then it is just a novelty. A design, sketch or verbal description might be novel but it does not qualify as an innovation or an invention or even a creation. How far the depiction went toward making a dent in the universe defines its innovativeness.
Why does this matter?
Understanding that innovation requires passing a market test and that passing that test is immensely rewarding both for the creator and for society at large means that we can focus on how to make it happen. Obsessing over the mere novelties or inventions means we allocate resources which markets won't reward. Misusing the term and confusing it with activities that don't create value takes our eye off the causes and moves us away from finding ways of repeatably succeeding.
Recognizing that innoveracy is a problem allows us to address it. Addressing it would mean we could speak a language of value creation that everyone understands.
In this inaugural episode we open with the biggest question facing the biggest technological innovation of our time: the limit to growth of the Internet. The Internet is the backbone of our post-industrial society as much as the railroad was the backbone of the industrial revolution. Even more so, the diffusion of internet consumption is the fundamental engine of growth at a time when industrial economies are all mired in syndromes of underinvestment and misallocation of resources.
And so it matters greatly if and when the Internet will "inflect" in growth, going from acceleration to deceleration. Mobile computing sustained this acceleration, bringing computing and connectivity to the billions for whom the PC would always be beyond reach. But even with the expansion of device-based usage limits are in sight.
The implications could be profound. Frothy valuations and optimism could evaporate. Venture Capital could find few exits and the "second Internet Bubble" could burst. On the other hand, maybe the data shows that opportunity is largely unmet. Quantity of users is but one proxy. How can growth and business model innovation continue?
Philip Elmer-DeWitt cited Piper Jaffray's latest Teen Survey on Device Ownership where ~7,500 teens in the US are asked about their device ownership. This type of data is similar to the method comScore uses to measure penetration smartphones in the US making the two data sets comparable.
The combined data is shown the following graphs.
One graph is the penetration data and the other is the ratio of penetration to unpenetrated on a log scale. The PJC Teen Survey data is shown as dots on both graphs. In the spring of 2012 the difference between teen iPhone ownership and overall population iPhone ownership was 20 percentage points. In the fall 2012 it was 22 points. In spring 2013 it was 25 points. The spread increased to 30 points in the fall of 2013.
This implies that the latest sample (April 2014) should have at least a 31 point lead on what comScore will report in another two months. ((comScore reports data during the first week of a month for a period ending one month earlier. So the April release covers a sampling period ending February)) In other words current iPhone penetration in the US is probably 30%. This assumes of course that the relationship between teens and overall population has not changed. But there is consistency in the pattern of iPhone growth for over 50 months.
In addition, the purchase intent data is showing that there is growing interest and that interest reflects demand which has been largely met by a purchase decision.
Teens are leading adoption in this particular sector because the device is very well suited to the jobs that they need to do, mainly social interaction. It's no coincidence that the audiences for the fastest-rising services (SnapChat, WhatsApp, Vine, YouTube, Instagram) consist mainly of teens. They also lead adoption in FaceBook, iTunes, MySpace, etc. In that regard teens are an early indicator of mainstream behavior.
Teens taught the world new habits throughout the 20th century ((An entertaining review of the contribution (and invention) of teenagers in the 20th century can be enjoyed in James May's 20th Century Episode 5)) and they certainly seem to be teaching us in the present.